End-to-End DevSecOps Deployment for MERN Stack Applications
 Irfan Mestri
Table of contents
- Comprehensive Walkthrough of the Project: Deploying a MERN Stack Application Using Kubernetes and DevSecOps Tools
- Step 1: Setting Up the EC2 Instance
- Step 2: Configuring Jenkins
- Step 3: Setting Up Terraform Backend
- Step 4: Deploying EKS Cluster
- Step 5: Creating a Jump Server
- Step 6: Verifying EKS Cluster
- Step 7: Configuring Load Balancer and Service Account
- Step 8: Setting Up ArgoCD
- Step 9: Configuring SonarQube
- Step 10: Managing Container Images with ECR
- Step 11: Deploying Applications with ArgoCD
- Step 12: Configuring Domain Name with Route 53
- Step 13: Implementing Monitoring with Prometheus and Grafana
- Step 14: Verifying the Application
GitHub Repo:
Application Repo: https://github.com/irfanmestri/MERN-Stack-Application-K8S.git
Infrastructure: https://github.com/irfanmestri/MERN_Stack-EKS-Terraform-GithubActions.git
Comprehensive Walkthrough of the Project: Deploying a MERN Stack Application Using Kubernetes and DevSecOps Tools
This guide will walk you through each step of deploying a MERN stack application using Kubernetes (EKS), incorporating CI/CD pipelines, and implementing monitoring and security tools.
Step 1: Setting Up the EC2 Instance
Objective: Create a foundational EC2 instance to install necessary tools.
Actions:
Launch an EC2 instance, disable SSH, and add a script in the "User Data" section.
The script should automate the installation of:
JDK
Jenkins
Docker
Terraform
AWS CLI
SonarQube image
Trivy
Go to my github Application Repo /Jenkins-Server-TF /tools-install.sh
Here you will get the entire script for installation.
Step 2: Configuring Jenkins
Objective: Automate CI/CD workflows with Jenkins.
Actions:
Install plugins: AWS Pipeline, AWS Credentials, Terraform, and Pipeline Stage View.
Configure Jenkins tools, providing the path to Terraform pre-installed on the EC2 instance.
Step 3: Setting Up Terraform Backend
Objective: Manage infrastructure state securely.
Actions:
Create an S3 bucket and DynamoDB table for Terraform state.
Update the Terraform backend file with the bucket and table names.
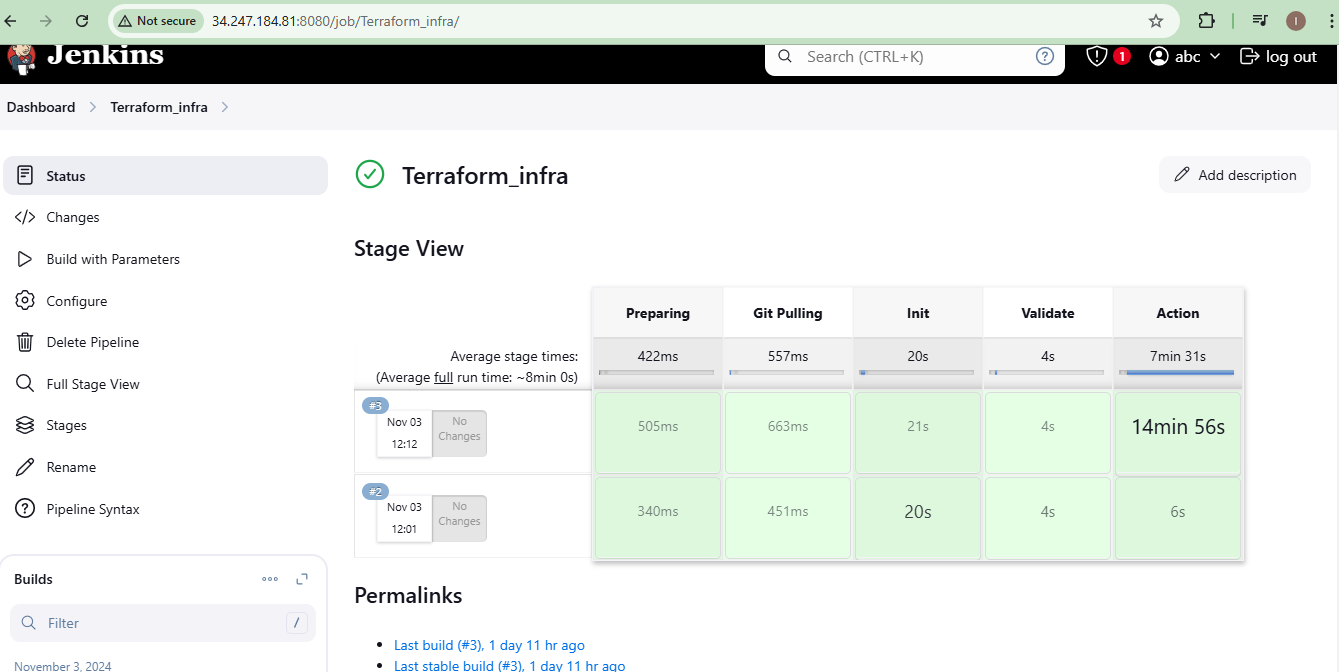
Step 4: Deploying EKS Cluster
Objective: Use Terraform to set up an EKS cluster.
Actions:
Clone a GitHub repo containing EKS Terraform scripts.
Create a Jenkins job, use
terraform planto preview resources, andterraform applyto deploy them.
Step 5: Creating a Jump Server
Objective: Enable secure communication with the EKS cluster.
Actions:
Launch another EC2 instance as a jump server.
Install AWS CLI,
kubectl, Helm, andeksctlfor cluster management.
Step 6: Verifying EKS Cluster
Objective: Confirm EKS cluster readiness.
Actions:
Configure AWS CLI with
aws configure.Update the kubeconfig for EKS and verify node statuses with:
kubectl get nodes
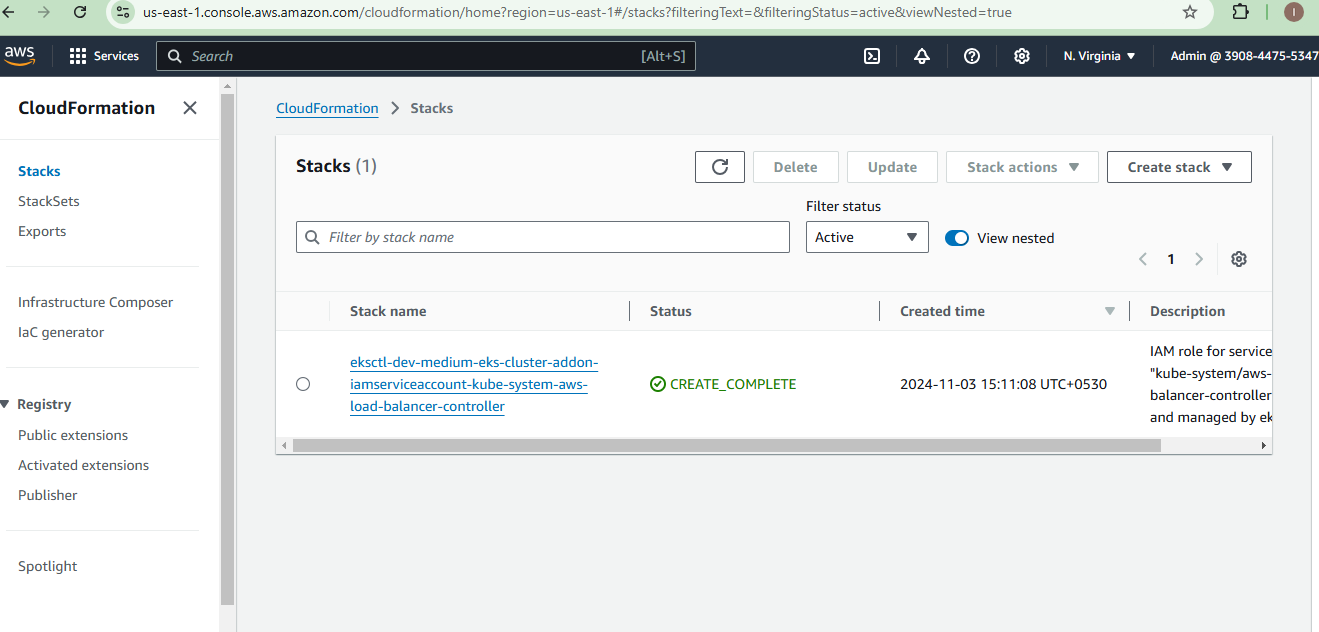
Step 7: Configuring Load Balancer and Service Account
Objective: Manage external traffic to Kubernetes services.
Actions:
Create an IAM policy for the Load Balancer.
Set up a service account to manage the AWS Load Balancer Controller.
Install the Load Balancer Controller using Helm.
Step 8: Setting Up ArgoCD
Objective: Automate Kubernetes deployments.
Actions:
Create an ArgoCD namespace and apply its manifest file.
Expose ArgoCD as a LoadBalancer service to access it via DNS.
Step 9: Configuring SonarQube
Objective: Implement code quality and security checks.
Actions:
Run SonarQube in Docker, create tokens, and integrate them into Jenkins.
Set up separate SonarQube projects for the frontend and backend.
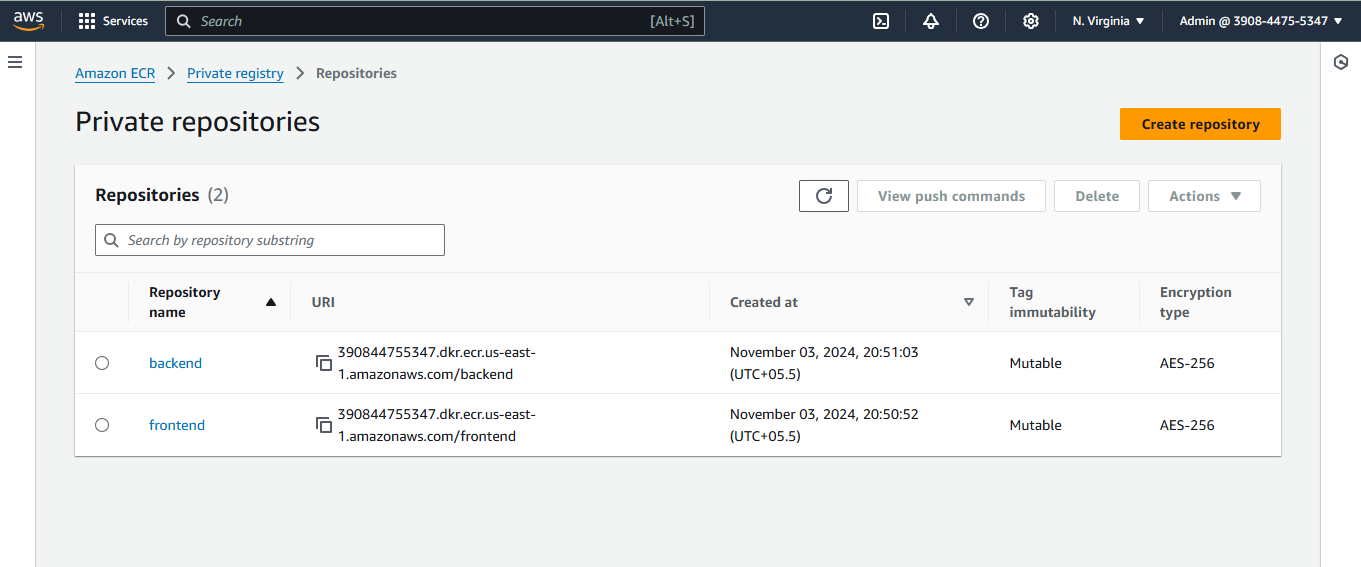
Step 10: Managing Container Images with ECR
Objective: Store Docker images securely.
Actions:
Create ECR repositories for frontend and backend images.
Use Jenkins pipelines to build and push Docker images to ECR.
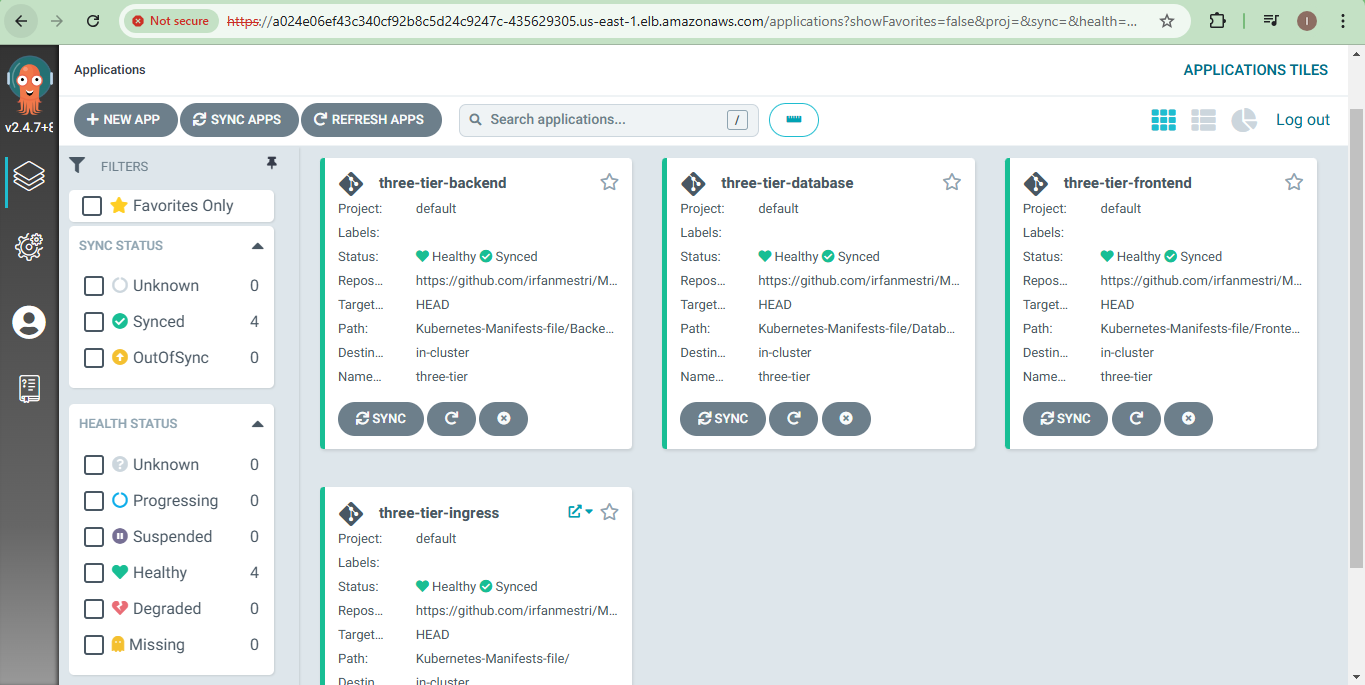
Step 11: Deploying Applications with ArgoCD
Objective: Deploy the database, backend, and frontend services.
Actions:
Create ArgoCD applications for each component.
Use GitHub as the source and define appropriate namespaces.
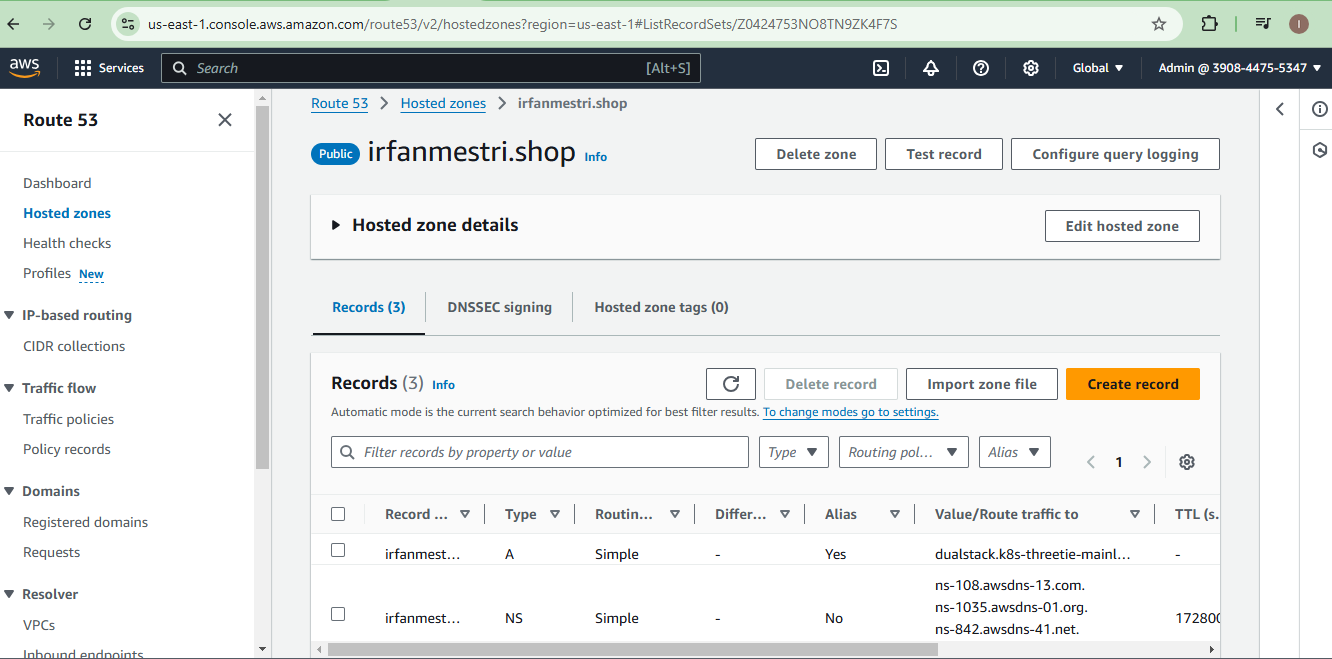
Step 12: Configuring Domain Name with Route 53
Objective: Enable public access to the application.
Actions:
Create a hosted zone in Route 53.
Add "A" records pointing to the Load Balancer.
Update domain name servers with Route 53's details. (If you have purchased from another domain registrar)
Step 13: Implementing Monitoring with Prometheus and Grafana
Objective: Monitor application and infrastructure performance.
Actions:
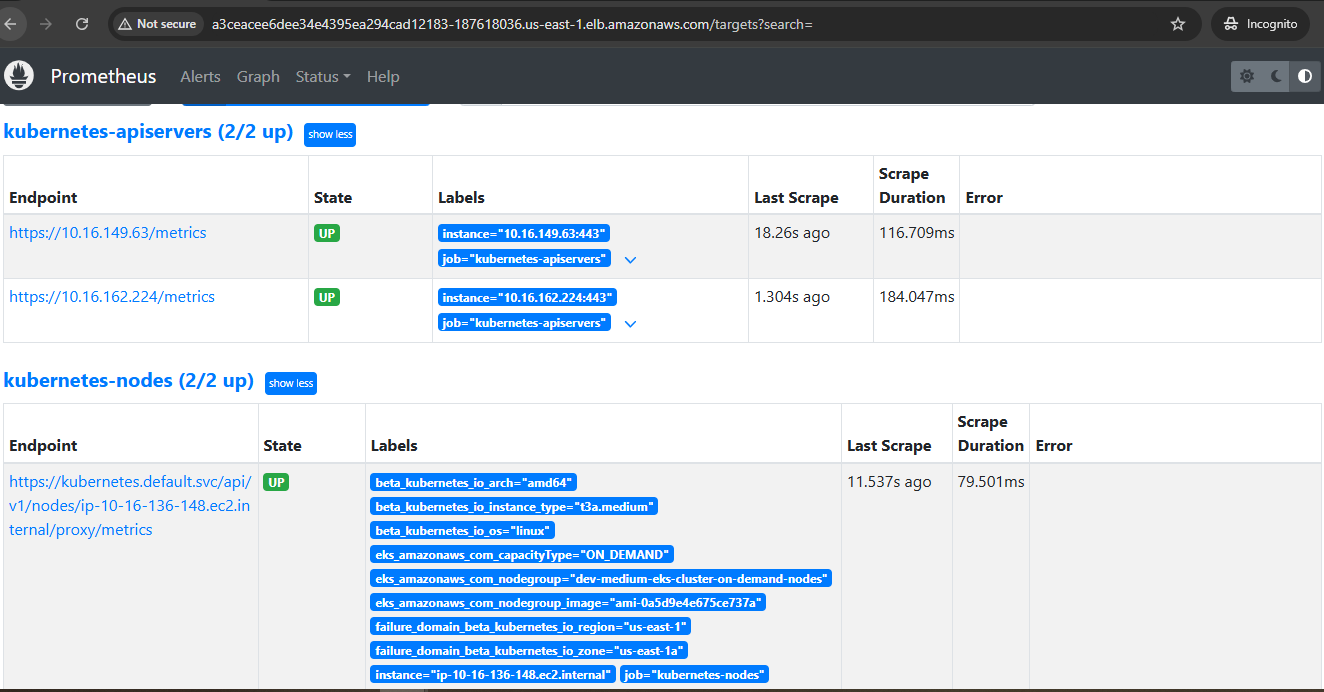
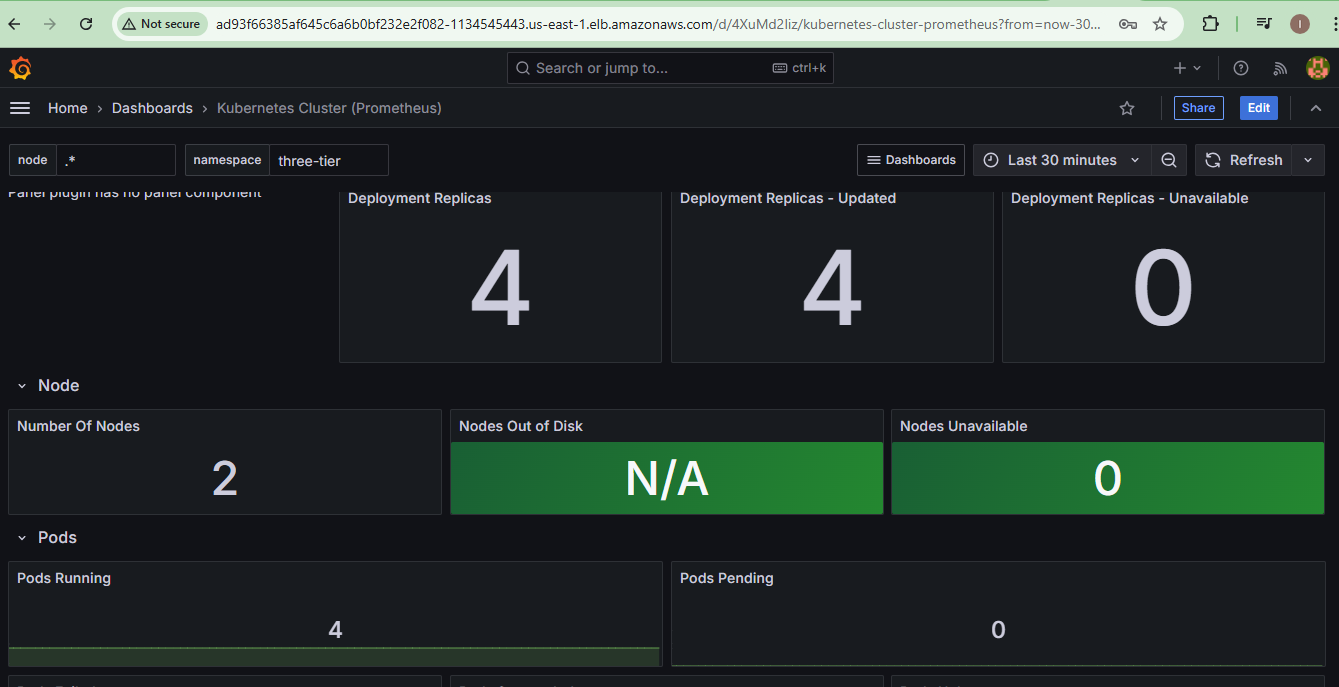
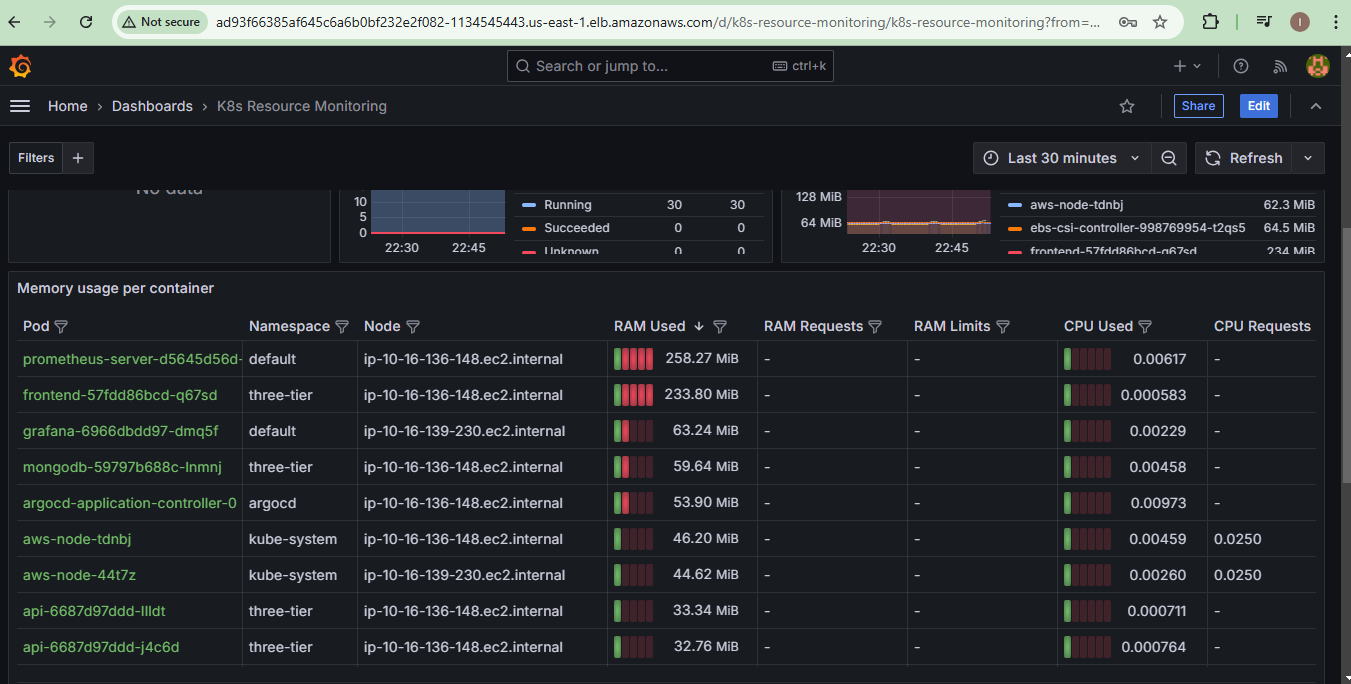
Install Prometheus and Grafana using Helm.
Expose Prometheus and Grafana services via LoadBalancer.
Configure Prometheus as a data source in Grafana.
Import pre-built dashboards or create custom ones.
Prometheus:
Grafana Dashboard 1:
Grafana Dashboard 2:
Step 14: Verifying the Application
Objective: Ensure successful deployment.
Actions:
Access the application via the configured domain.
Use Grafana dashboards to monitor the health and performance of your application and infrastructure.
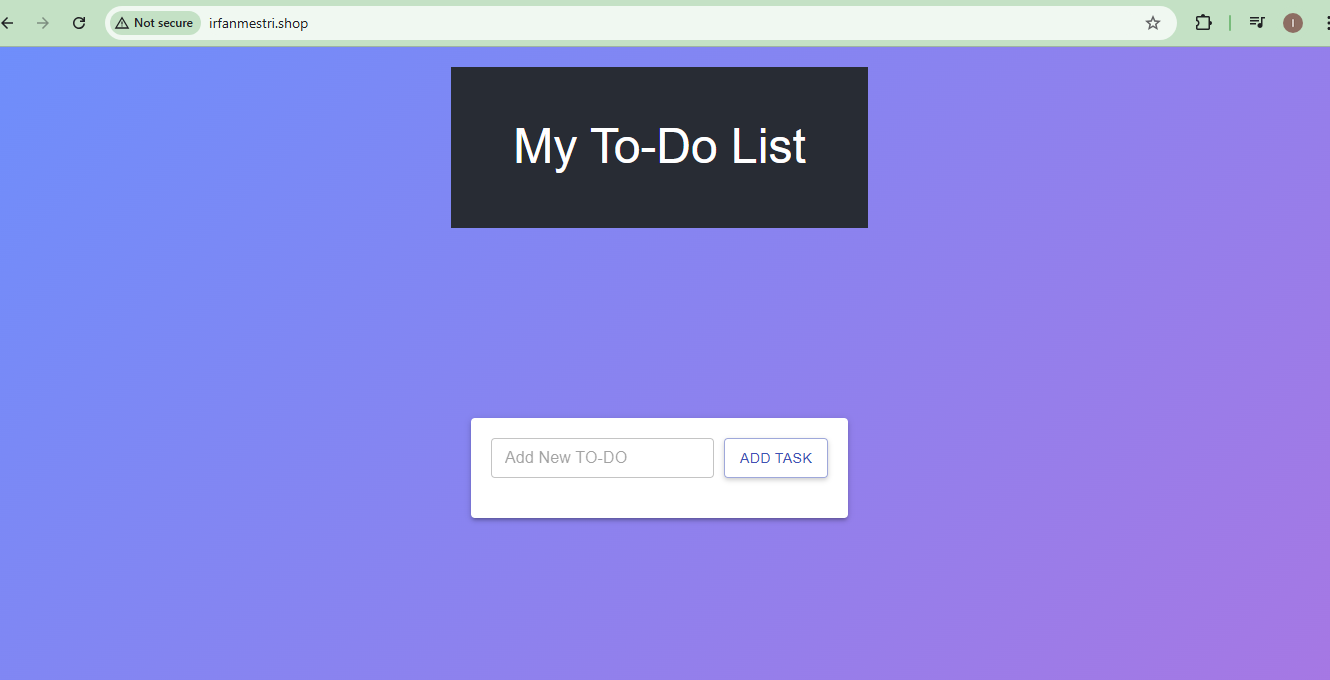
This guide ensures a structured approach to deploying a MERN stack application while incorporating DevSecOps best practices. Let me know if you need further clarification on any step!
Subscribe to my newsletter
Read articles from Irfan Mestri directly inside your inbox. Subscribe to the newsletter, and don't miss out.
Written by

Irfan Mestri
Irfan Mestri
Aspiring DevOps Engineer | Passionate about Cloud & Automation 🌩️ | Learning AWS, Linux, and DevOps Tools ⚙️ I'm diving into the world of DevOps, starting with the basics of AWS, Linux, and essential DevOps tools. With a growing passion for cloud technologies and automation, I’m excited to build scalable, secure, and efficient solutions. Follow along as I document my learning journey, share insights, and tackle real-world projects!