10 Kubernetes Questions: Test Your Understanding of Kubernetes
 Nan Song
Here are 10 Kubernetes, let’s check how many questions you can answer?
In a two-node cluster, with one node already hosting pods and the other empty, how does Kubernetes decide where to schedule a new pod?
When a containerized application runs out of memory (OOM), does Kubernetes restart the container only, or does it also recreate the pod?
Is it possible to update environment variables or ConfigMaps for an application without restarting its pod?
Are pods inherently stable after creation, even if no further user interaction occurs?
Does a ClusterIP Service evenly distribute TCP traffic by default?
How should application logs be collected, and is there a risk of losing logs?
If the livenessProbe for a pod passes, does that guarantee the application is functioning correctly?
How can applications scale to handle traffic fluctuations inside Kubernetes?
When you execute kubectl exec -it <pod> -- bash, are you able to directly access the pod ?
How should you diagnose an issue where a container in a pod keeps crashing and restarting?
Can you quickly answer these questions while paying attention to the key points?
Let’s go through these questions one at a time, and feel free to share your additional insights or points in the comments!
< 1 > In a two-node cluster, with one node already hosting pods and the other empty, how does Kubernetes decide where to schedule a new pod?
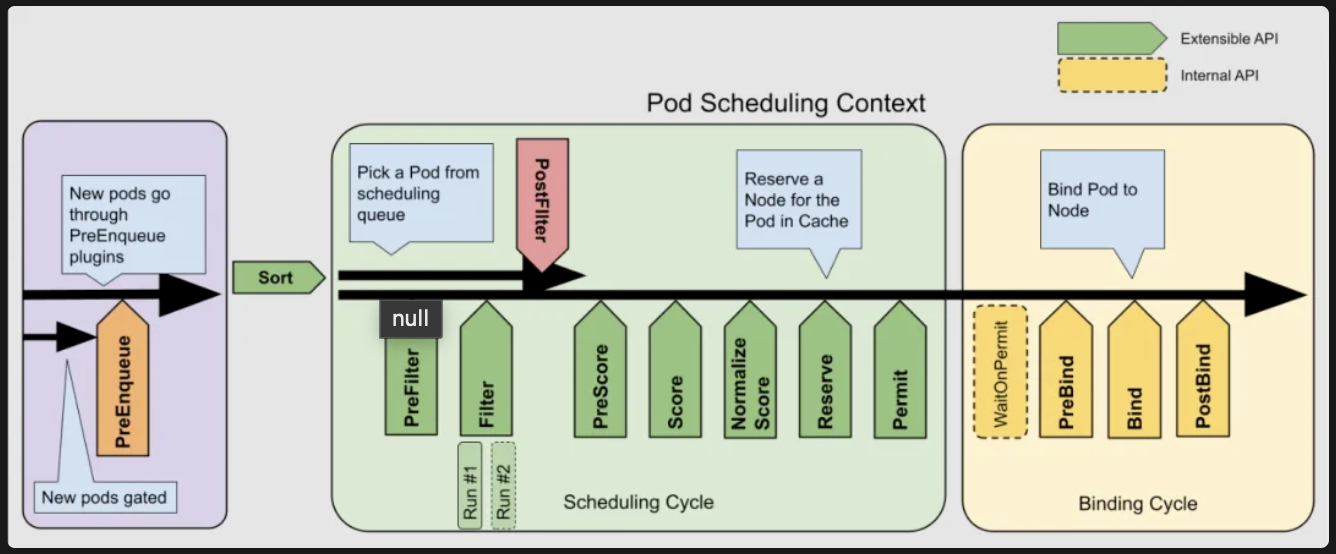
Answer: let’s review the process of k8s scheduler

The configuration at various levels, as well as Pod-specific settings (such as forced scheduling, affinity, and taint tolerations), can all influence the scheduling outcome. However, if we disregard these configurations and assume equal resources across nodes, the scoring strategy of the default plugin NodeResourcesFit plays a key role. NodeResourcesFit has three scoring strategies:
• LeastAllocated (default, prioritizes nodes with the lowest resource utilization),
• MostAllocated (prioritizes nodes with higher resource utilization), and
• RequestedToCapacityRatio (balances resource utilization across nodes).
This means that when using the MostAllocated strategy, the new pod will be scheduled on the node that already has pods. Conversely, with the other two strategies (LeastAllocated and RequestedToCapacityRatio), the pod will be scheduled on the empty node.
< 2 > When a containerized application runs out of memory (OOM), does Kubernetes restart the container only, or does it also recreate the pod?
Answer: It will depend. When a container encounters an OOM (Out-of-Memory) error, it is generally restarted based on the Pod’s RestartPolicy configuration (default is Always), meaning the Pod itself is not recreated. However, in scenarios where the node is under significant memory pressure, Kubernetes may evict the Pod, resulting in its recreation on another node.
< 3 > Is it possible to update environment variables or ConfigMaps for an application without restarting its pod?
Answer: Environment variables are static and cannot be updated dynamically. However, ConfigMaps can be updated dynamically if they are mounted as volumes without using subPath. The update synchronization delay is influenced by the kubelet configuration, particularly the syncFrequency setting (default is 1 minute) and the configMapAndSecretChangeDetectionStrategy option.
< 4 > Are pods inherently stable after creation, even if no further user interaction occurs?
Answer: It will depend again. A Pod may be evicted due to factors like insufficient node resources or network disruptions, even without any user actions.
< 5 > Does a ClusterIP Service evenly distribute TCP traffic by default?
Answer: It will not always evenly distribute the TCP traffic. ClusterIP Services, whether implemented with iptables or ipvs, depend on the Linux kernel’s Netfilter. The connection tracking mechanism within Netfilter monitors and maintains the state of each connection, ensuring that existing TCP connections remain on the same path. This can lead to load imbalances for long-lived connections.
< 6 > How should application logs be collected, and is there a risk of losing logs?
Answer: Application logs are usually directed to stdout/stderr or written to log files. For logs output to stdout/stderr, they are stored in specific locations on the node and can be collected by log agents like Fluentd or Promtail, typically deployed as DaemonSets. However, there is a risk of losing logs if a pod is deleted before the log agent finishes collecting them, as the container’s log files are removed upon pod deletion. To prevent log loss, logs can be written to files stored on persistent storage.
< 7 > If the livenessProbe for a pod passes, does that guarantee the application is functioning correctly?
Answer: From the application’s perspective, the livenessProbe is designed to check if the application process is alive but does not validate whether it is functioning correctly. For instance, the application might remain technically alive but be in an unhealthy or non-operational state where it cannot serve requests properly.
From the network’s perspective, a livenessProbe (e.g., configured with httpGet) is initiated by the kubelet on the local node where the pod is running. This means it only validates local connectivity and cannot guarantee that network communication between nodes is functional.
High Bonus Answers:
By combining livenessProbe and readinessProbe is a best practice to ensure the application starts up and functions as expected. Here’s how they complement each other and why using both is beneficial:
Purpose of Each Probe
1. LivenessProbe:
• Ensures the application process is alive.
• Restarts the container if it is stuck, unresponsive, or in a non-recoverable state.
• Useful for detecting and addressing “deadlocks” or unrecoverable errors.
2. ReadinessProbe:
• Ensures the application is ready to handle traffic.
• Temporarily removes the pod from the Service’s endpoints if the application is not yet ready or temporarily unhealthy.
• Prevents sending requests to pods that are still initializing or experiencing transient issues.
How They Work Together
• At Startup:
Use the readinessProbe to confirm that the application has fully initialized before routing traffic to it. The livenessProbe ensures the process remains alive during this stage.
• During Runtime:
The livenessProbe continuously checks if the application is running. If the application encounters an unrecoverable state, Kubernetes restarts the container. The readinessProbe checks that the application can process requests and temporarily halts traffic if it encounters issues.
• Failure Scenarios:
If the application is alive but not functioning properly (e.g., it is alive but not accepting requests), the readinessProbe ensures the application is removed from the Service’s load balancer until it recovers.
Conversely, if the application is completely unresponsive, the livenessProbe ensures it is restarted.
< 8 > How can applications scale to handle traffic fluctuations inside Kubernetes?
Answer: Kubernetes offers two scaling mechanisms: Horizontal Pod Autoscaling (HPA) and Vertical Pod Autoscaling (VPA). HPA dynamically adjusts the number of pods based on metrics such as CPU utilization, request rates, or custom-defined metrics, making it the preferred choice for most scenarios. VPA, on the other hand, traditionally required deleting and recreating pods to adjust their resource allocations, which limited its use cases.
Bonus answer point
However, starting from Kubernetes 1.27, with the introduction of the VPA feature gate, VPA can now dynamically adjust CPU and memory resources without requiring pod recreation, significantly expanding its applicability. Additionally, external monitoring systems can be integrated to observe metrics and send scaling requests directly to the kube-apiserver, providing even greater flexibility for pod scaling.
< 9 > When you execute kubectl exec -it <pod> -- bash, are you able to directly access the pod ?
Answer: When using kubectl exec, you typically need to specify the container, unless the Pod has only one container, in which case this step can be skipped. A Pod is essentially a collection of isolated Linux namespaces. Containers within the same Pod share the Network, IPC, and UTS namespaces, but each container has its own separate PID and Mount namespaces.
The term “login” is misleading in this context. Running kubectl exec -it <pod> -- bash doesn’t mean you’re accessing the Pod or the container directly. Instead, it creates a new bash process within the isolated environment of the target container.
< 10 > How should you diagnose an issue where a container in a pod keeps crashing and restarting?
Answer:
If a container within a Pod is repeatedly crashing and restarting, using kubectl exec will not be possible because the container does not stay active long enough for the command to execute. In such situations, here are several approaches to troubleshoot and resolve the issue:
Check Logs:
Use kubectl logs <pod> -c <container> to review the container’s logs. If the container crashes too quickly, include the --previous flag to retrieve logs from the last terminated container instance.
Inspect Pod and Node Status:
Run kubectl describe pod <pod> to examine the events and check for any resource issues, such as OOM (Out-of-Memory) errors. Additionally, inspect the node hosting the Pod for resource constraints or other issues.
Use kubectl debug:
Launch a temporary container within the same Pod using kubectl debug --image=<debug-image> <pod>. This allows you to inspect the Pod’s environment, network configurations, and dependencies without requiring the crashing container to be operational.
Analyze Resource Requests and Limits:
Verify that the Pod’s resource requests and limits are appropriately configured. Resource limits that are too restrictive can lead to frequent OOM or throttling issues, causing the container to crash.
Review Readiness and Liveness Probes:
Misconfigured liveness or readiness probes can cause unnecessary restarts. Double-check their settings and ensure the application can meet the probe’s requirements.
Examine Dependency Failures:
If the container relies on external services (e.g., databases, APIs), ensure those dependencies are accessible and functioning. Connection failures can often cause containers to exit.
Debug Locally:
If possible, replicate the container’s environment locally using the same image. Running the container locally can help identify application-level bugs or dependency issues.
Check for Recent Changes:
Investigate any recent updates to the application, container image, or configuration files that may have introduced bugs or incompatibilities.
Set RestartPolicy for Debugging:
Temporarily update the Pod’s RestartPolicy to Never in the YAML file. This prevents the Pod from restarting continuously and allows you to inspect the container’s final state.
Monitor Metrics:
Use tools like Prometheus, Grafana, or cloud-specific monitoring services to analyze container resource usage and identify patterns leading to crashes.
By combining these techniques, you can systematically investigate the root cause and resolve the issue causing the container to crash.
What do you think of these question?
Subscribe to my newsletter
Read articles from Nan Song directly inside your inbox. Subscribe to the newsletter, and don't miss out.
Written by
