A Comprehensive Guide to Containerizing Applications, Orchestrating with Kubernetes, and Monitoring with Prometheus.
 Akaeze Kosisochukwu
This article is a step-by-step practical guide on deploying a containerized application on Amazon EKS, monitoring the application using Prometheus and Grafana, and creating a CI/CD Pipeline to facilitate our workflow. The Frontend uses NextJs while the Backend uses Python and fast API
Let’s get started!!
Prerequisite
AWS Account
Basic knowledge of Kubernetes.
Basic knowledge of FastAPI, Docker, and Python
Basic knowledge of Prometheus and Grafana
Basic knowledge of Docker & Docker Compose
Local Deployment
Before we get to the highlight which is deploying and monitoring our application, we will need to do the below to test our application locally.
Clone the repository here
install the packages in the requirements.txt file by running this command.
pip install -r requirements.txtcreate an S3 bucket named “qr-codes-generator“ and enable public access to make the images accessible to anyone.
create a “.env“ file in the root folder and replace the placeholder with your AWS credentials. Ensure the credentials are the same as what you have on the “~./aws/credentials“ file.
This approach is temporary and will be adjusted when we transition to Kubernetes.
 AWS_ACCESS_KEY_ID=<your-access-key>
 AWS_SECRET_ACCESS_KEY=<your-secret-access-key>
 AWS_REGION=<replace-with-your-region>
 S3_BUCKET_NAME=<replace-with-your-bucketname>
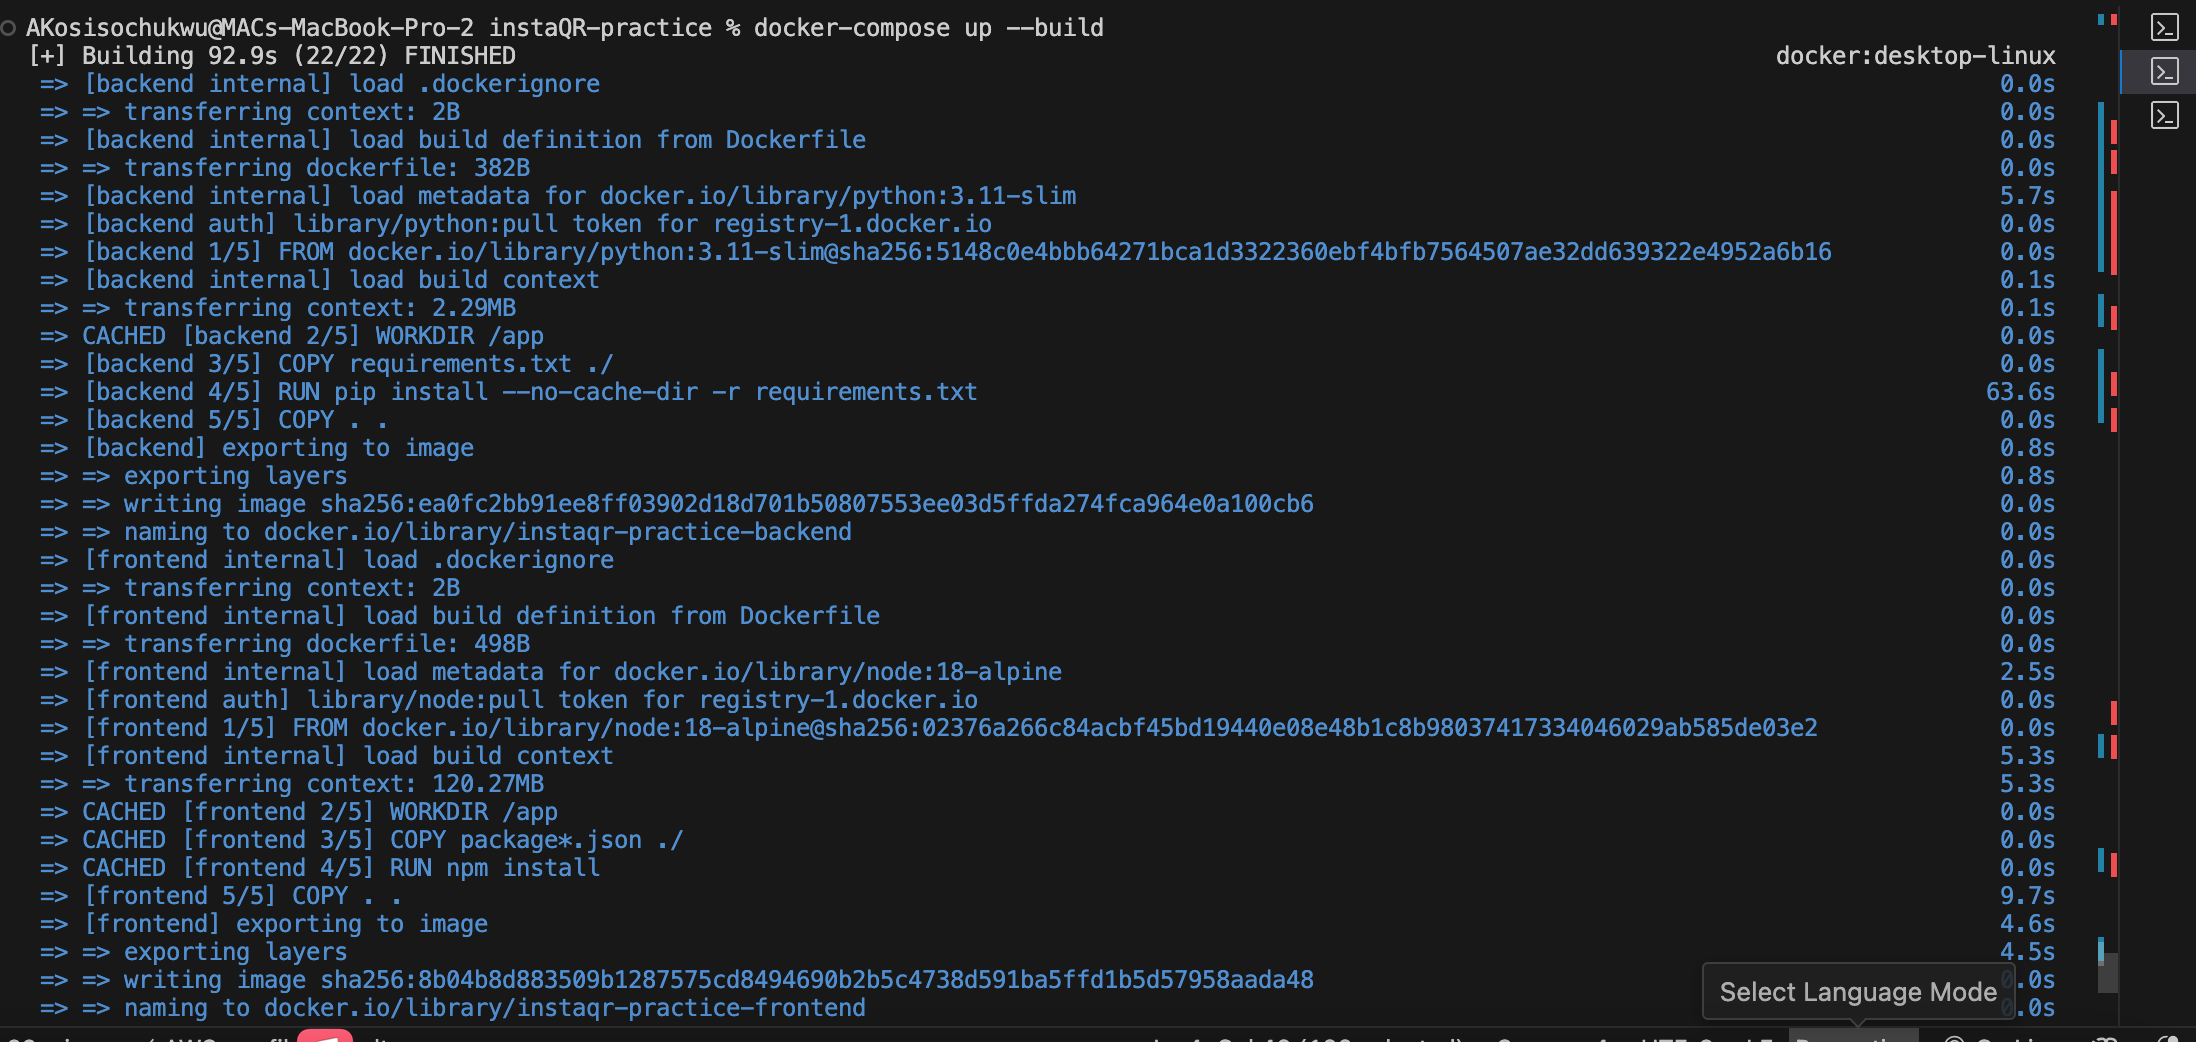
Then run “docker-compose up --build“ to build and run the containers locally using the docker-compose.yml file. This helps us to test our application locally
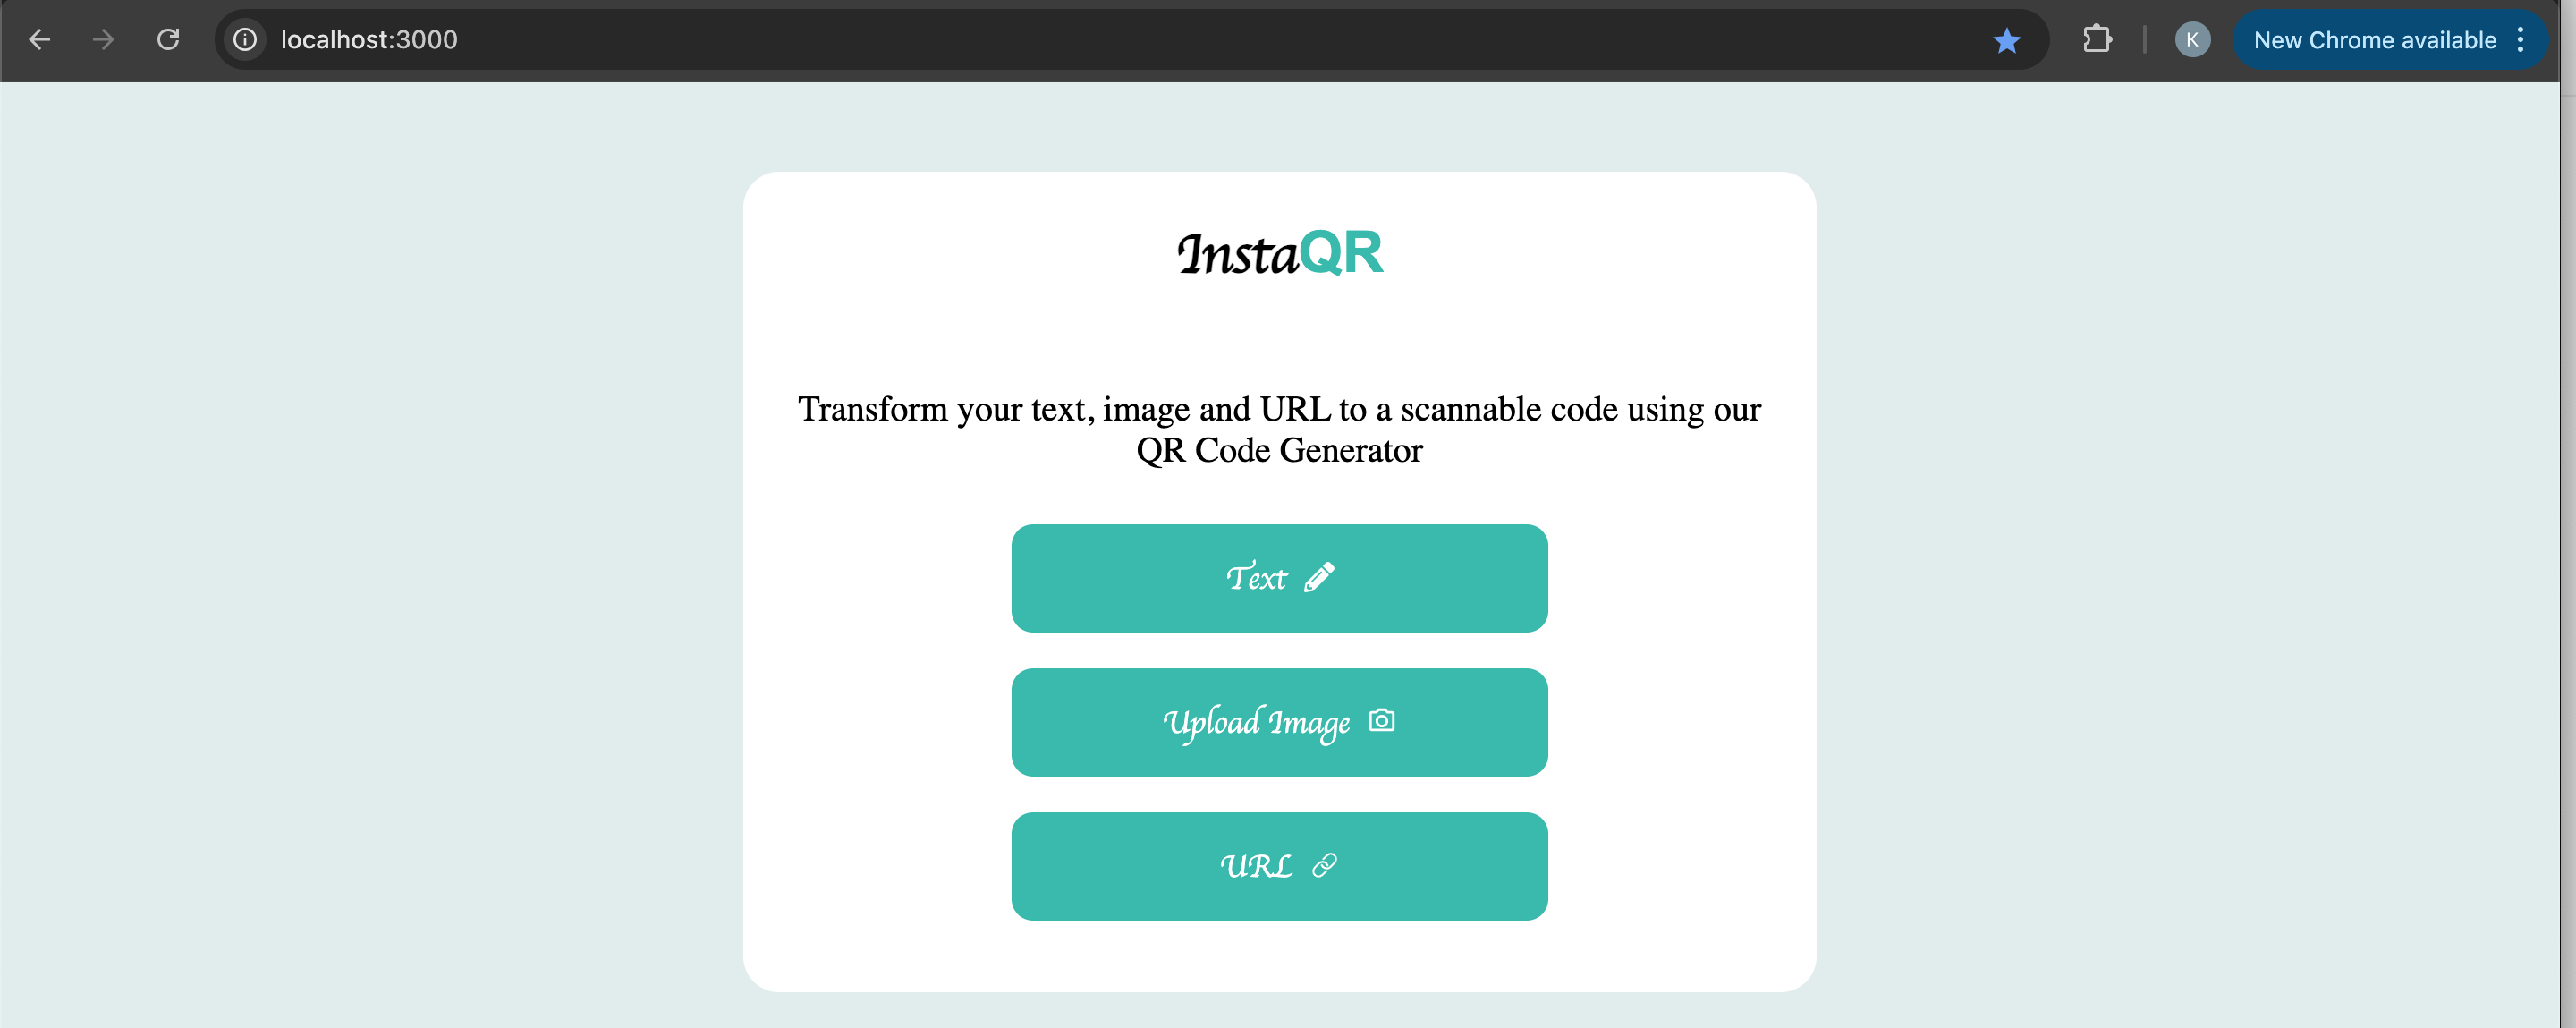
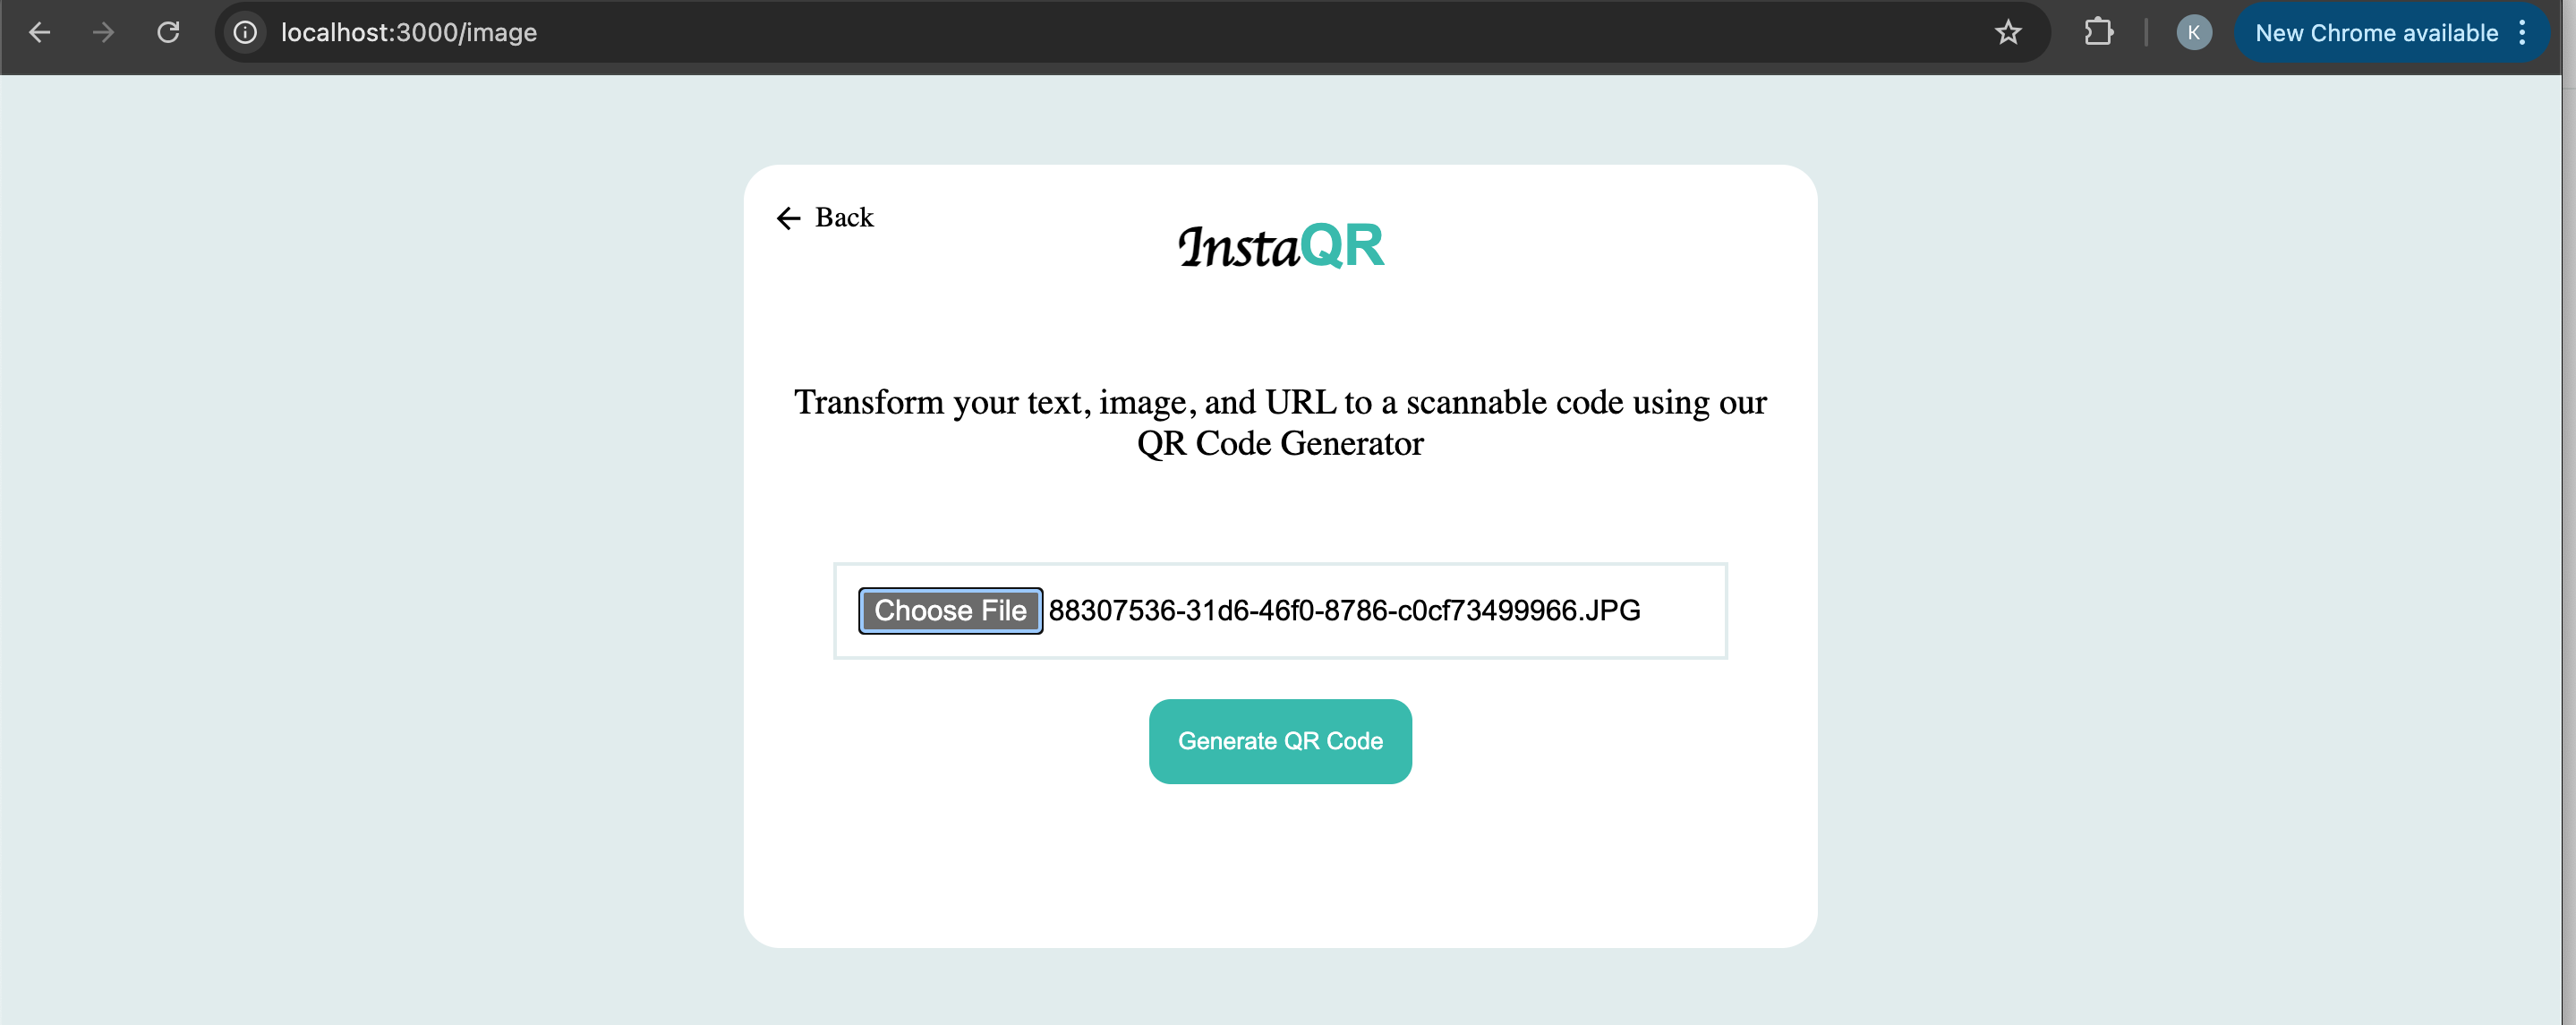
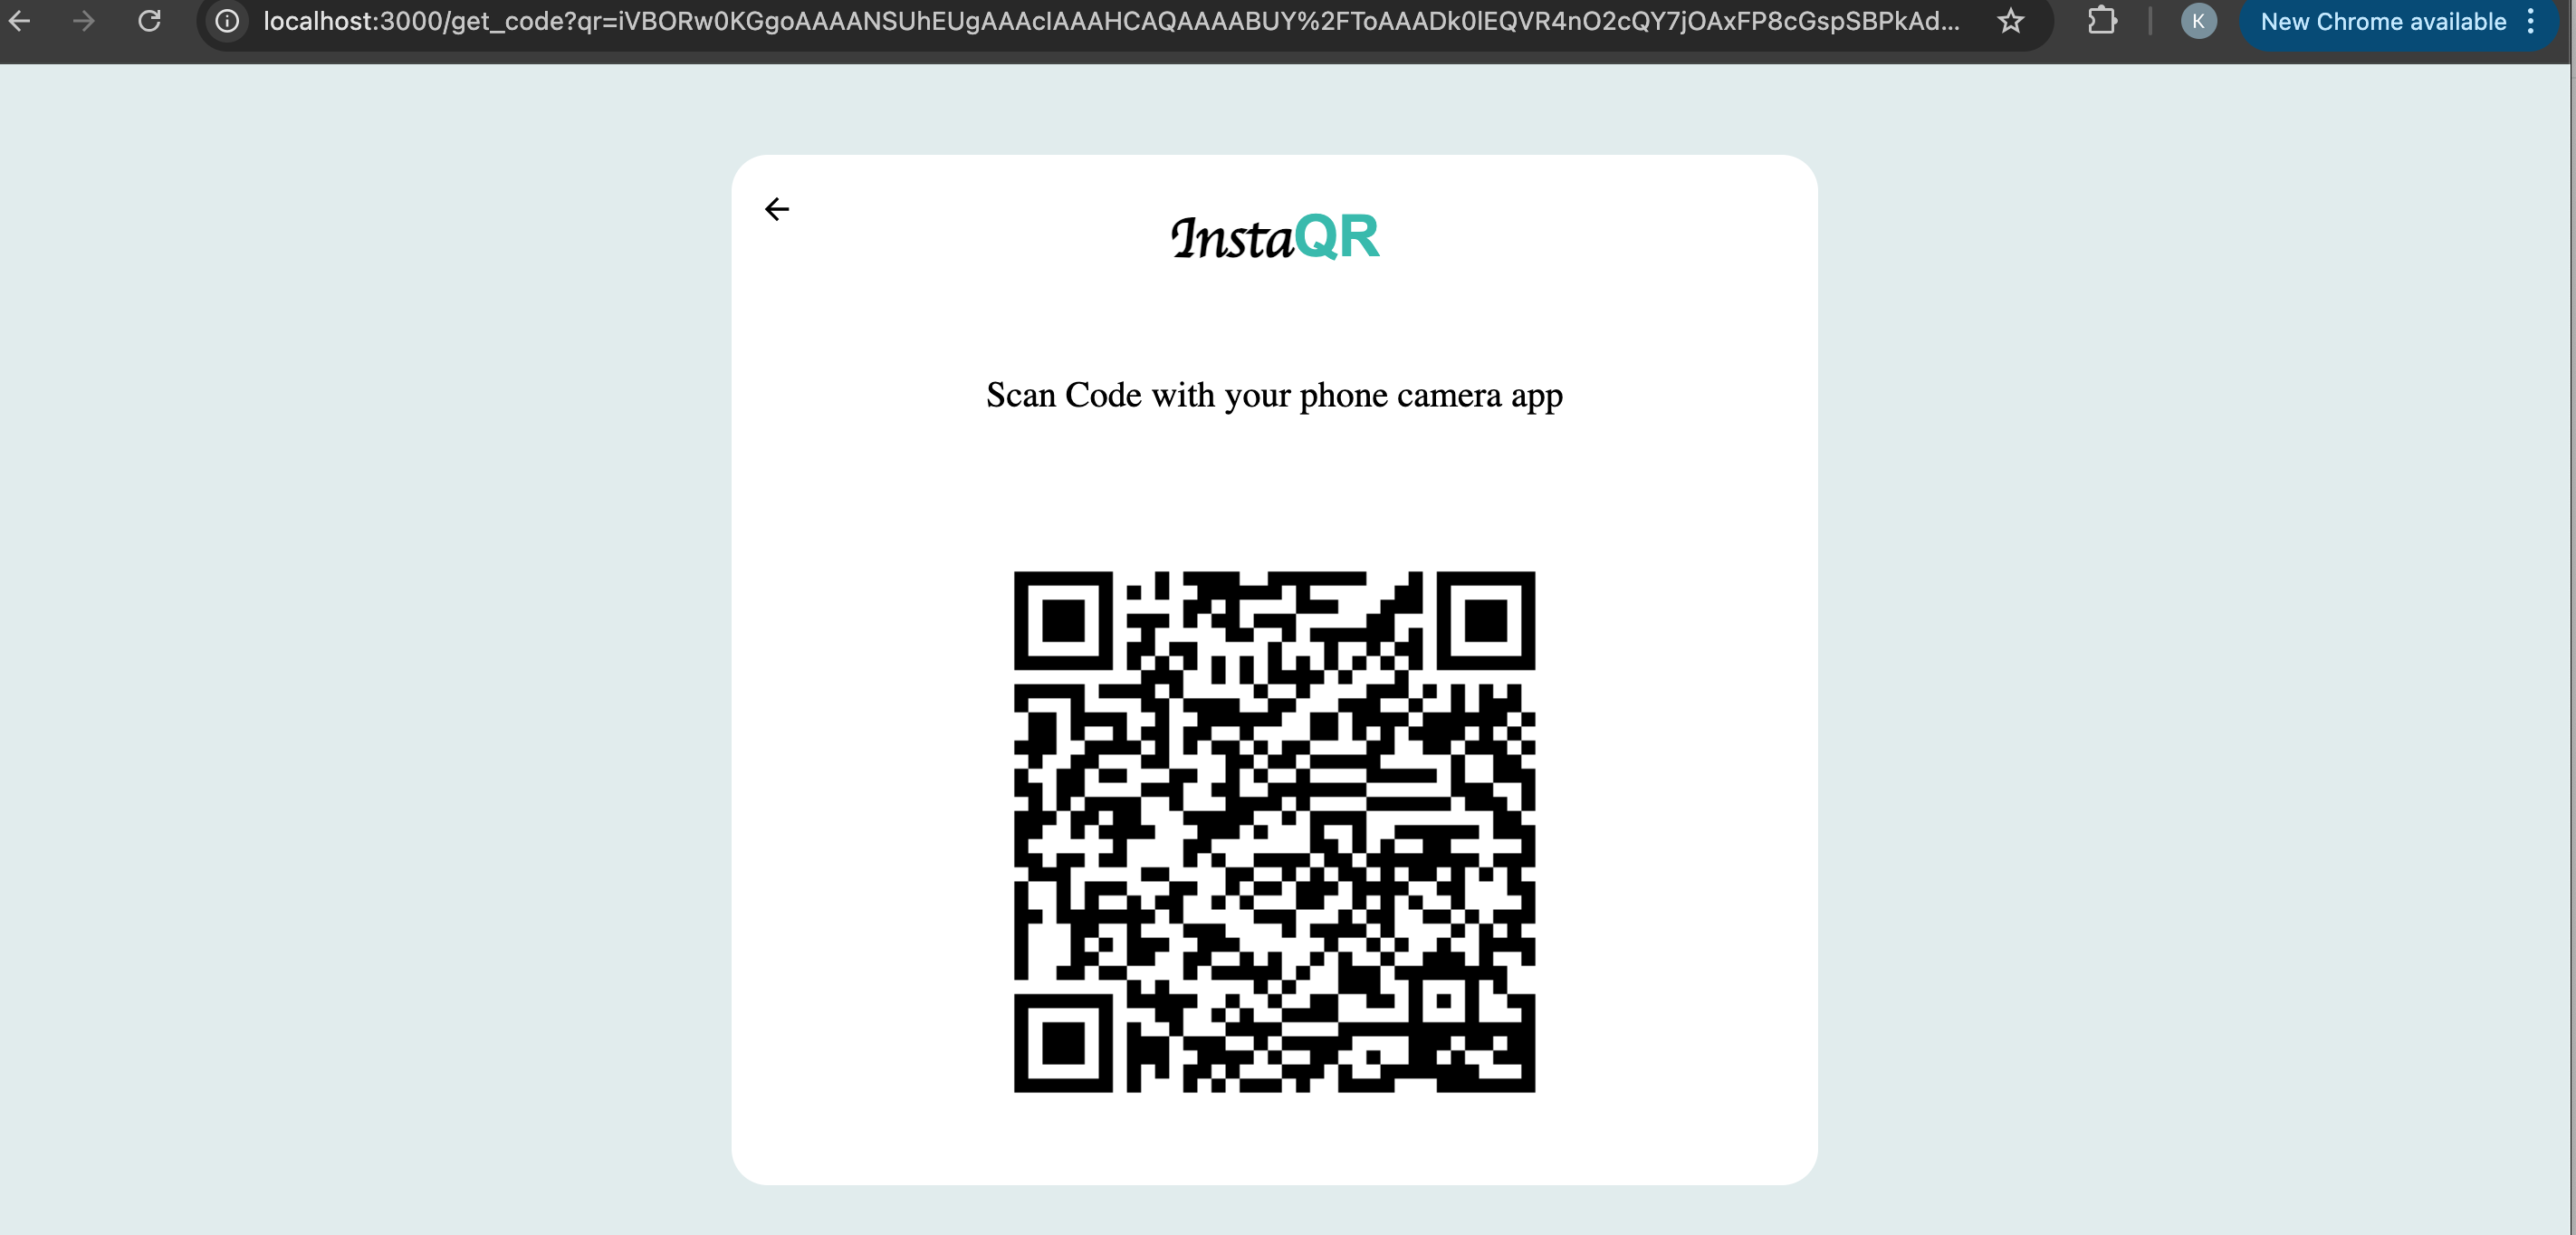
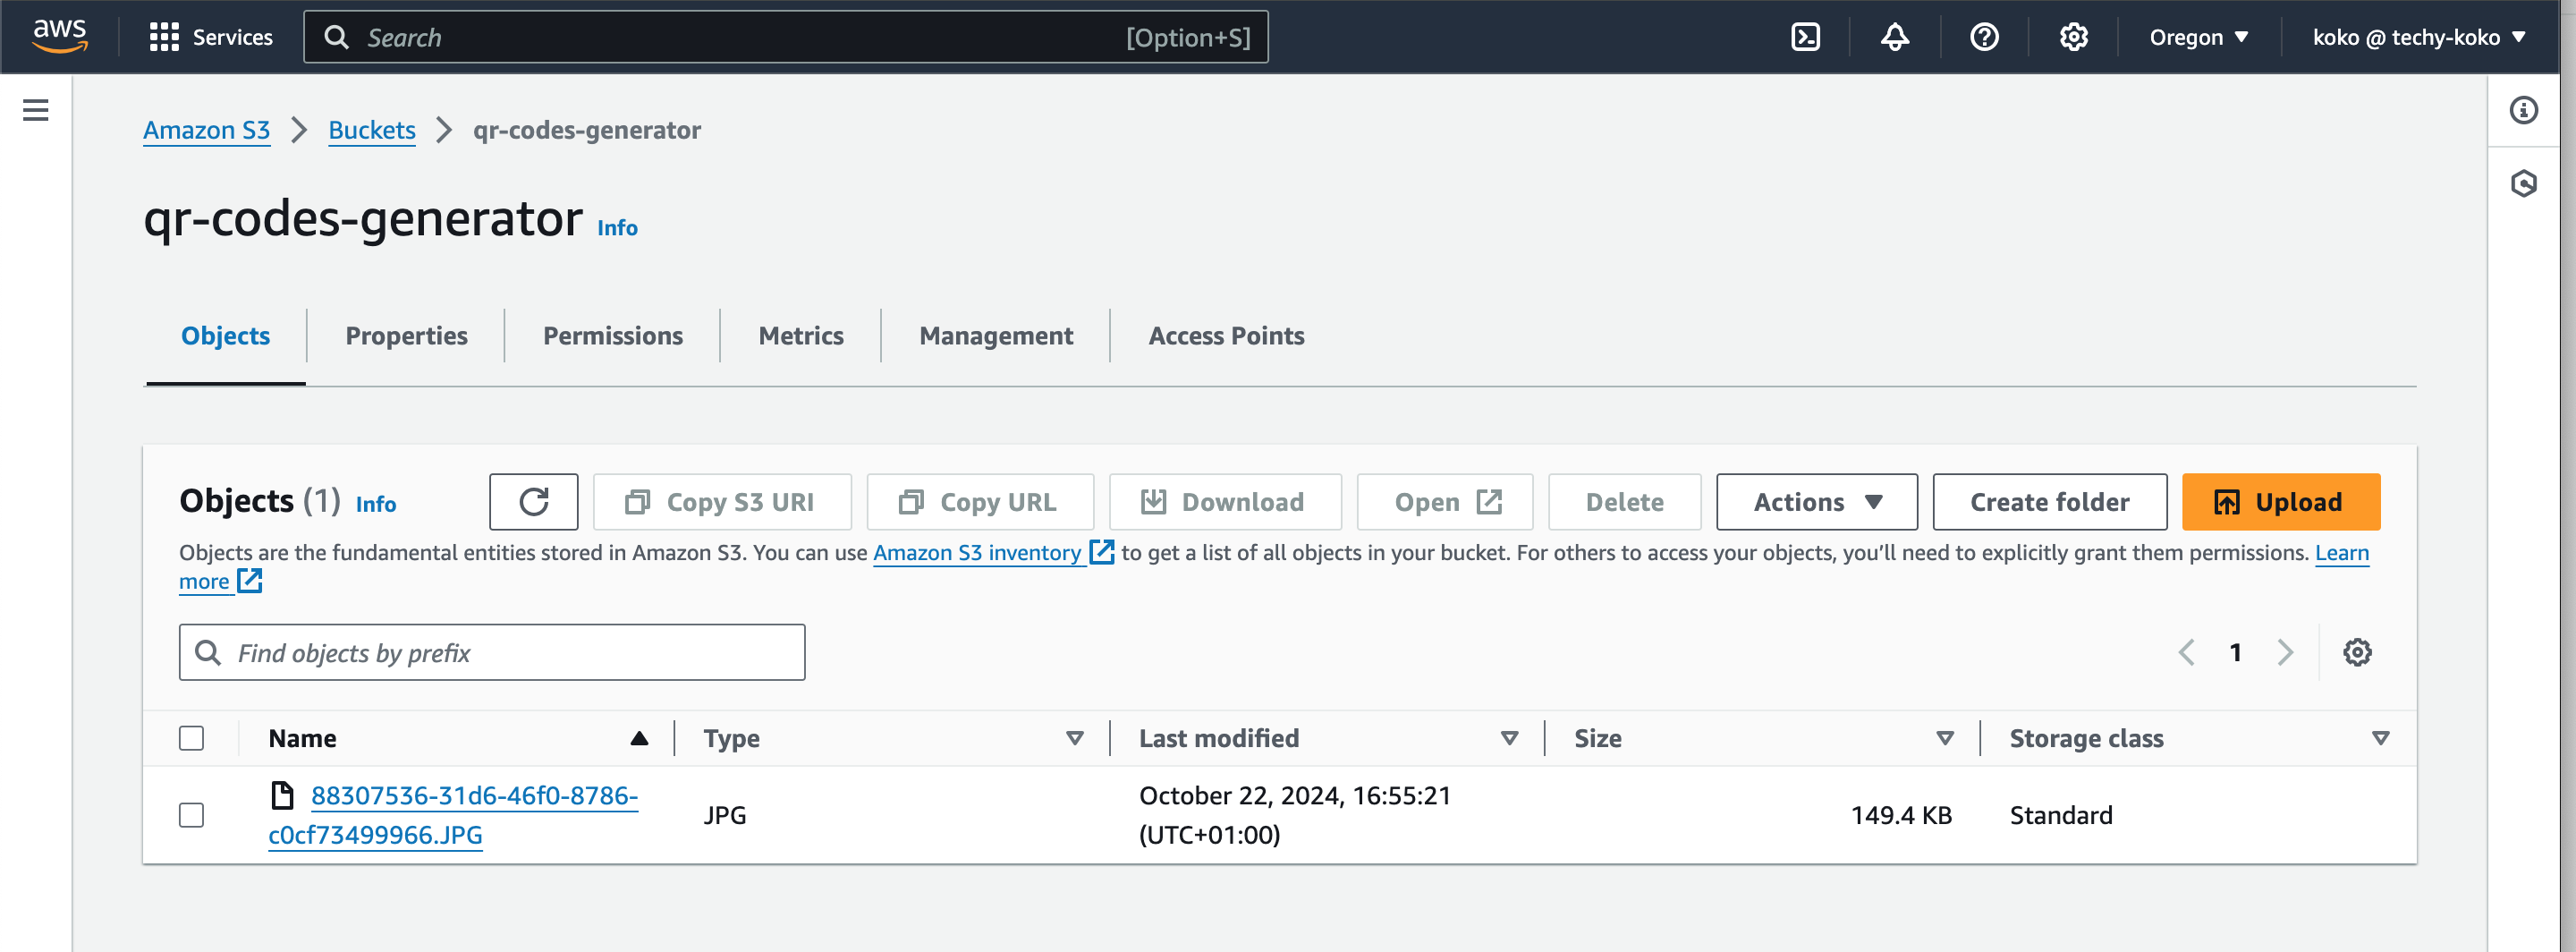
And now we can see our application running, also we can see the list of uploaded images in the created AWS S3 bucket
Next Up is to deploy the application on AWS Elastic Kubernetes Service (EKS).
Deploying on AWS EKS.
Amazon Elastic Kubernetes Service (Amazon EKS) is a managed Kubernetes service that runs Kubernetes in the AWS cloud. it abstracts the complexity overhead of managing a Kubernetes cluster away from the user. Follow the steps below to deploy the QR Code Generator app on EKS.
Push your Container Images to Amazon ECR
Initially, we ran the application locally using
docker-compose. However, since we are deploying the application on an external host, which is EKS, we need to build container images for the backend and frontend. A container image is a lightweight, standalone snapshot that includes everything needed to run the application (code, libraries, environment, etc.). We will push these images to Amazon ECR (Elastic Container Registry) so they can be accessed by the EKS cluster during deployment.Authenticate Docker with ECR with this command
aws ecr get-login-password --region <your-region> | docker login --username AWS --password-stdin <aws_account_id>.dkr.ecr.<your-region>.amazonaws.com
Create an ECR Repository for Each Service (Frontend & Backend)
replace the placeholders with your correct repository name and region.
  aws ecr create-repository --repository-name <repository-name> --region <your-region>
  aws ecr create-repository --repository-name <repository-name> --region <your-region>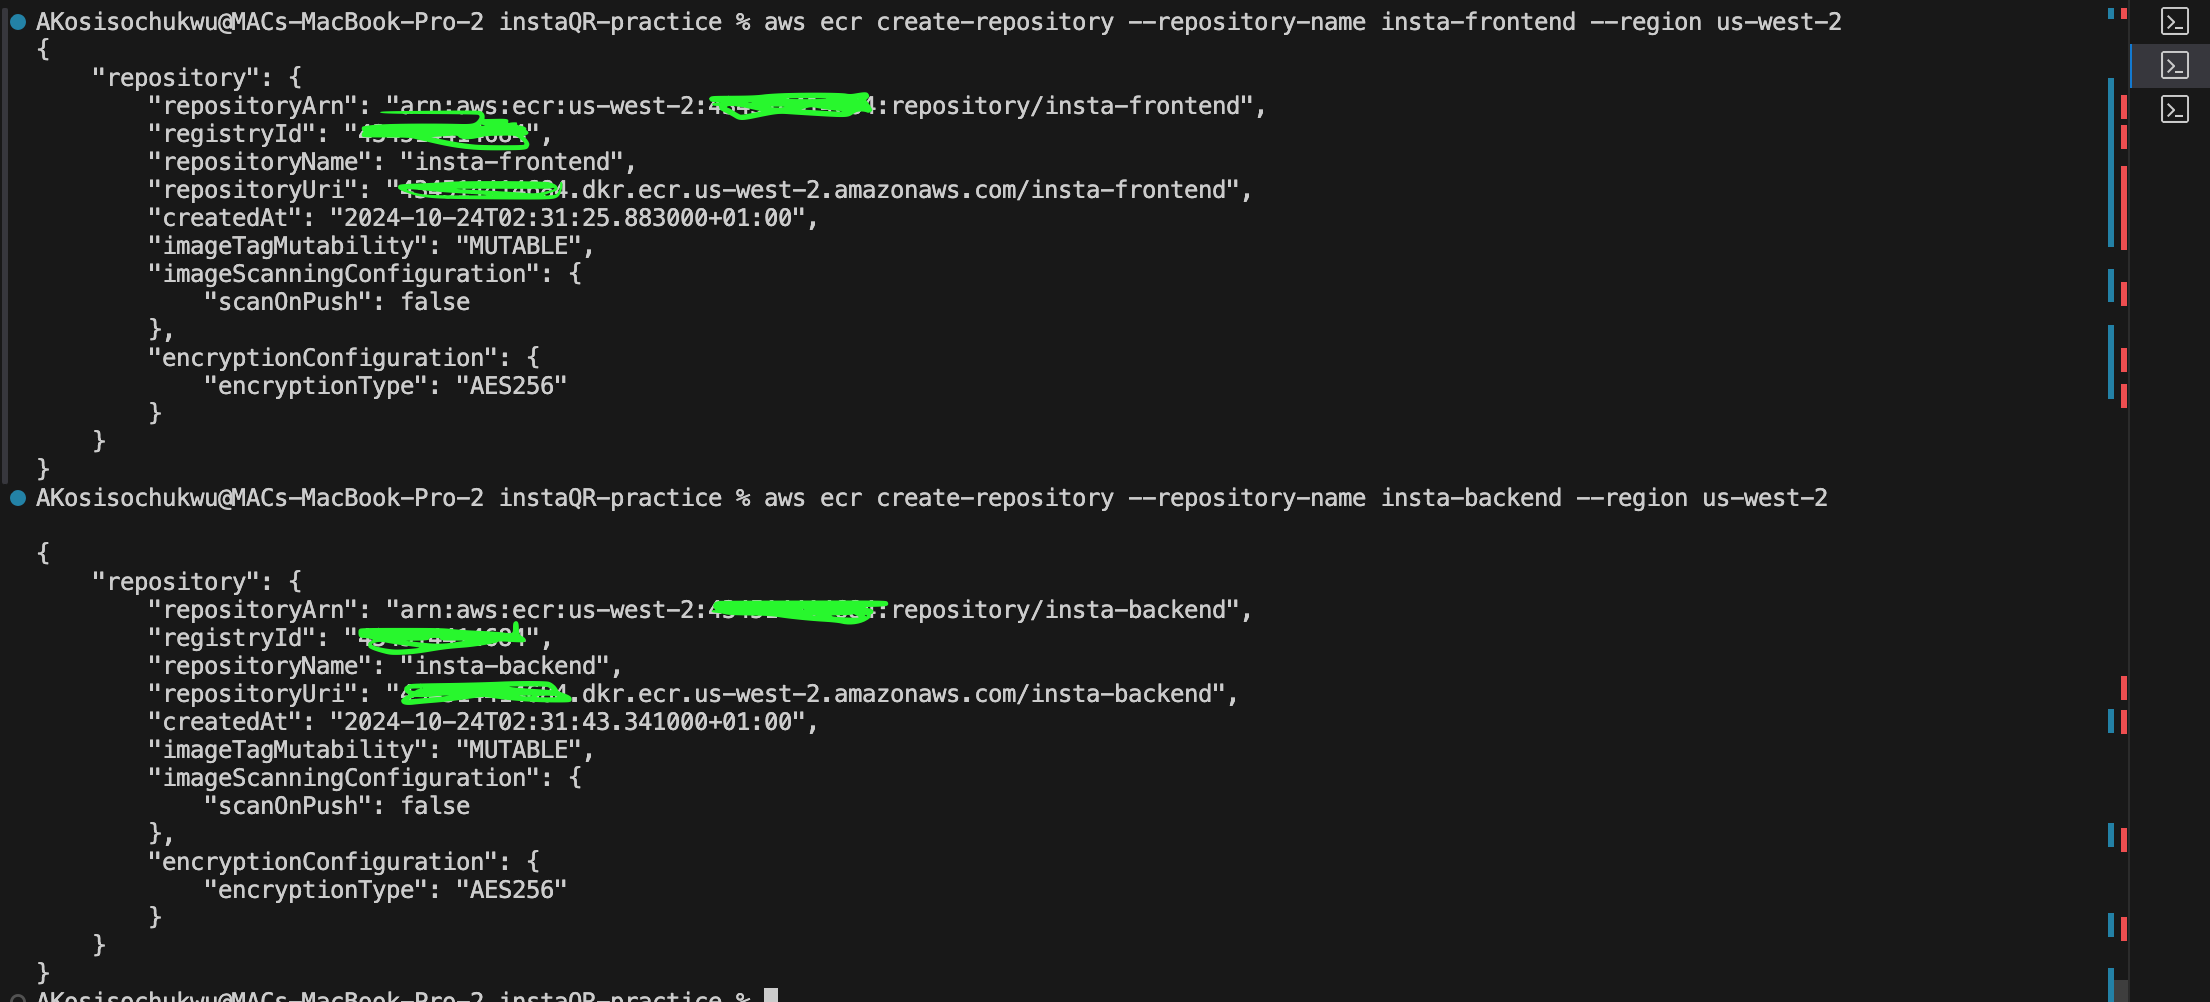
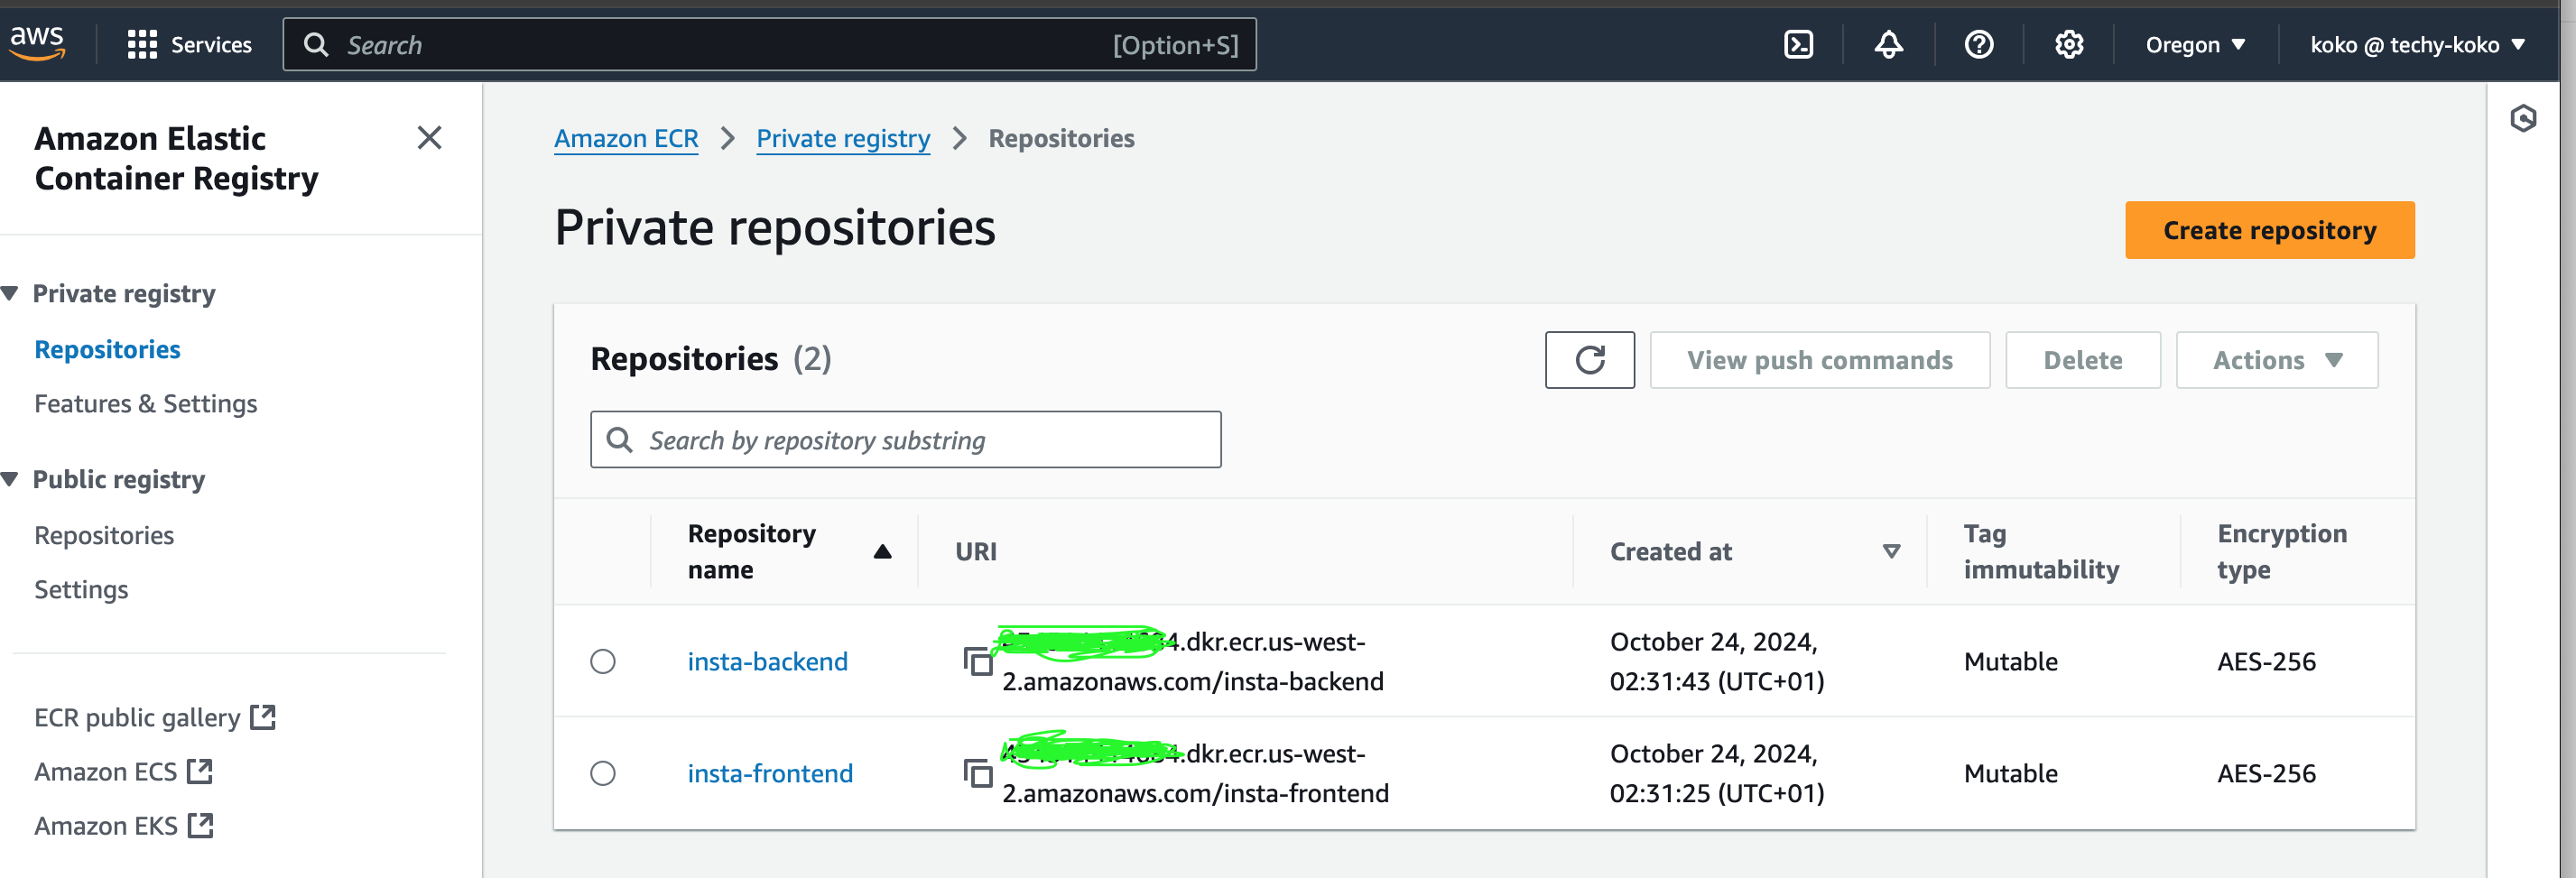
Navigate to the frontend and backend folders in your project individually, and execute the respective push commands for each repository.
This process will create Docker images based on the content in each folder using their respective Dockerfiles.
Create an Amazon EKS Cluster
an EKS cluster is the core environment where your Kubernetes workloads are orchestrated, consisting of both AWS-managed and user-managed components.
Inside the EKS cluster, you create deployments, pods, services, ingresses, config maps, etc., to manage and operate your application.
we need to install the “kubectl“ which is the official Kubernetes CLI for managing clusters, and “eksctl“ which is a CLI tool to manage EKS clusters.
Check out their official docs on how to install kubectl and eksctl.

Next up is to create an EKS Cluster with three worker nodes using the “eksctl“ command. replace the placeholder with the name of your cluster.
eksctl create cluster --name <name-of-cluster> --region us-west-2 --nodegroup-name standard-workers --node-type t3.medium --nodes 3 --nodes-min 1 --nodes-max 3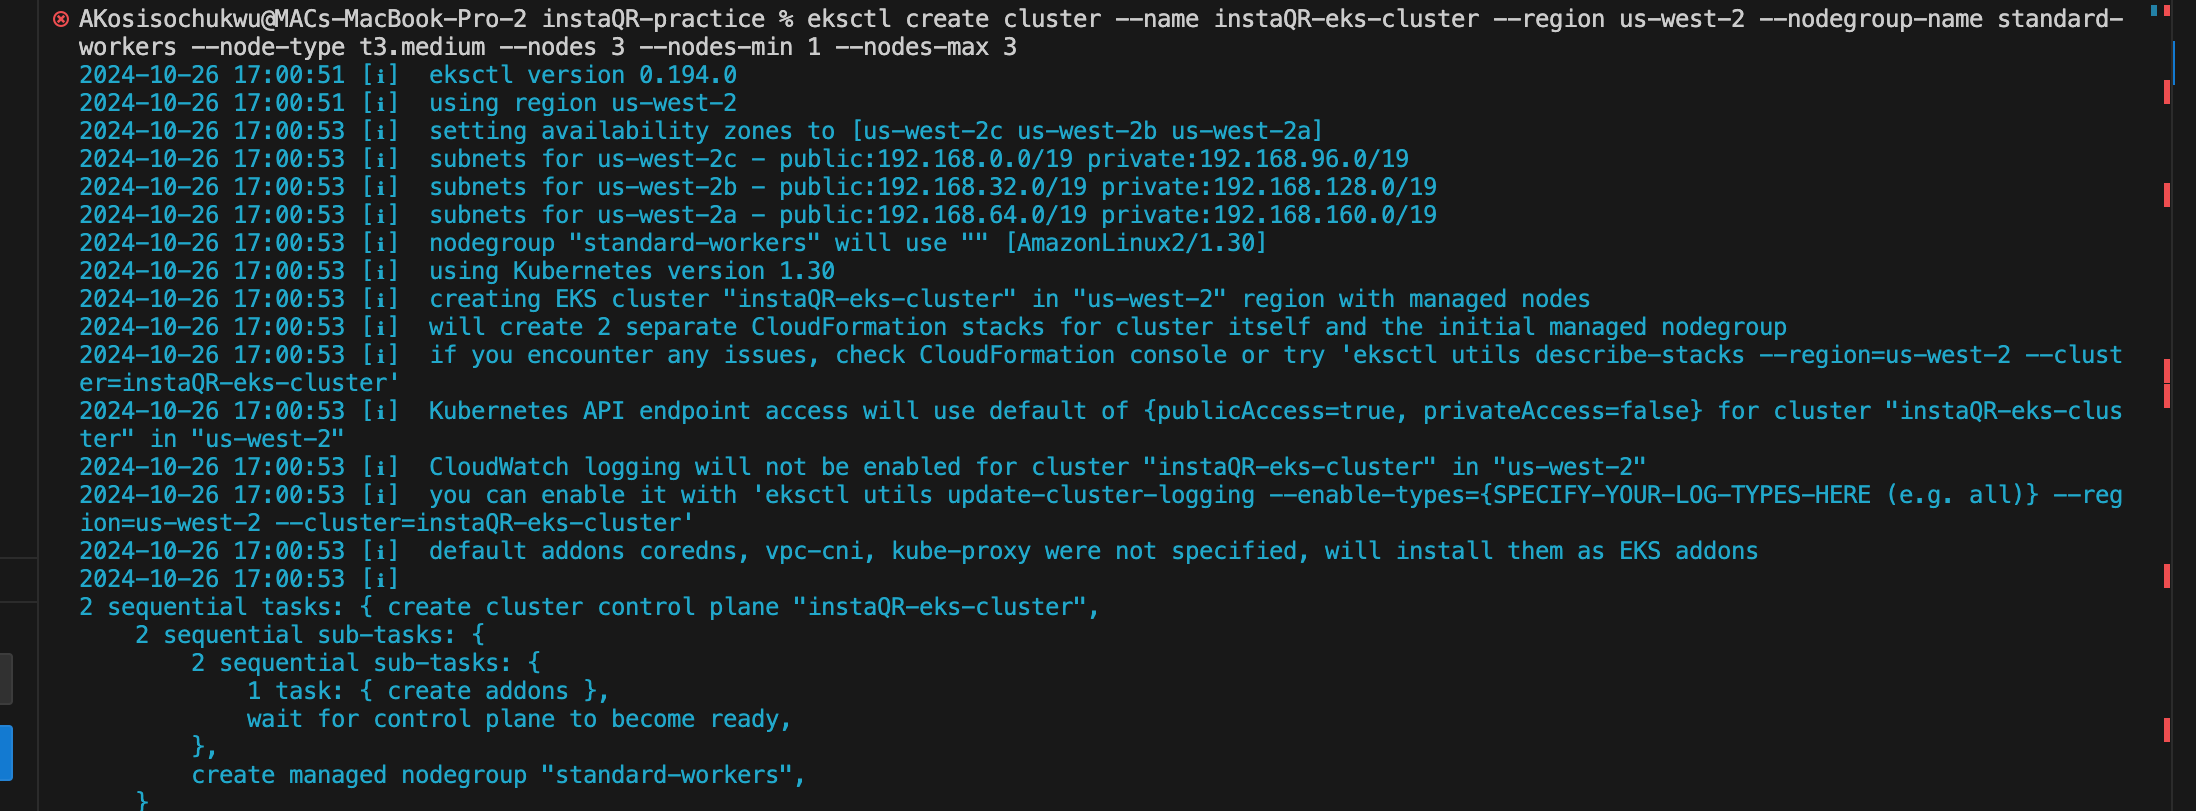

Update kubeconfig to Access the Cluster
aws eks update-kubeconfig --region <your-region> --name <name-of-cluster>
Create a Kubernetes Deployment and Service.
Similar to how docker-compose is used in the local environment to deploy multiple containers, the same way a Kubernetes deployment file will be used in the production environment to deploy containers running on one or more pods.
The “backend-config.yml“ and “frontend-config.yml” files contain the deployment and service configuration for the backend and frontend respectively.
Replace your container image placeholder with the link to the image pushed to ECR
  eg.
  image: "446789115766.dkr.ecr.us-west-2.amazonaws.com/insta-backend:latest"
Both your service and deployment configuration should have similar labels.
We are running our backend pods in an internal ClusterIP because we don’t want it to be exposed to the public. While the front end will be exposed by a load balancer to make it publicly accessible.
Then run this command to apply the changes made to the configuration.
  kubectl apply -f backend-config.yml
  kubectl apply -f frontend-config.yml
inspect the created pods and services.

Using the generated Load balancer’s external IP address, we can access our application in the browser
  eg.
  http://ad94b63da9570453aa0a2a203059f89e-1545420864.us-west-2.elb.amazonaws.com/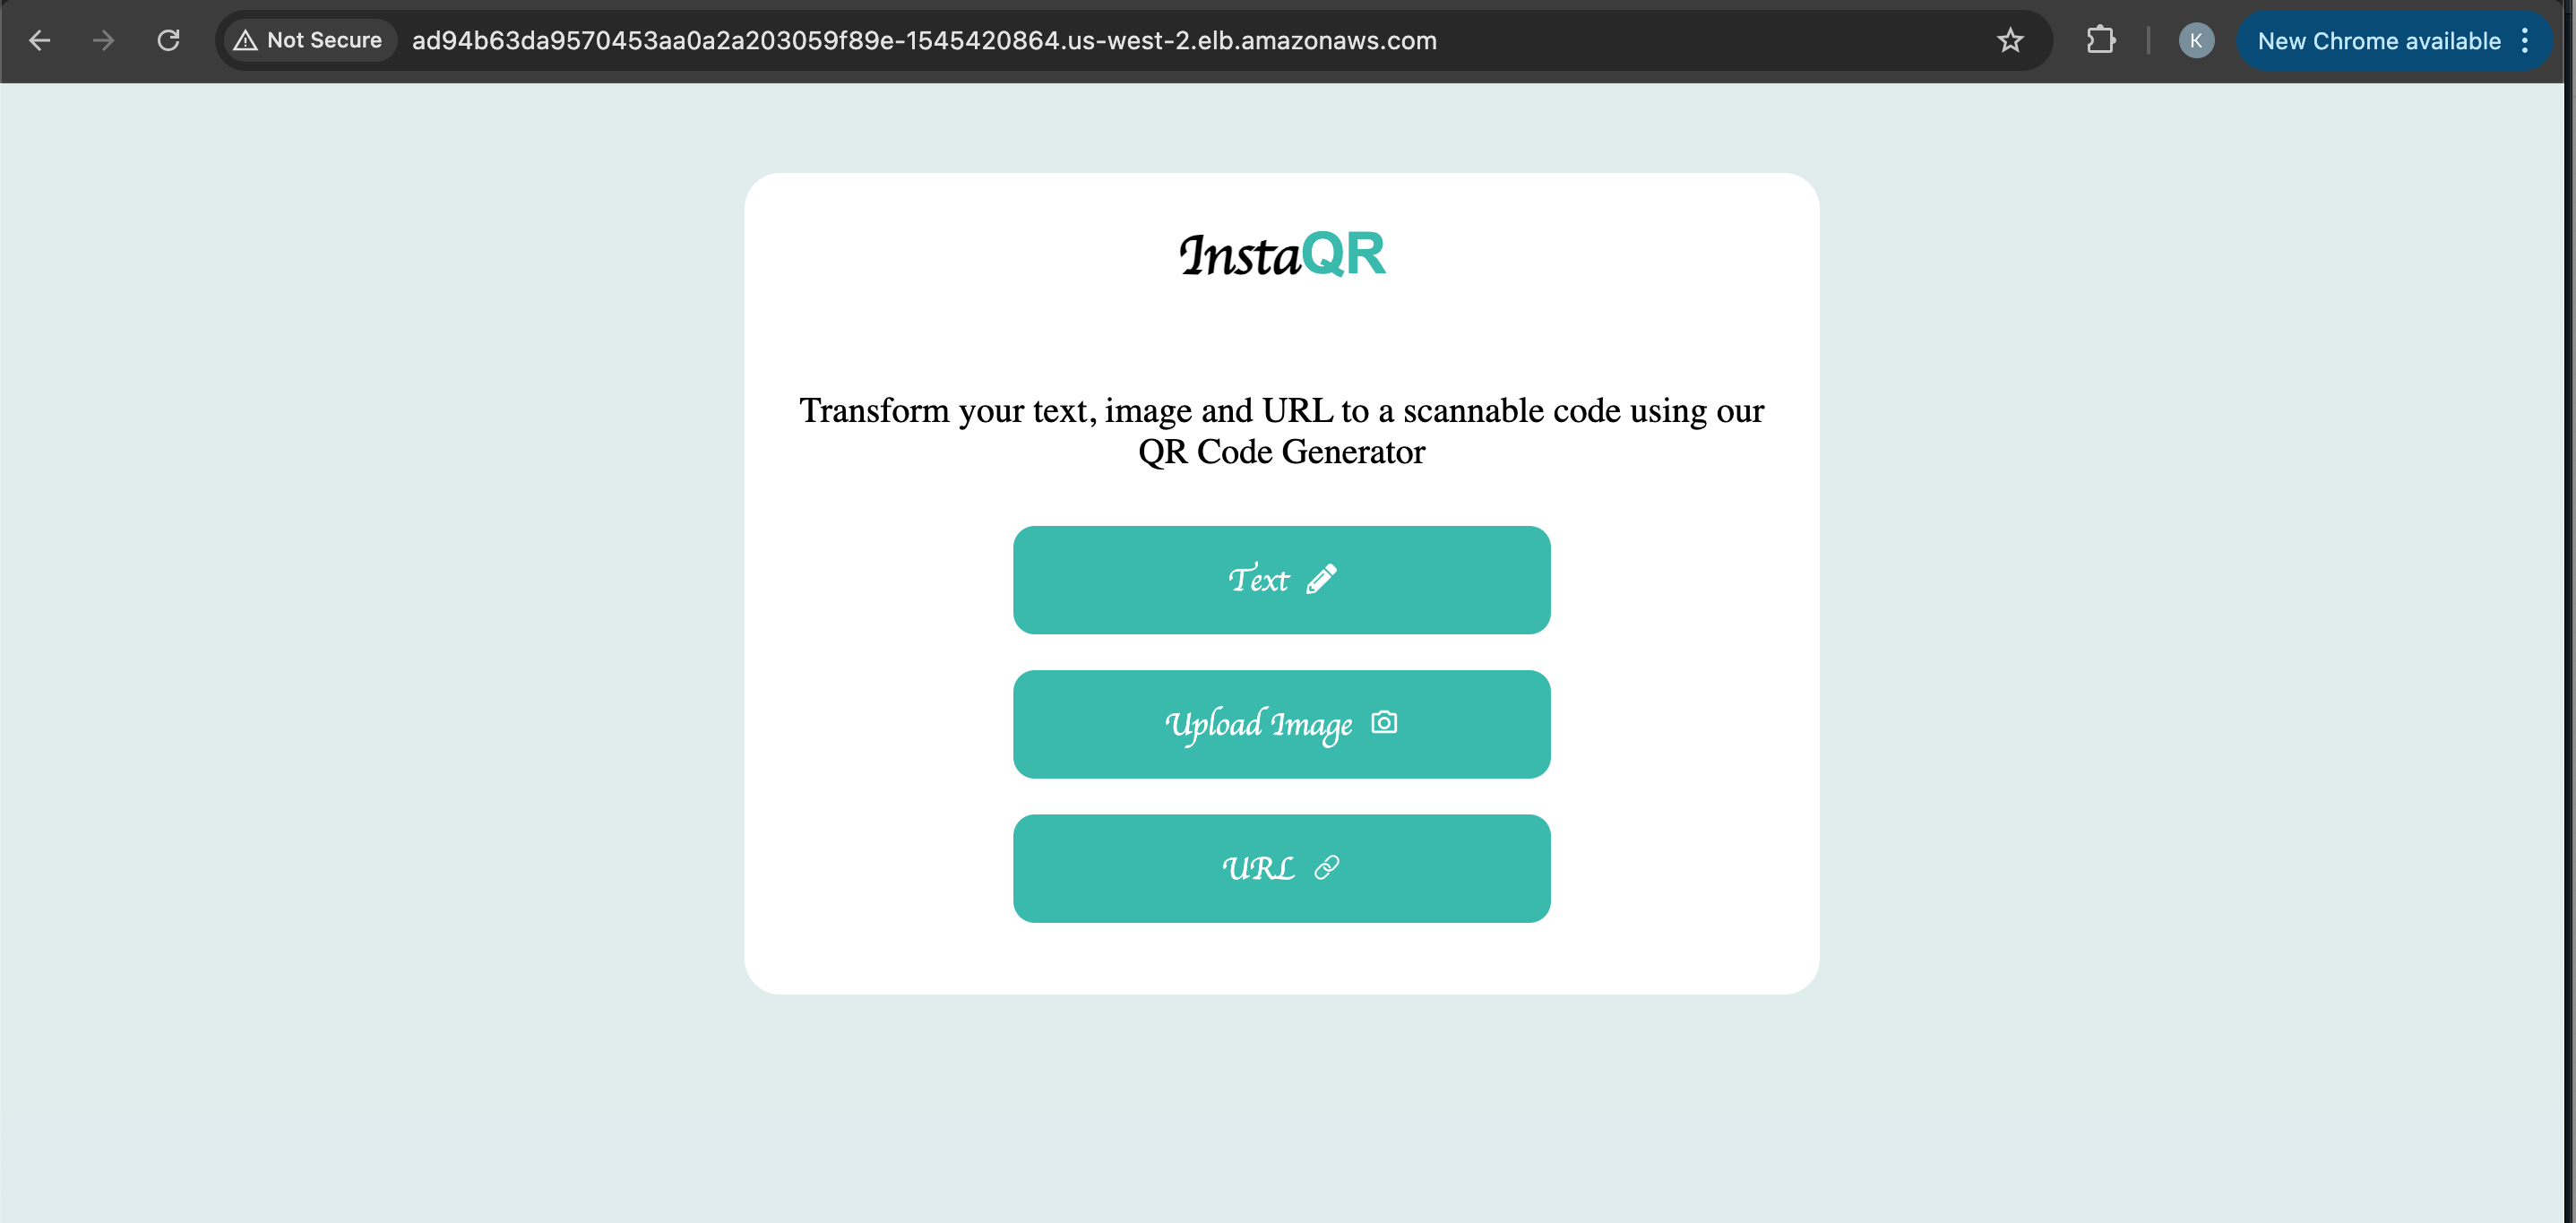
At this point, our backend cannot communicate with the frontend running in the browser which is outside the Cluster. There are other options available to establish a connection between the two pods but we will be using the Reverse Proxy approach here.
Reverse Proxy in NextJS
To enable communication between the two pods, and because our frontend uses NextJS, we will be utilizing the reverse proxy in NextJS to forward requests from the frontend service to the backend.
You can find the configuration in the “frontend/next.config.js“ file. replace the placeholder with the name of your backend service.
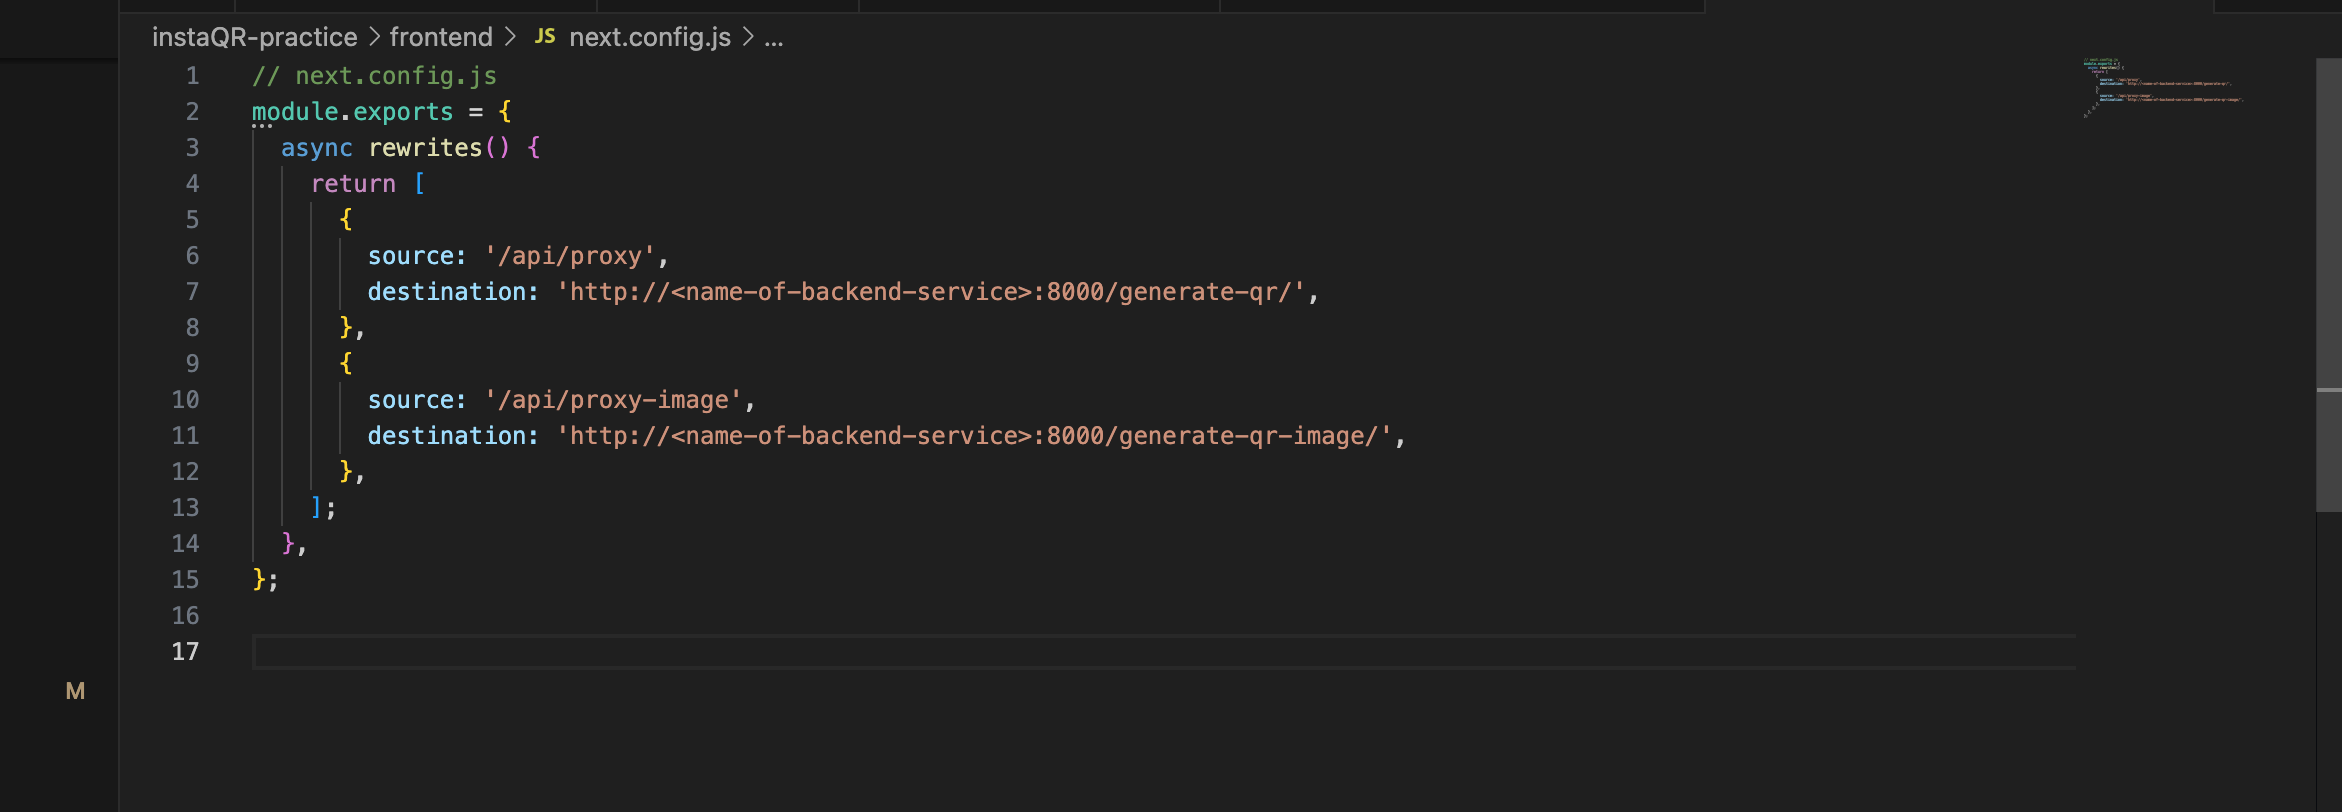
Update the Frontend Code to use the proxy and rebuild your docker image using the push commands to have the latest changes updated to your container image repository.
  eg.
  change from this
   const response = await fetch('http://localhost:8000/generate-qr-image/',

  to this
    const response = await fetch('/api/proxy-image',
update the permissions of the IAM role used by the EKS nodes to allow the “s3:PutObject“ action.
  {
      "Version": "2012-10-17",
      "Statement": [
          {
              "Effect": "Allow",
              "Action": "s3:PutObject",
              "Resource": "arn:aws:s3:::qr-codes-generator/*"
          }
      ]
  }
Also, ensure that the bucket policy allows access.
  {
    "Version": "2012-10-17",
    "Statement": [
      {
        "Effect": "Allow",
        "Principal": {
          "AWS": "arn:aws:iam::<AWS_ACCOUNT_ID>:role/eksctl-instaQR-eks-cluster-nodegro-NodeInstanceRole-I0cyWLXl1M91"
        },
        "Action": "s3:PutObject",
        "Resource": "arn:aws:s3:::qr-codes-generator/*"
      }
    ]
  }
restart the Kubernetes deployment to pick up the latest changes.

Now we can try running our application again by refreshing the browser and our application works as expected now.
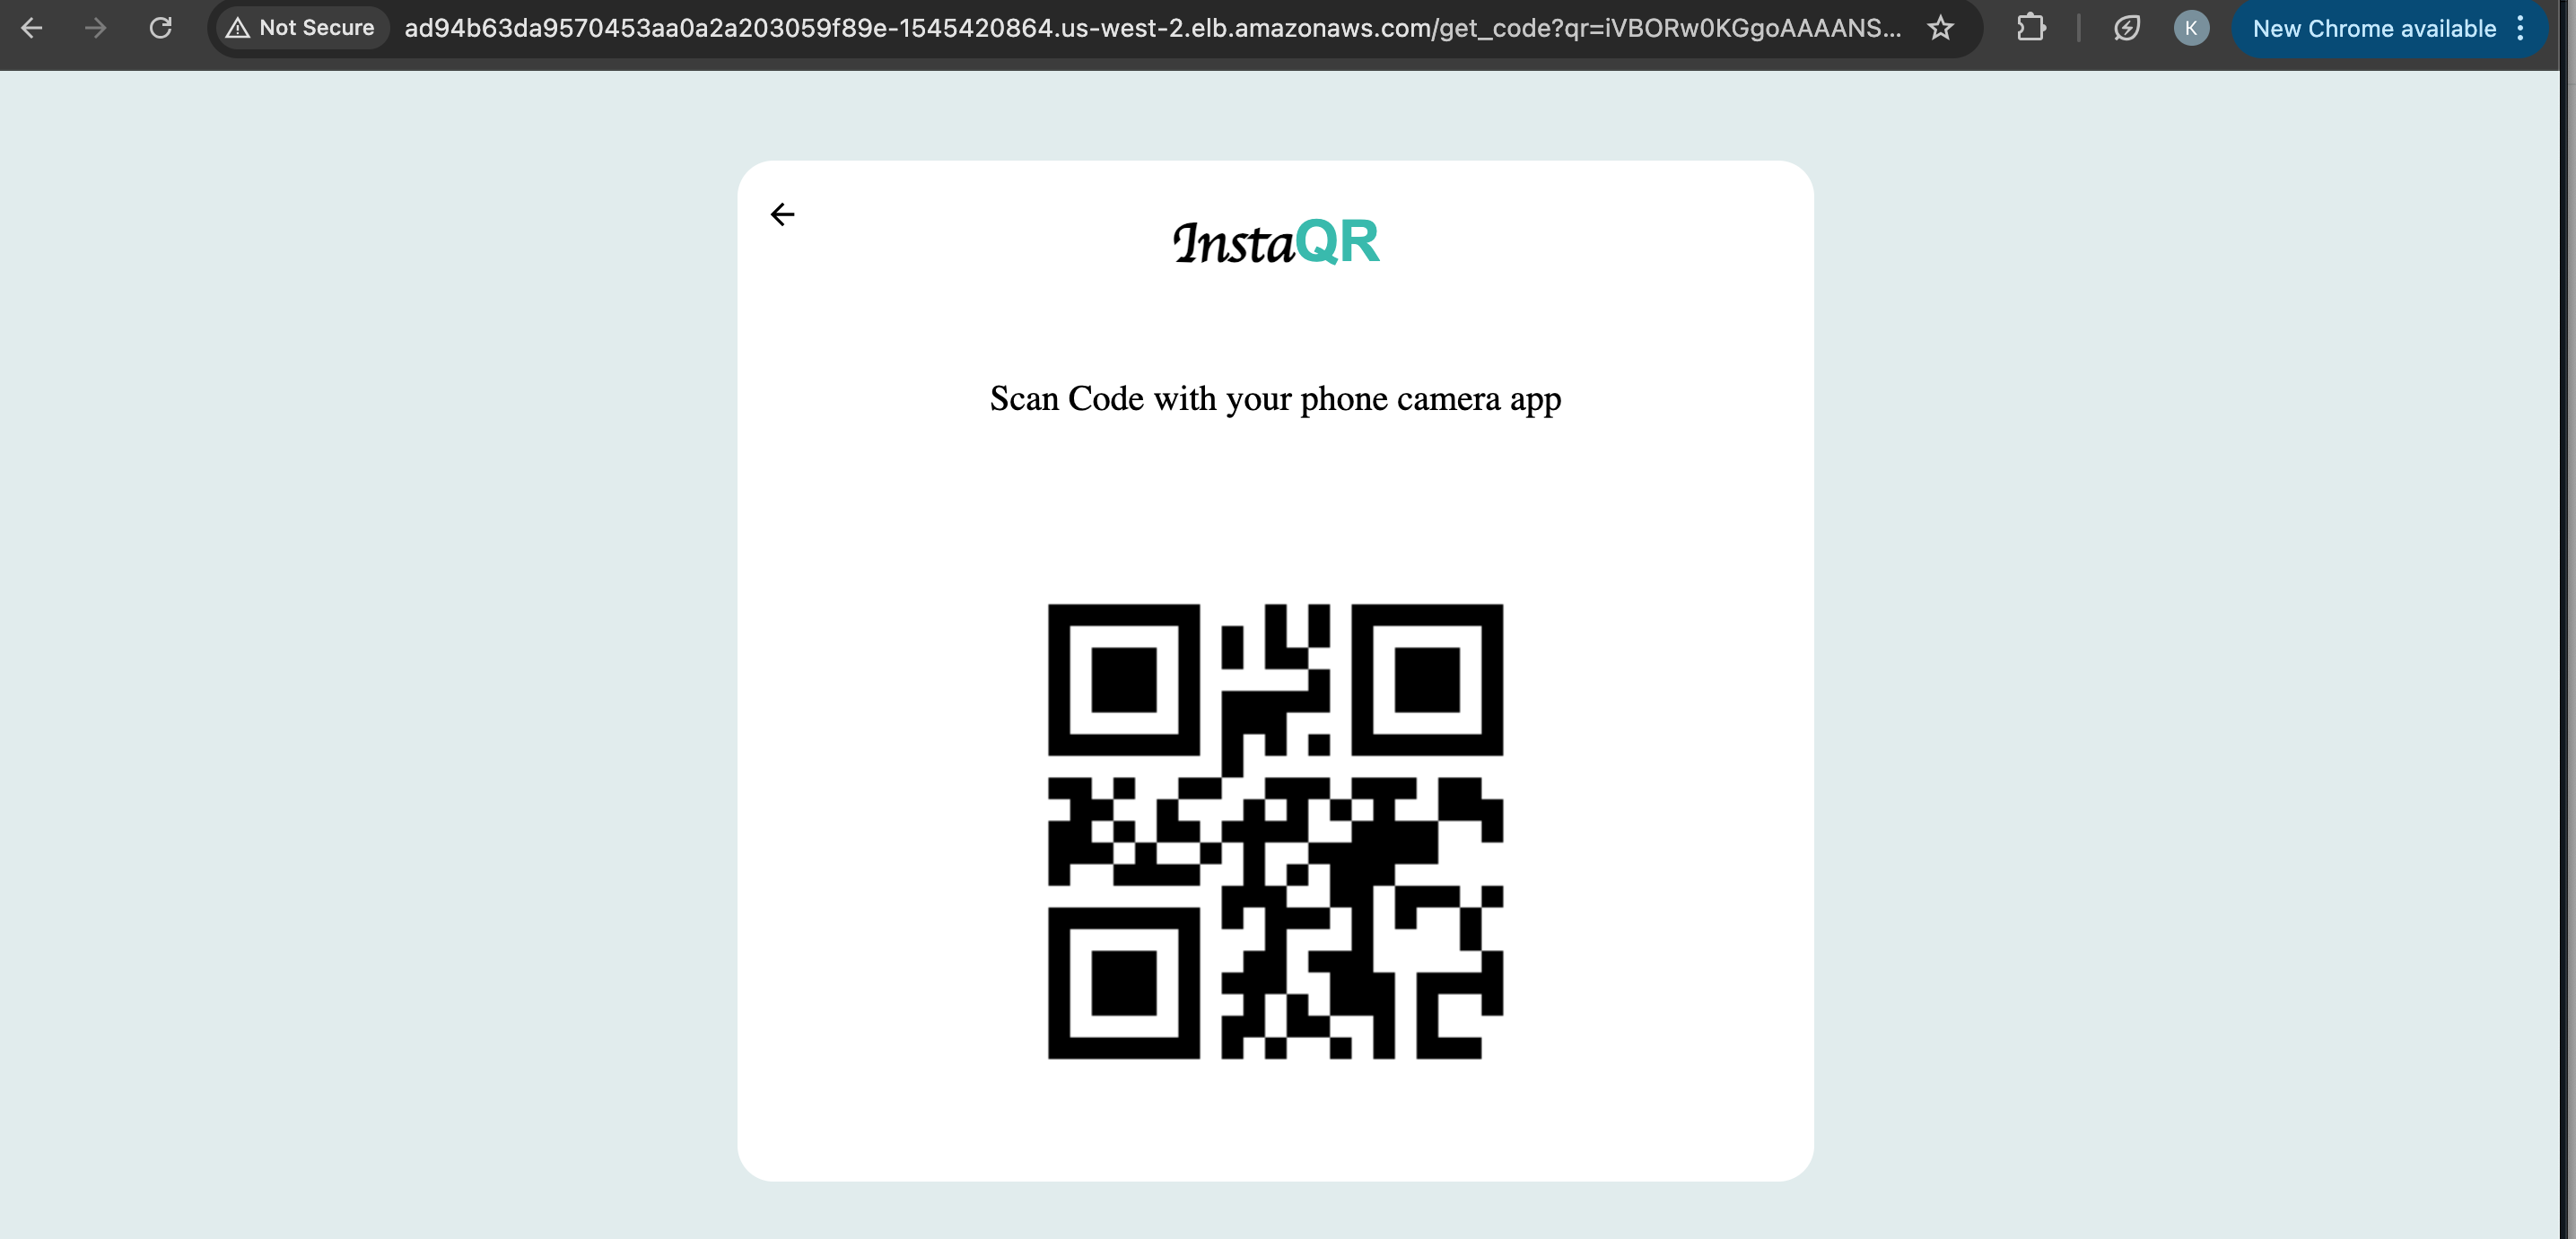
Next up is to monitor the state of our application using Prometheus and Grafana.
Monitor our application with Prometheus and Grafana.
Prometheus:
it is an automated monitoring and alerting tool designed to monitor highly dynamic environments, particularly containerized applications. Prometheus monitors different components in your infrastructure, which are collectively referred to as Targets.
A target could be a server, an application, a database, or any other system component. For each target, there are different UNITS (eg. CPU status, request counts, memory stage, etc.). The specified units you want to be monitored are called METRICS.
Grafana:
it is an open-source analytics and monitoring platform used to visualize and analyze metrics collected from various data sources like Prometheus, Elasticsearch, MySQL, and others. It provides dashboards that allow users to explore their data, create alerts, and monitor the health and performance of their systems in real time.
Now we will work through how to integrate both into our application.
install Helm and Add the Prometheus Community Helm Chart Repository by running the following commands.
 - curl https://raw.githubusercontent.com/helm/helm/master/scripts/get-helm-3 | bash
 - helm repo add prometheus-community https://prometheus-community.github.io/helm-charts
 - helm repo add grafana https://grafana.github.io/helm-charts
 - helm repo update
Next is to install the Prometheus Operator and Grafana using Helm Chart.
helm install prometheus prometheus-community/kube-prometheus-stack
Run this command to view all running pods, services, etc running inside your cluster.
kubectl get all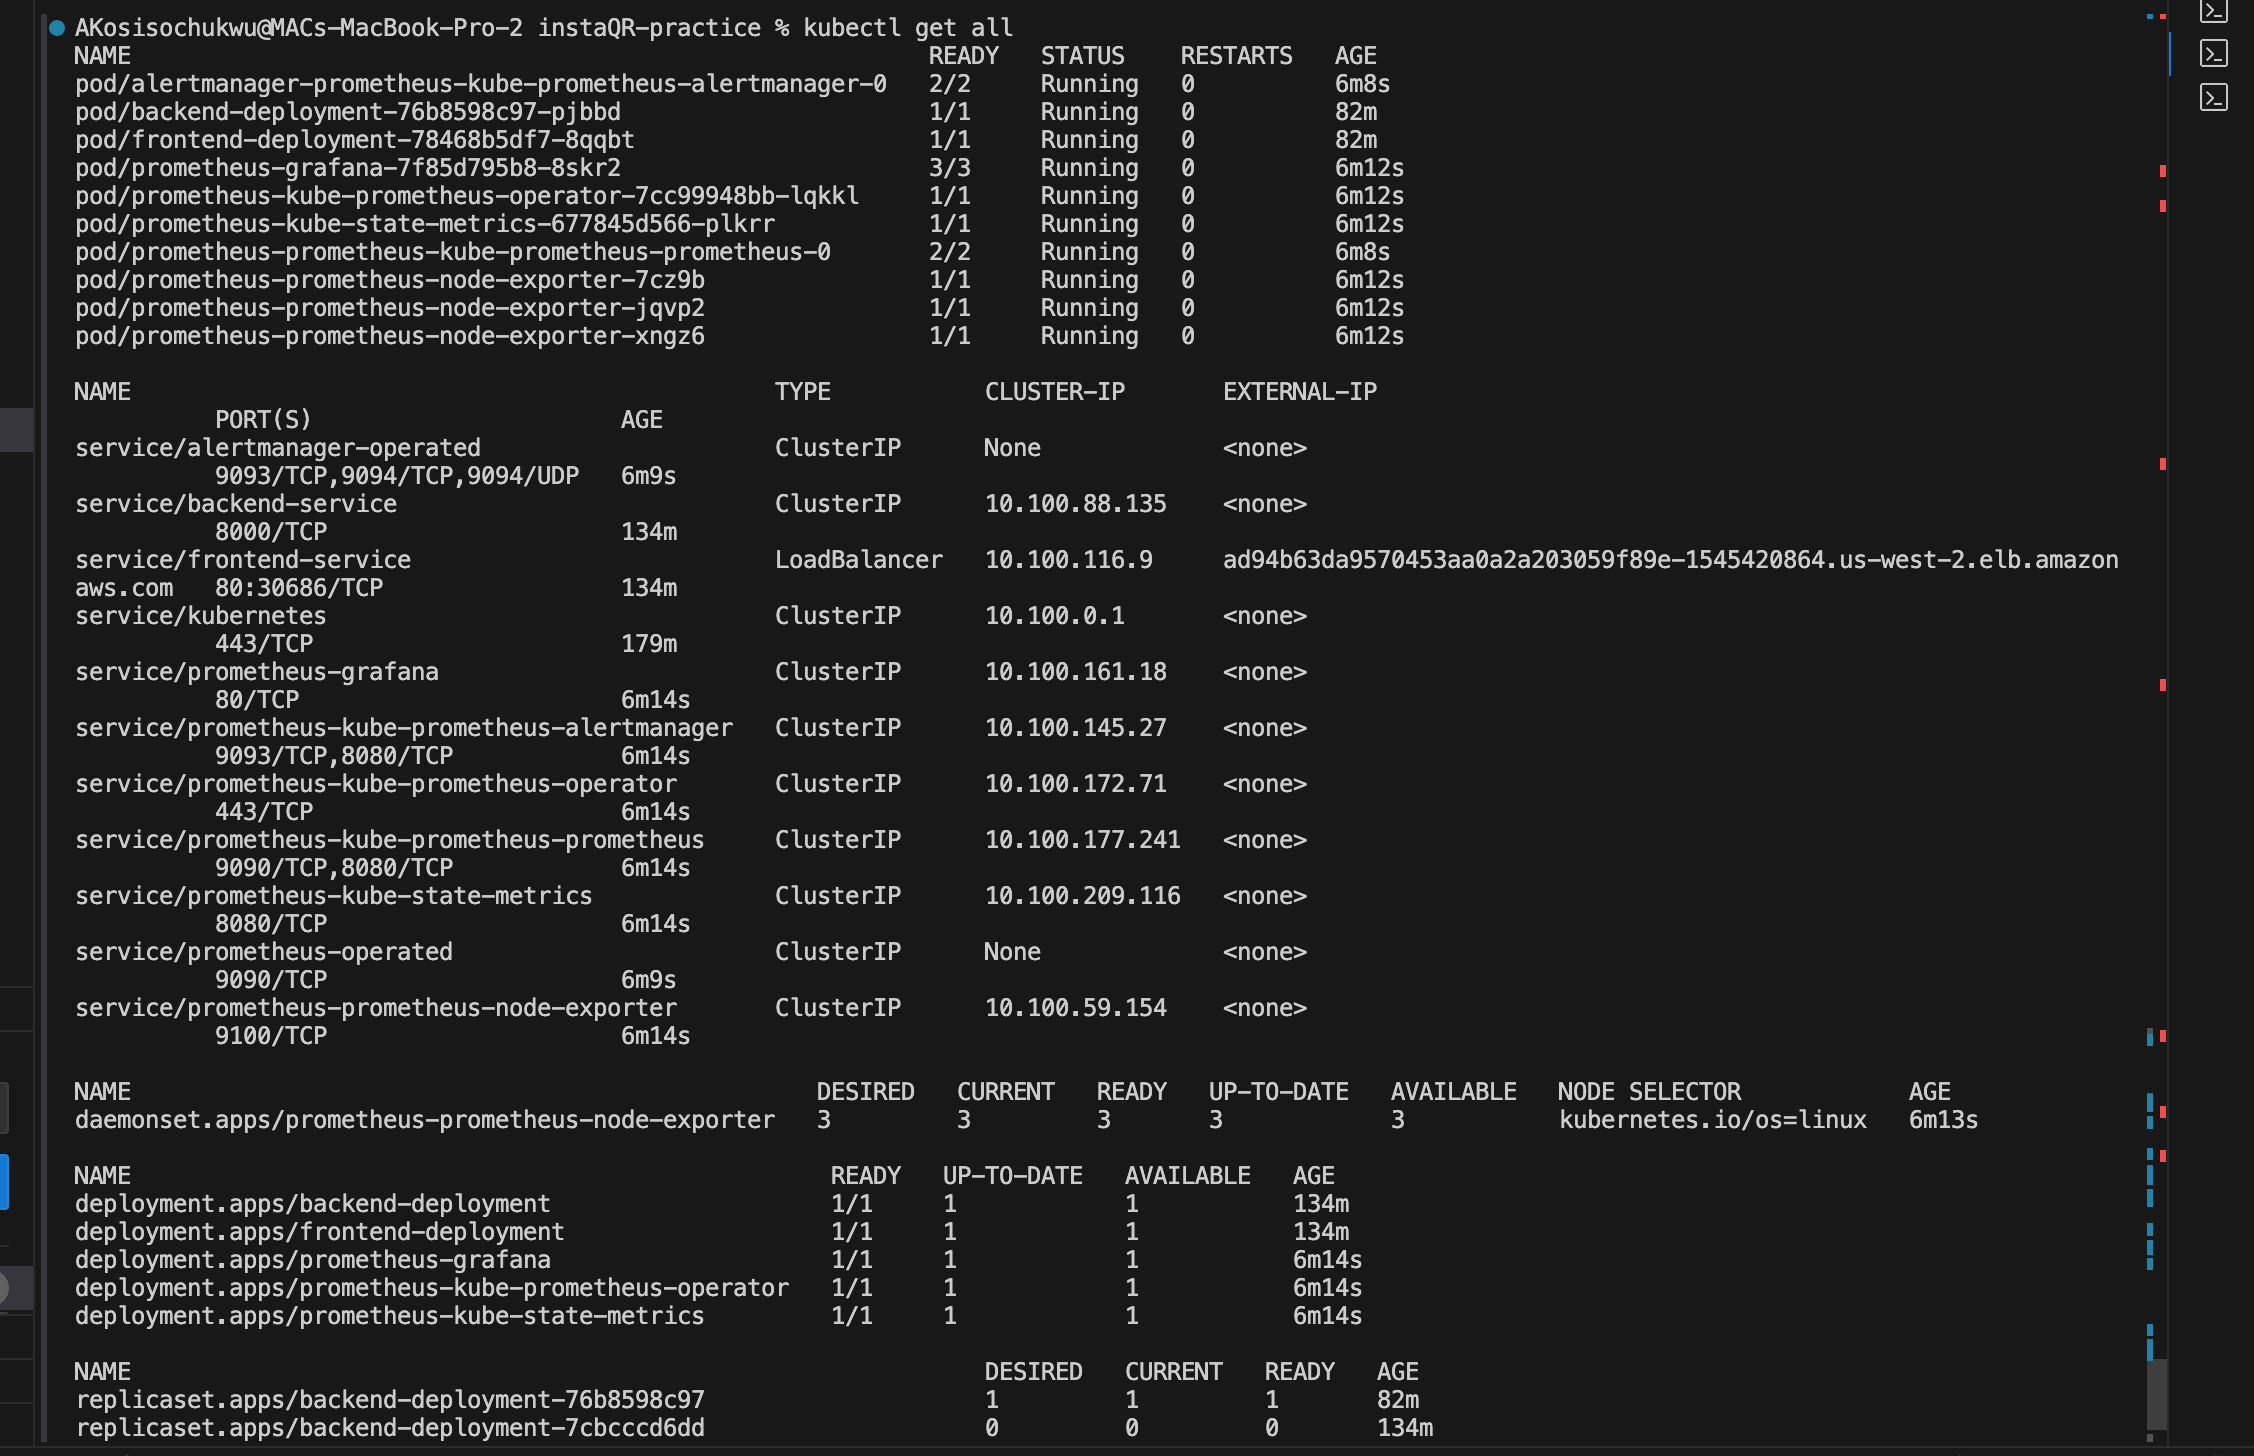
Expose Prometheus and Grafana
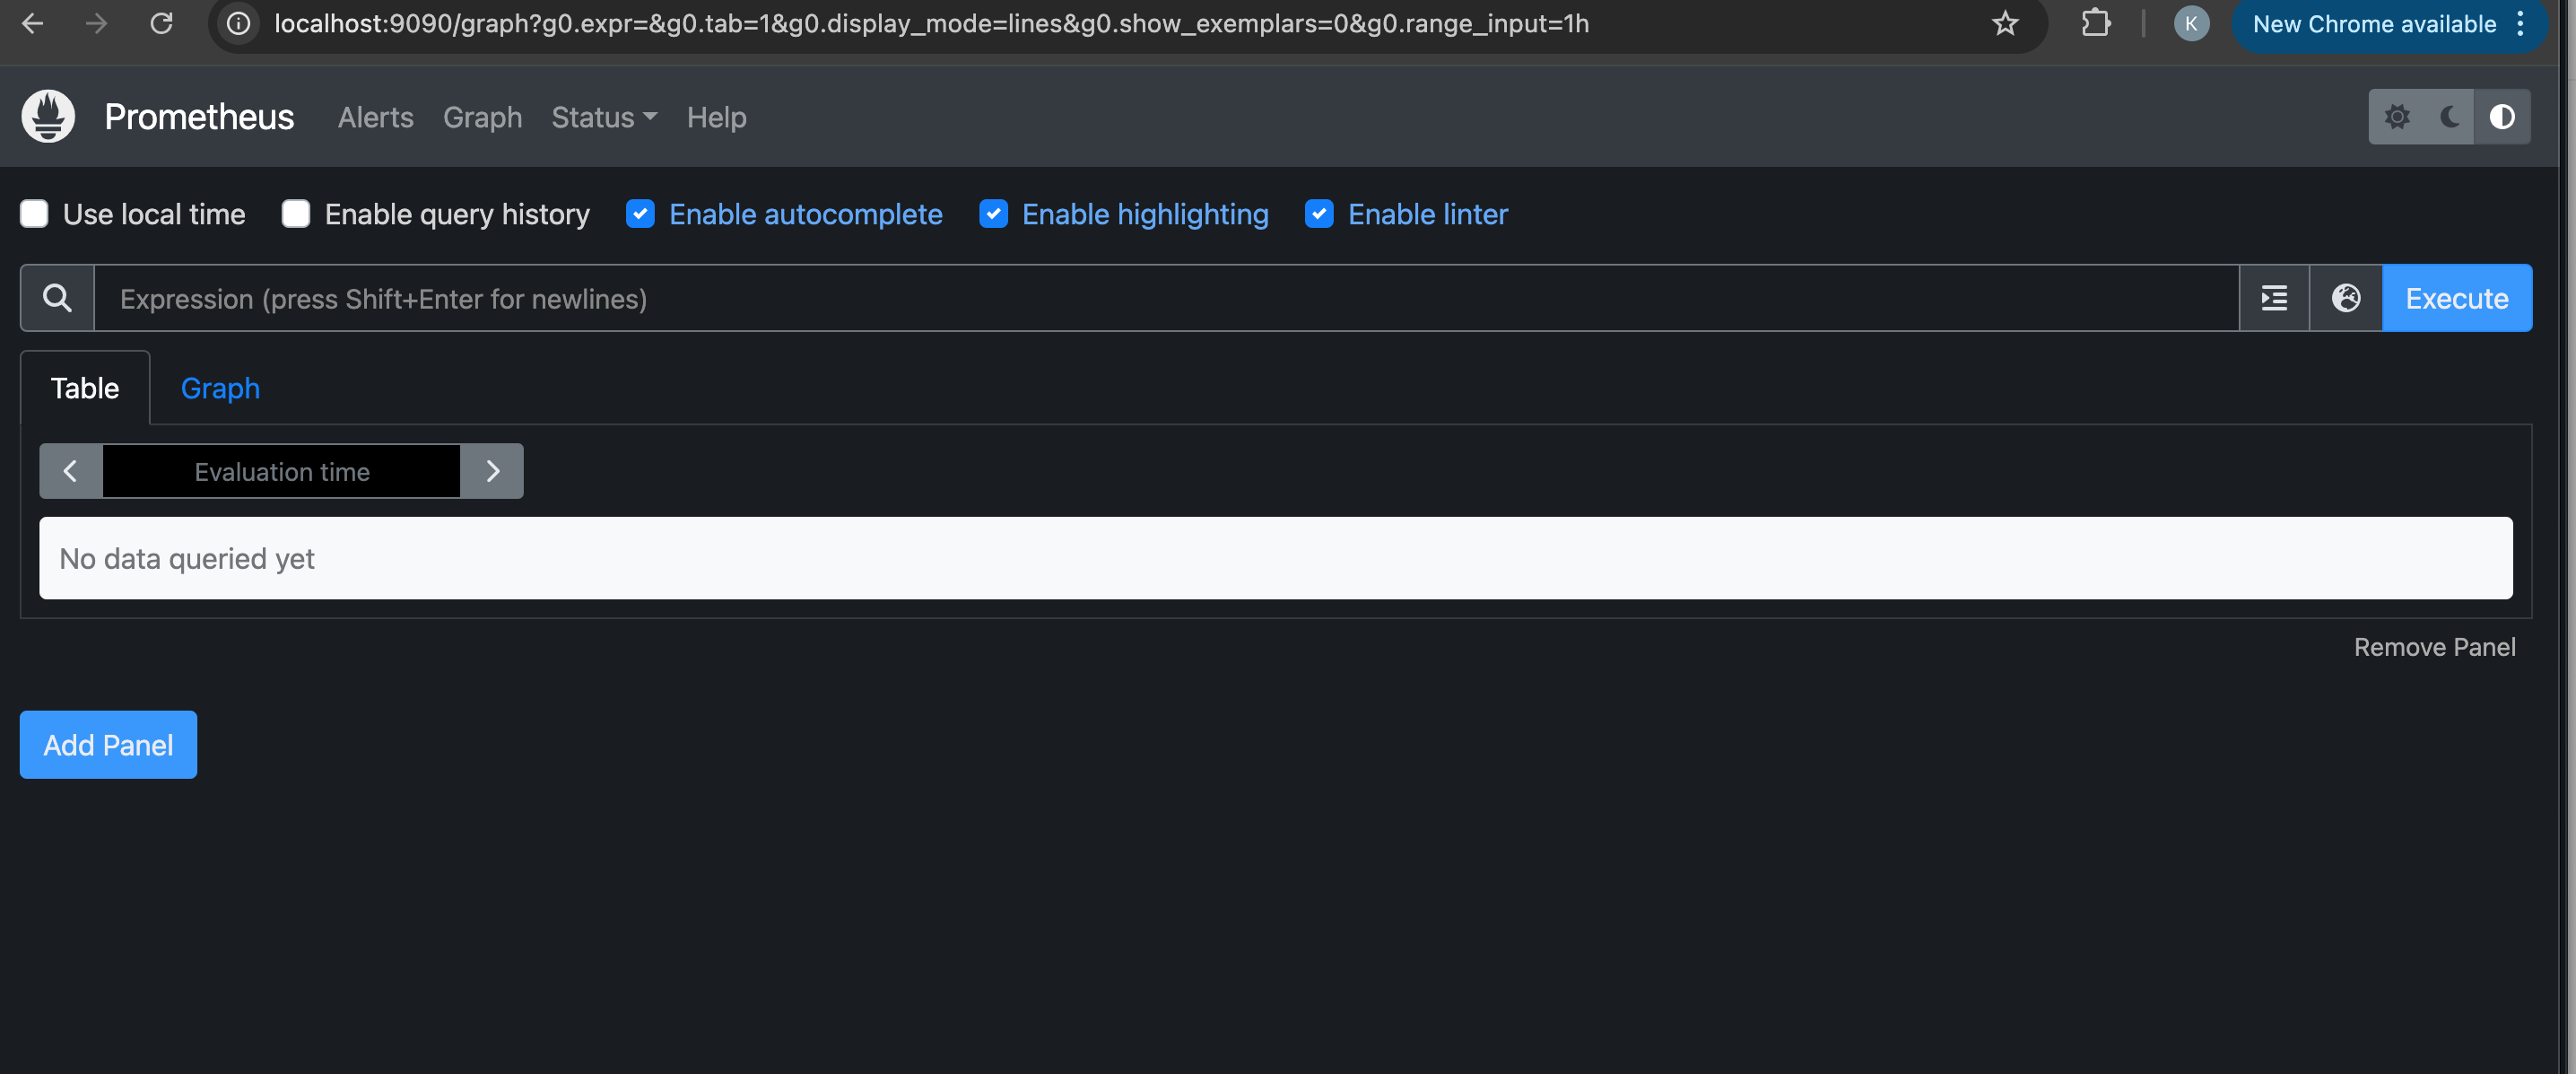
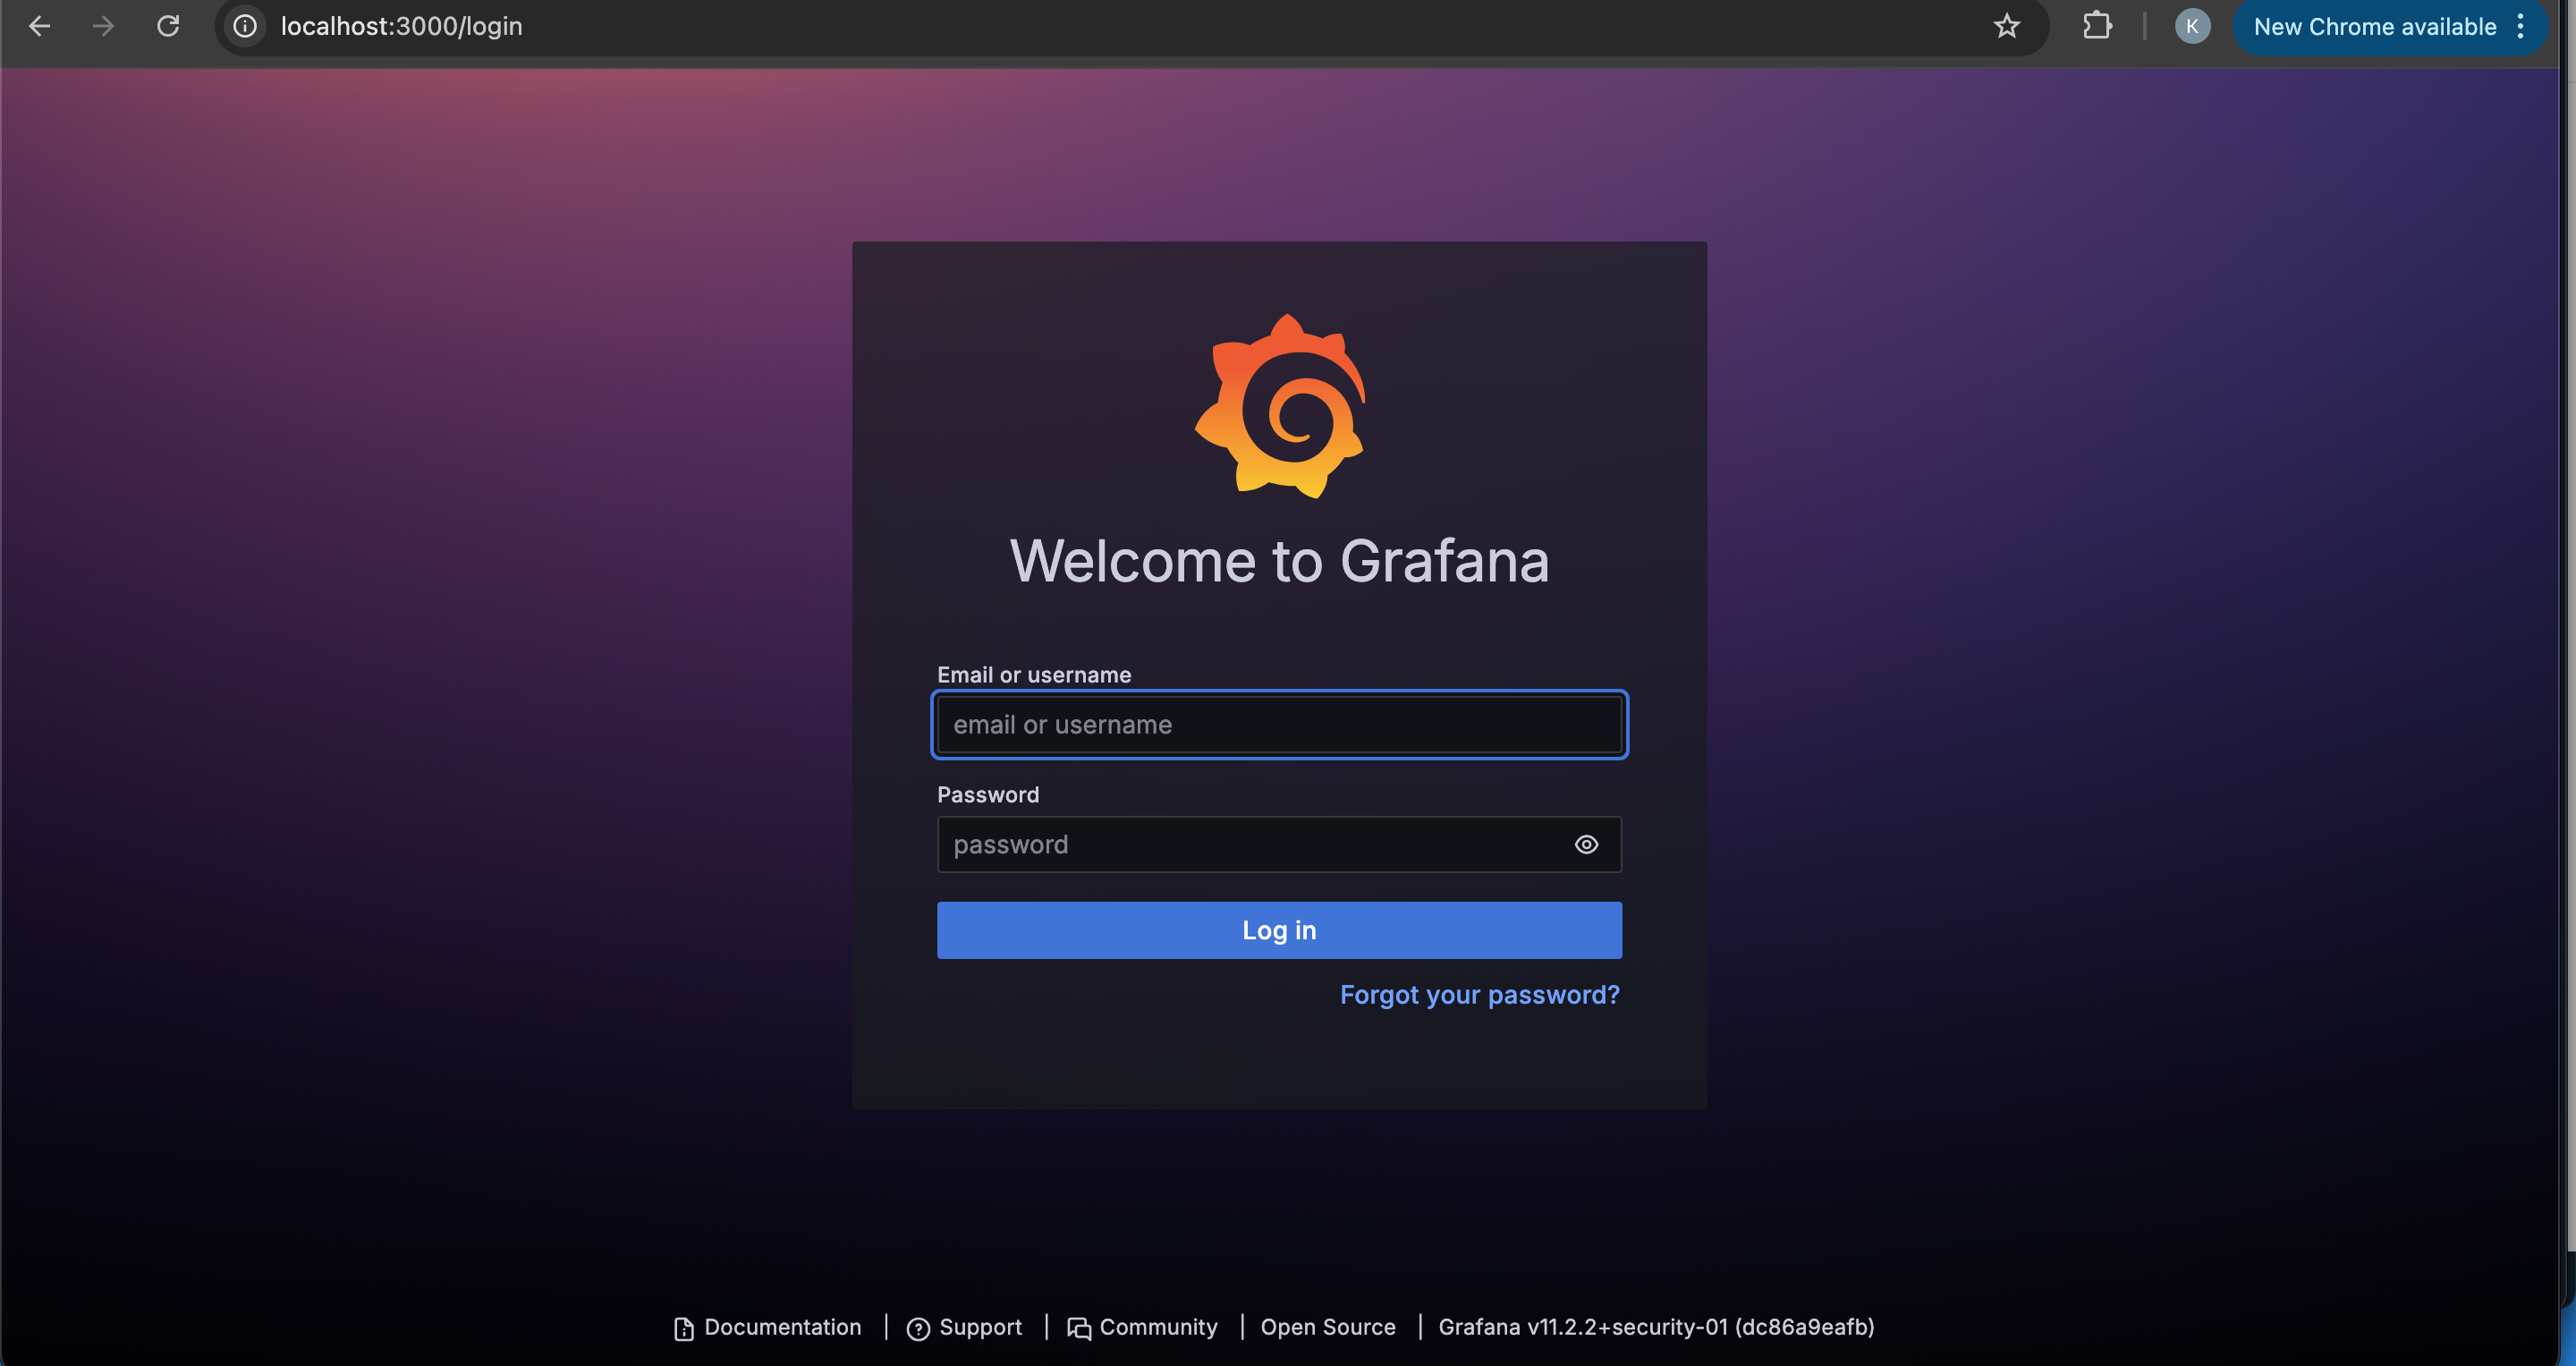
We can either port-forward for development use or a load balancer for Production use. but for this article, we will be port-forwarding# Prometheus kubectl port-forward svc/prometheus-kube-prometheus-prometheus 9090 # Grafana kubectl port-forward svc/prometheus-grafana 3000:80Open Prometheus at port 9090 (http://localhost:9090) and Grafana at port (http://localhost:3000) and login to the Grafana dashboard using the username “admin“ and password “prom-operator“. You can change the credentials for security purposes.
Configure Prometheus to Scrape Your Application Metrics.
Since the backend exposes metrics via FastAPI, we’ll need to create a custom Kubernetes component called ServiceMonitor to scrape those metrics and display them on the Prometheus dashboard.
You can find the ServiceMonitor Configuration file in the project inside the “service_monitor.yml“ file.
One of the important label in the ServiceMonitor is the “release-prometheus“
it allows prometheus to find the servicemonitor in the cluster and register them to start scraping the endpoints the servicemonitor points to.
Apply the ServiceMonitor updates and restart deployments.

Next is to install and import an exporter “prometheus-fastapi-instrumentator“ which can be found in the “/backend/main.py” file.
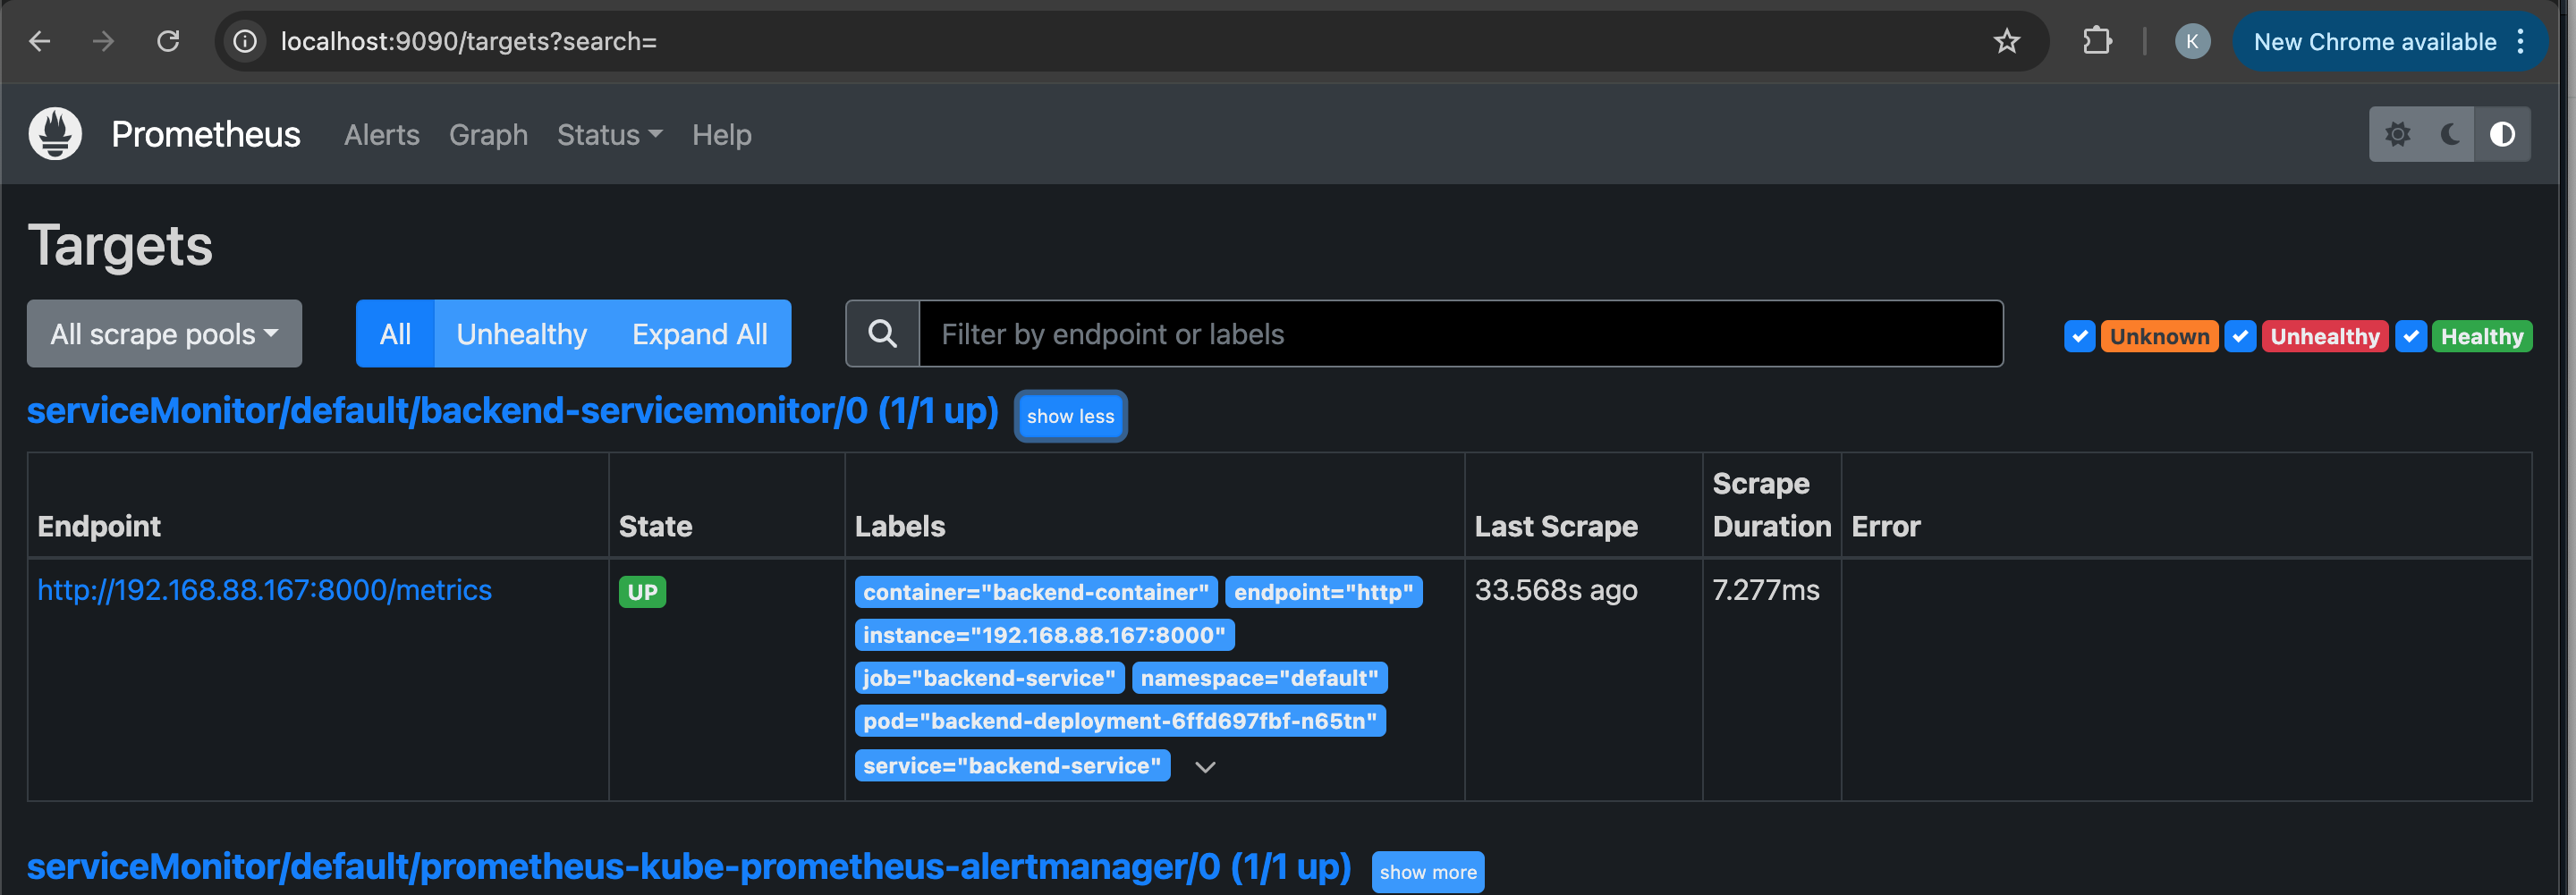
Now we can see our target showing with a status of “UP“ on the Prometheus dashboard. this means our Prometheus is successfully scraping the backend metrics.
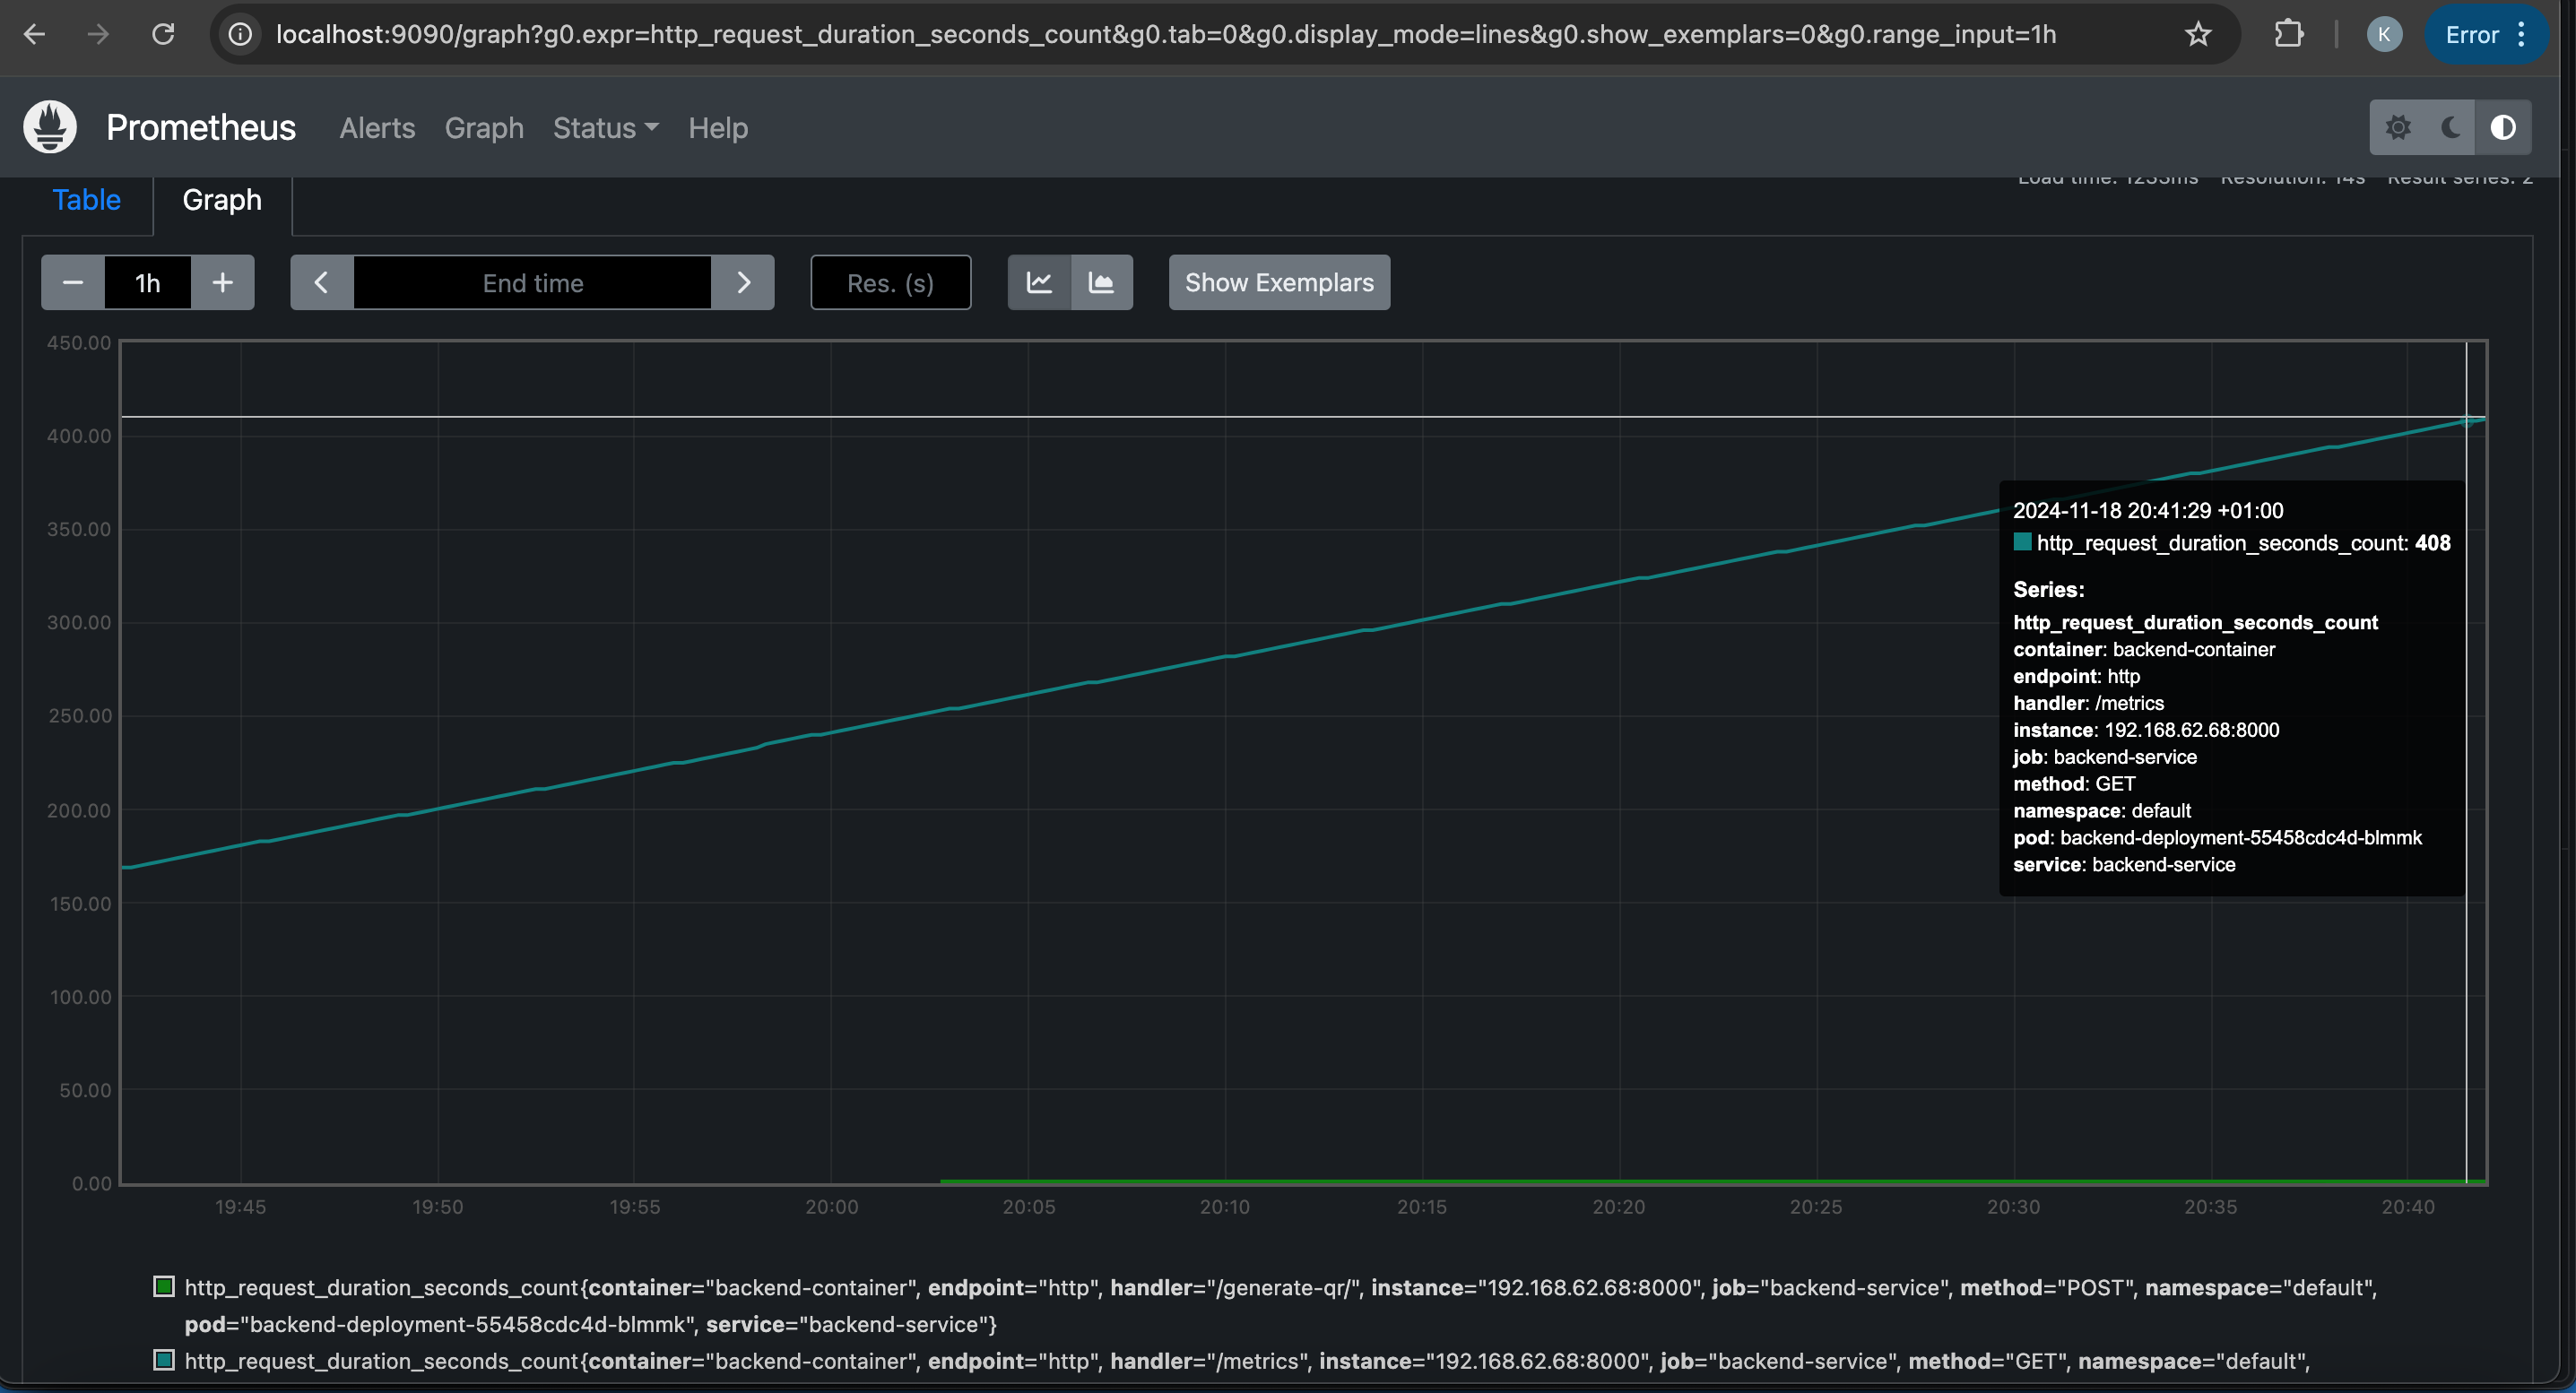
We can also query different metrics using the Prometheus UI.
Go to the Graph tab and query this metric “http_request_duration_seconds_count“. you can either view it in a table format or a graph format.
Next up is to Add Prometheus as a Data Source in Grafana for better visualization.
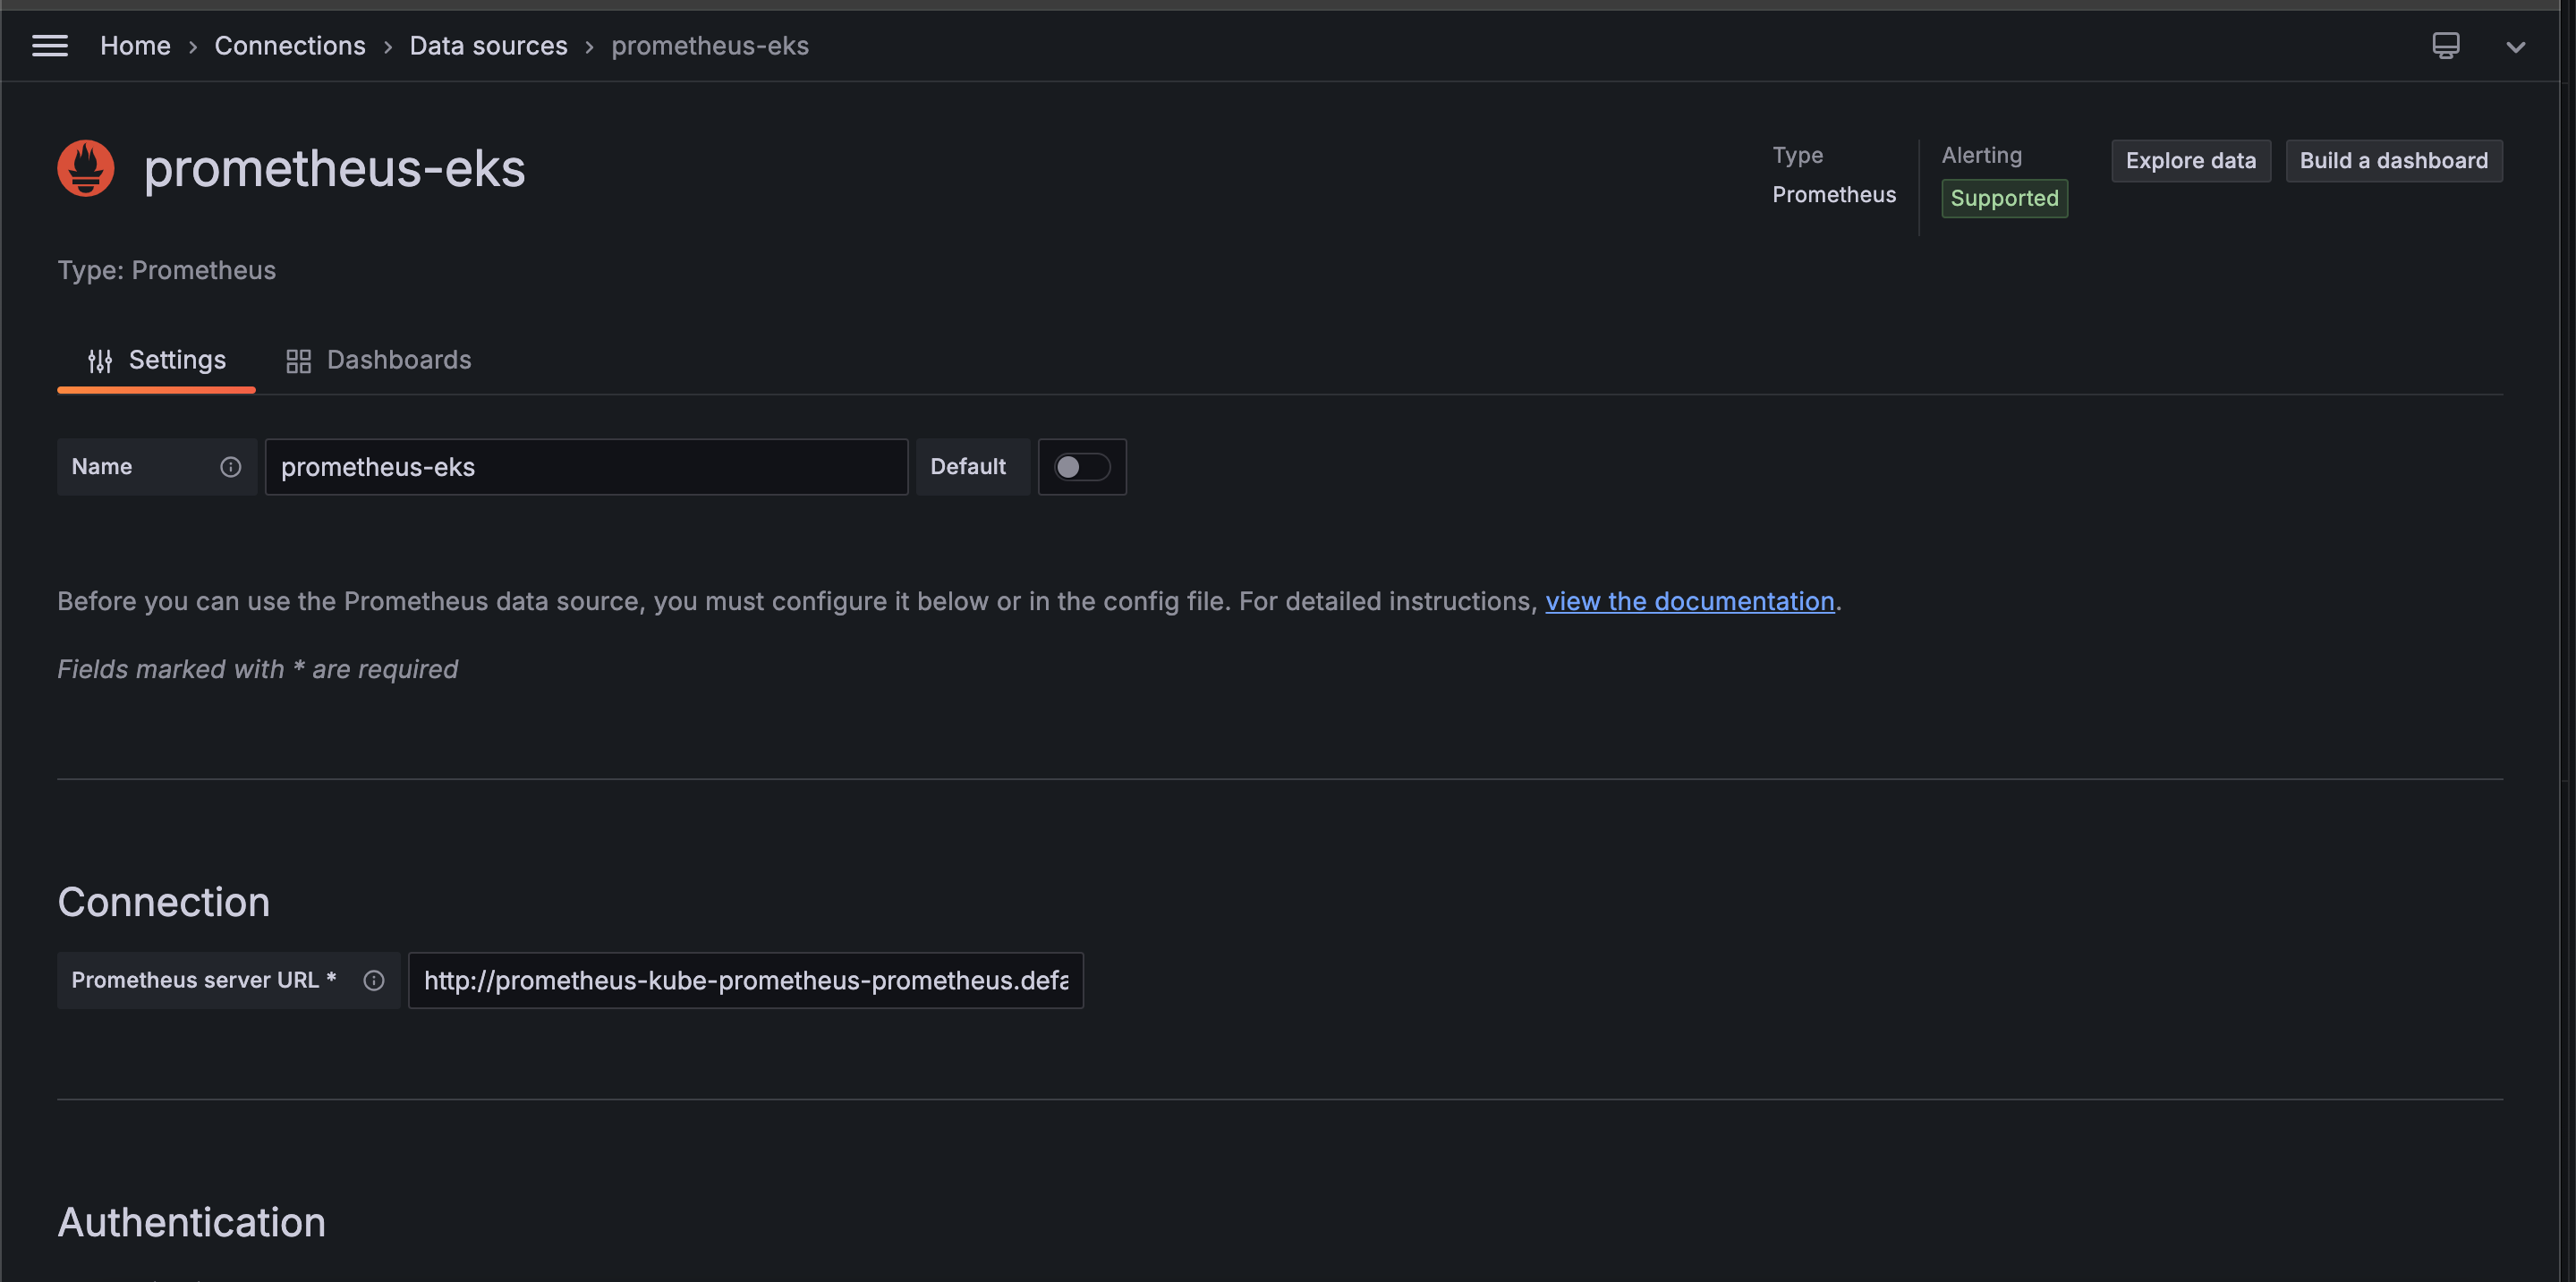
Open grafana in your browser(http://localhost:3000)
Login with default credentials of Username:
adminand Password:prom-operatorGo to Data Sources → Add Data Source.
Select Prometheus.
Give your data source a name.
Enter the following URL:
http://prometheus-kube-prometheus-prometheus.default.svc.cluster.local:9090.HTTP method: GET
Scrape interval: 15sec
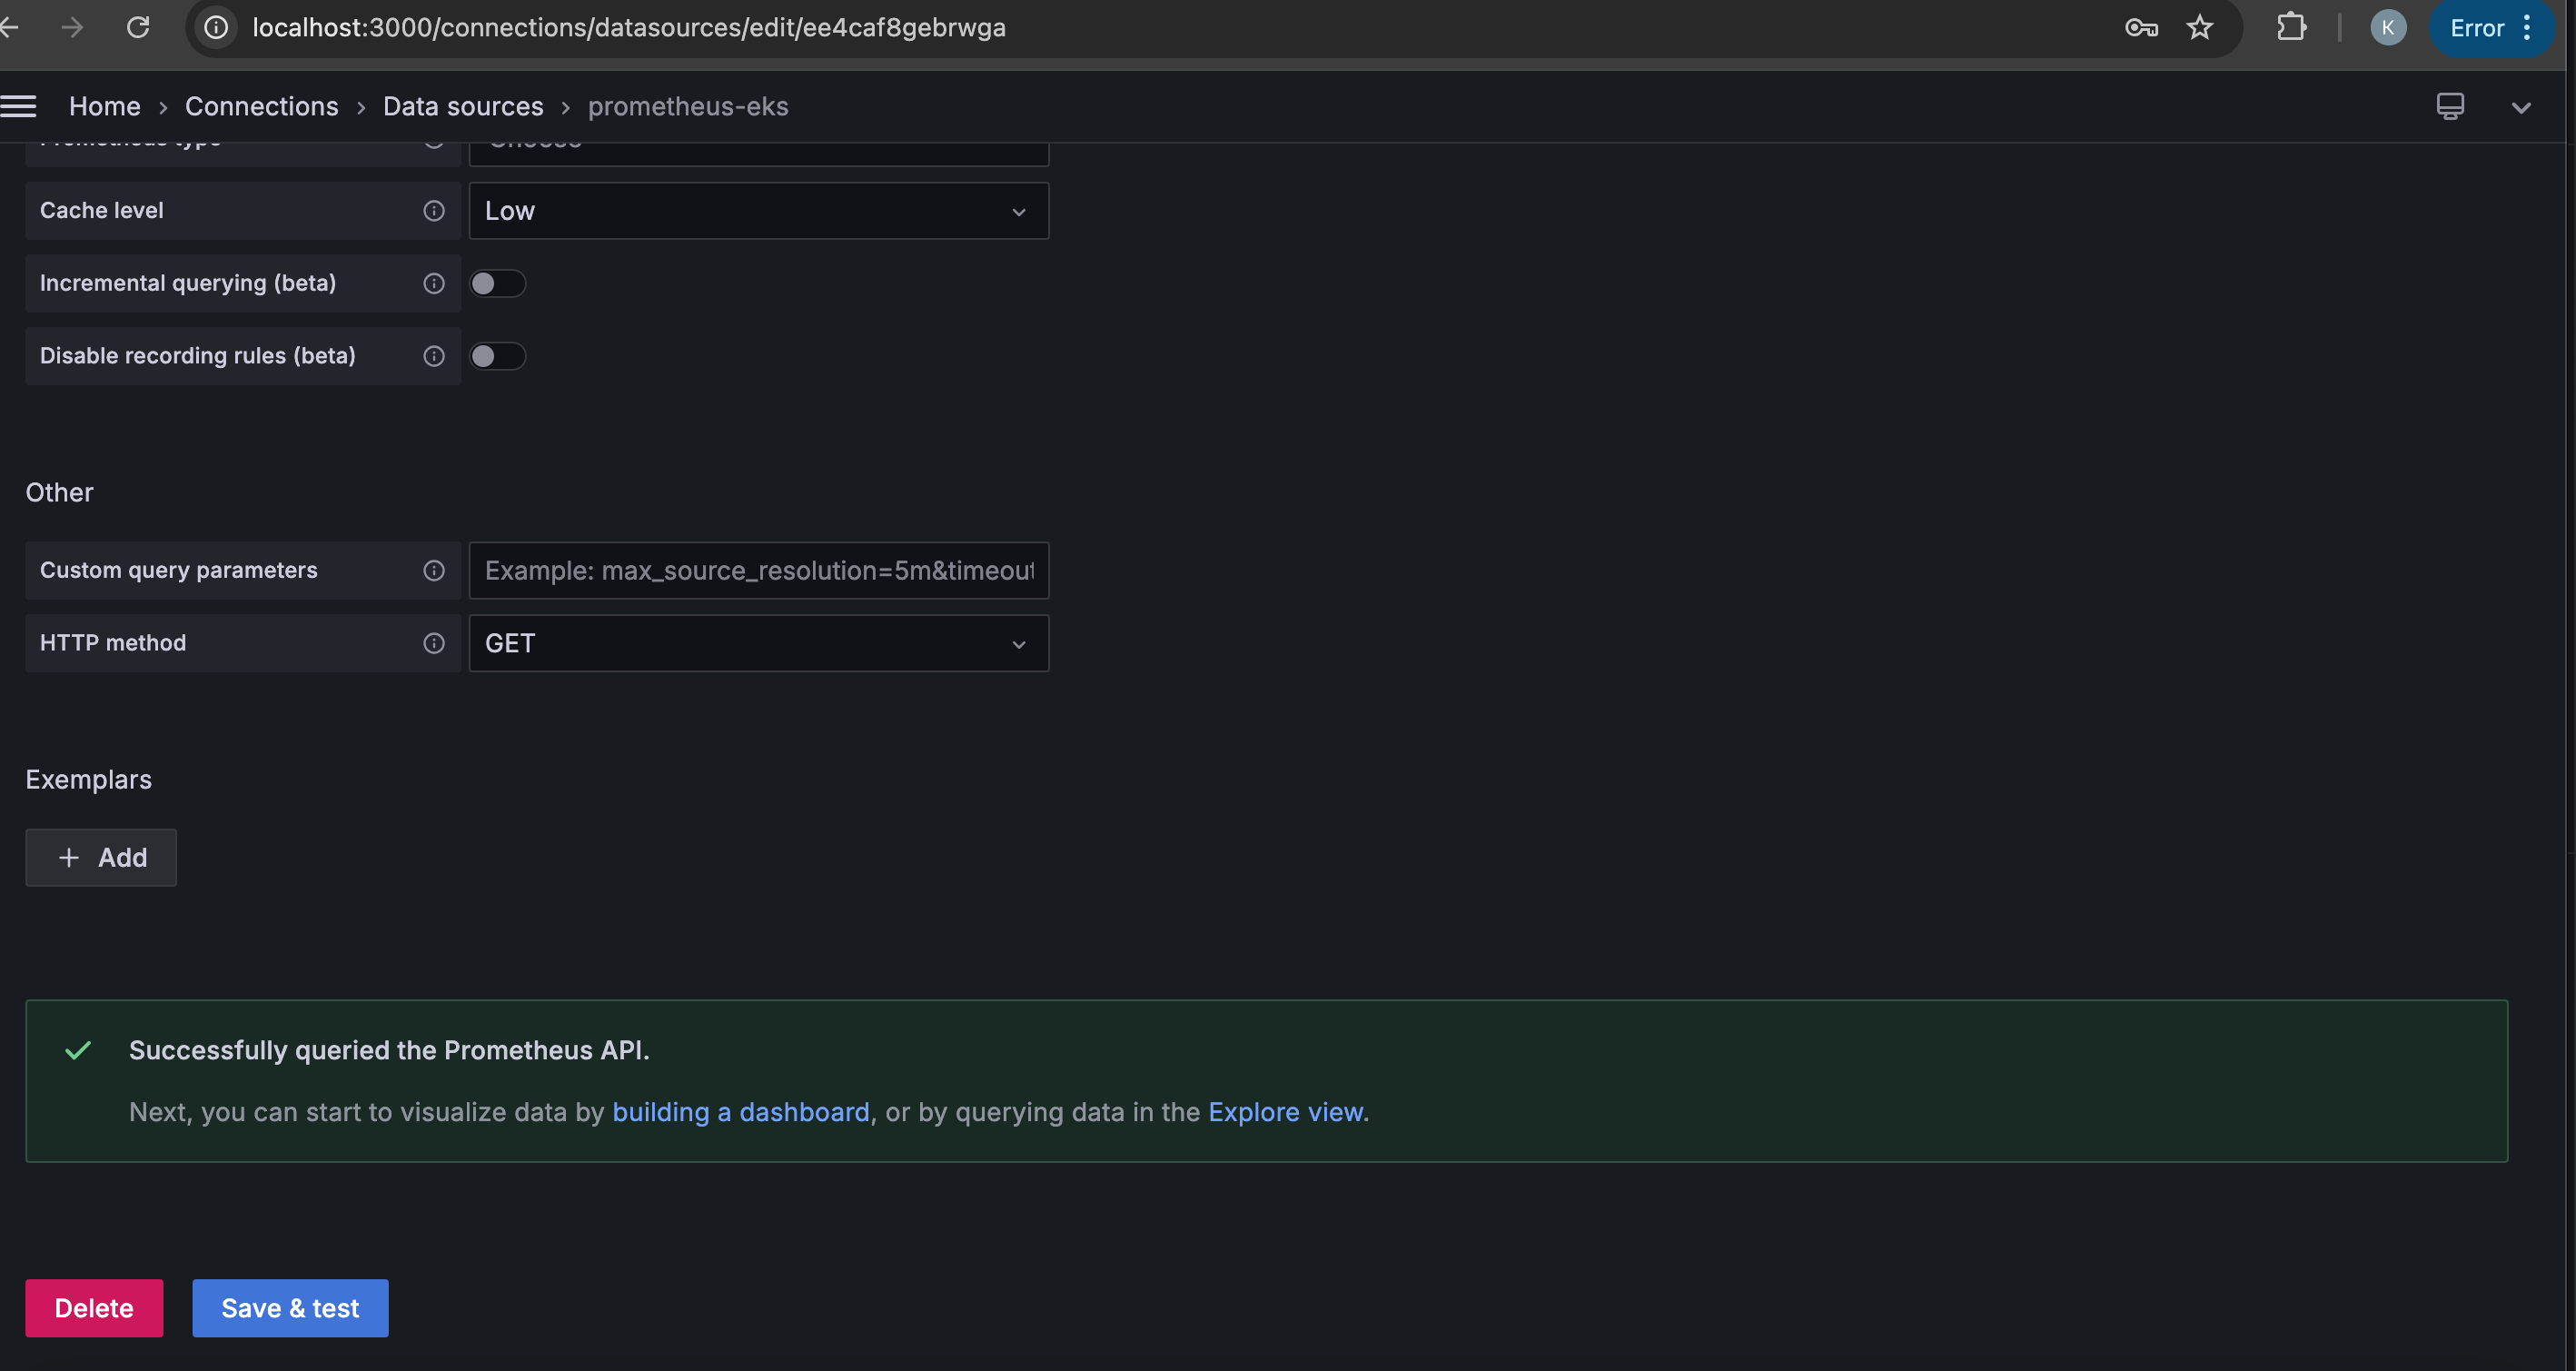
Click Save & Test.
You should see the success message below.
Now we have tested and it is running, the next thing is to Create Grafana Dashboards. We can create a dashboard from scratch or import the pre-configured dashboards available to visualize Kubernetes and Prometheus metrics on grafana.com.
We will create a custom dashboard for the app metrics for this article.
Click on “building a dashboard“ to build a custom dashboard.
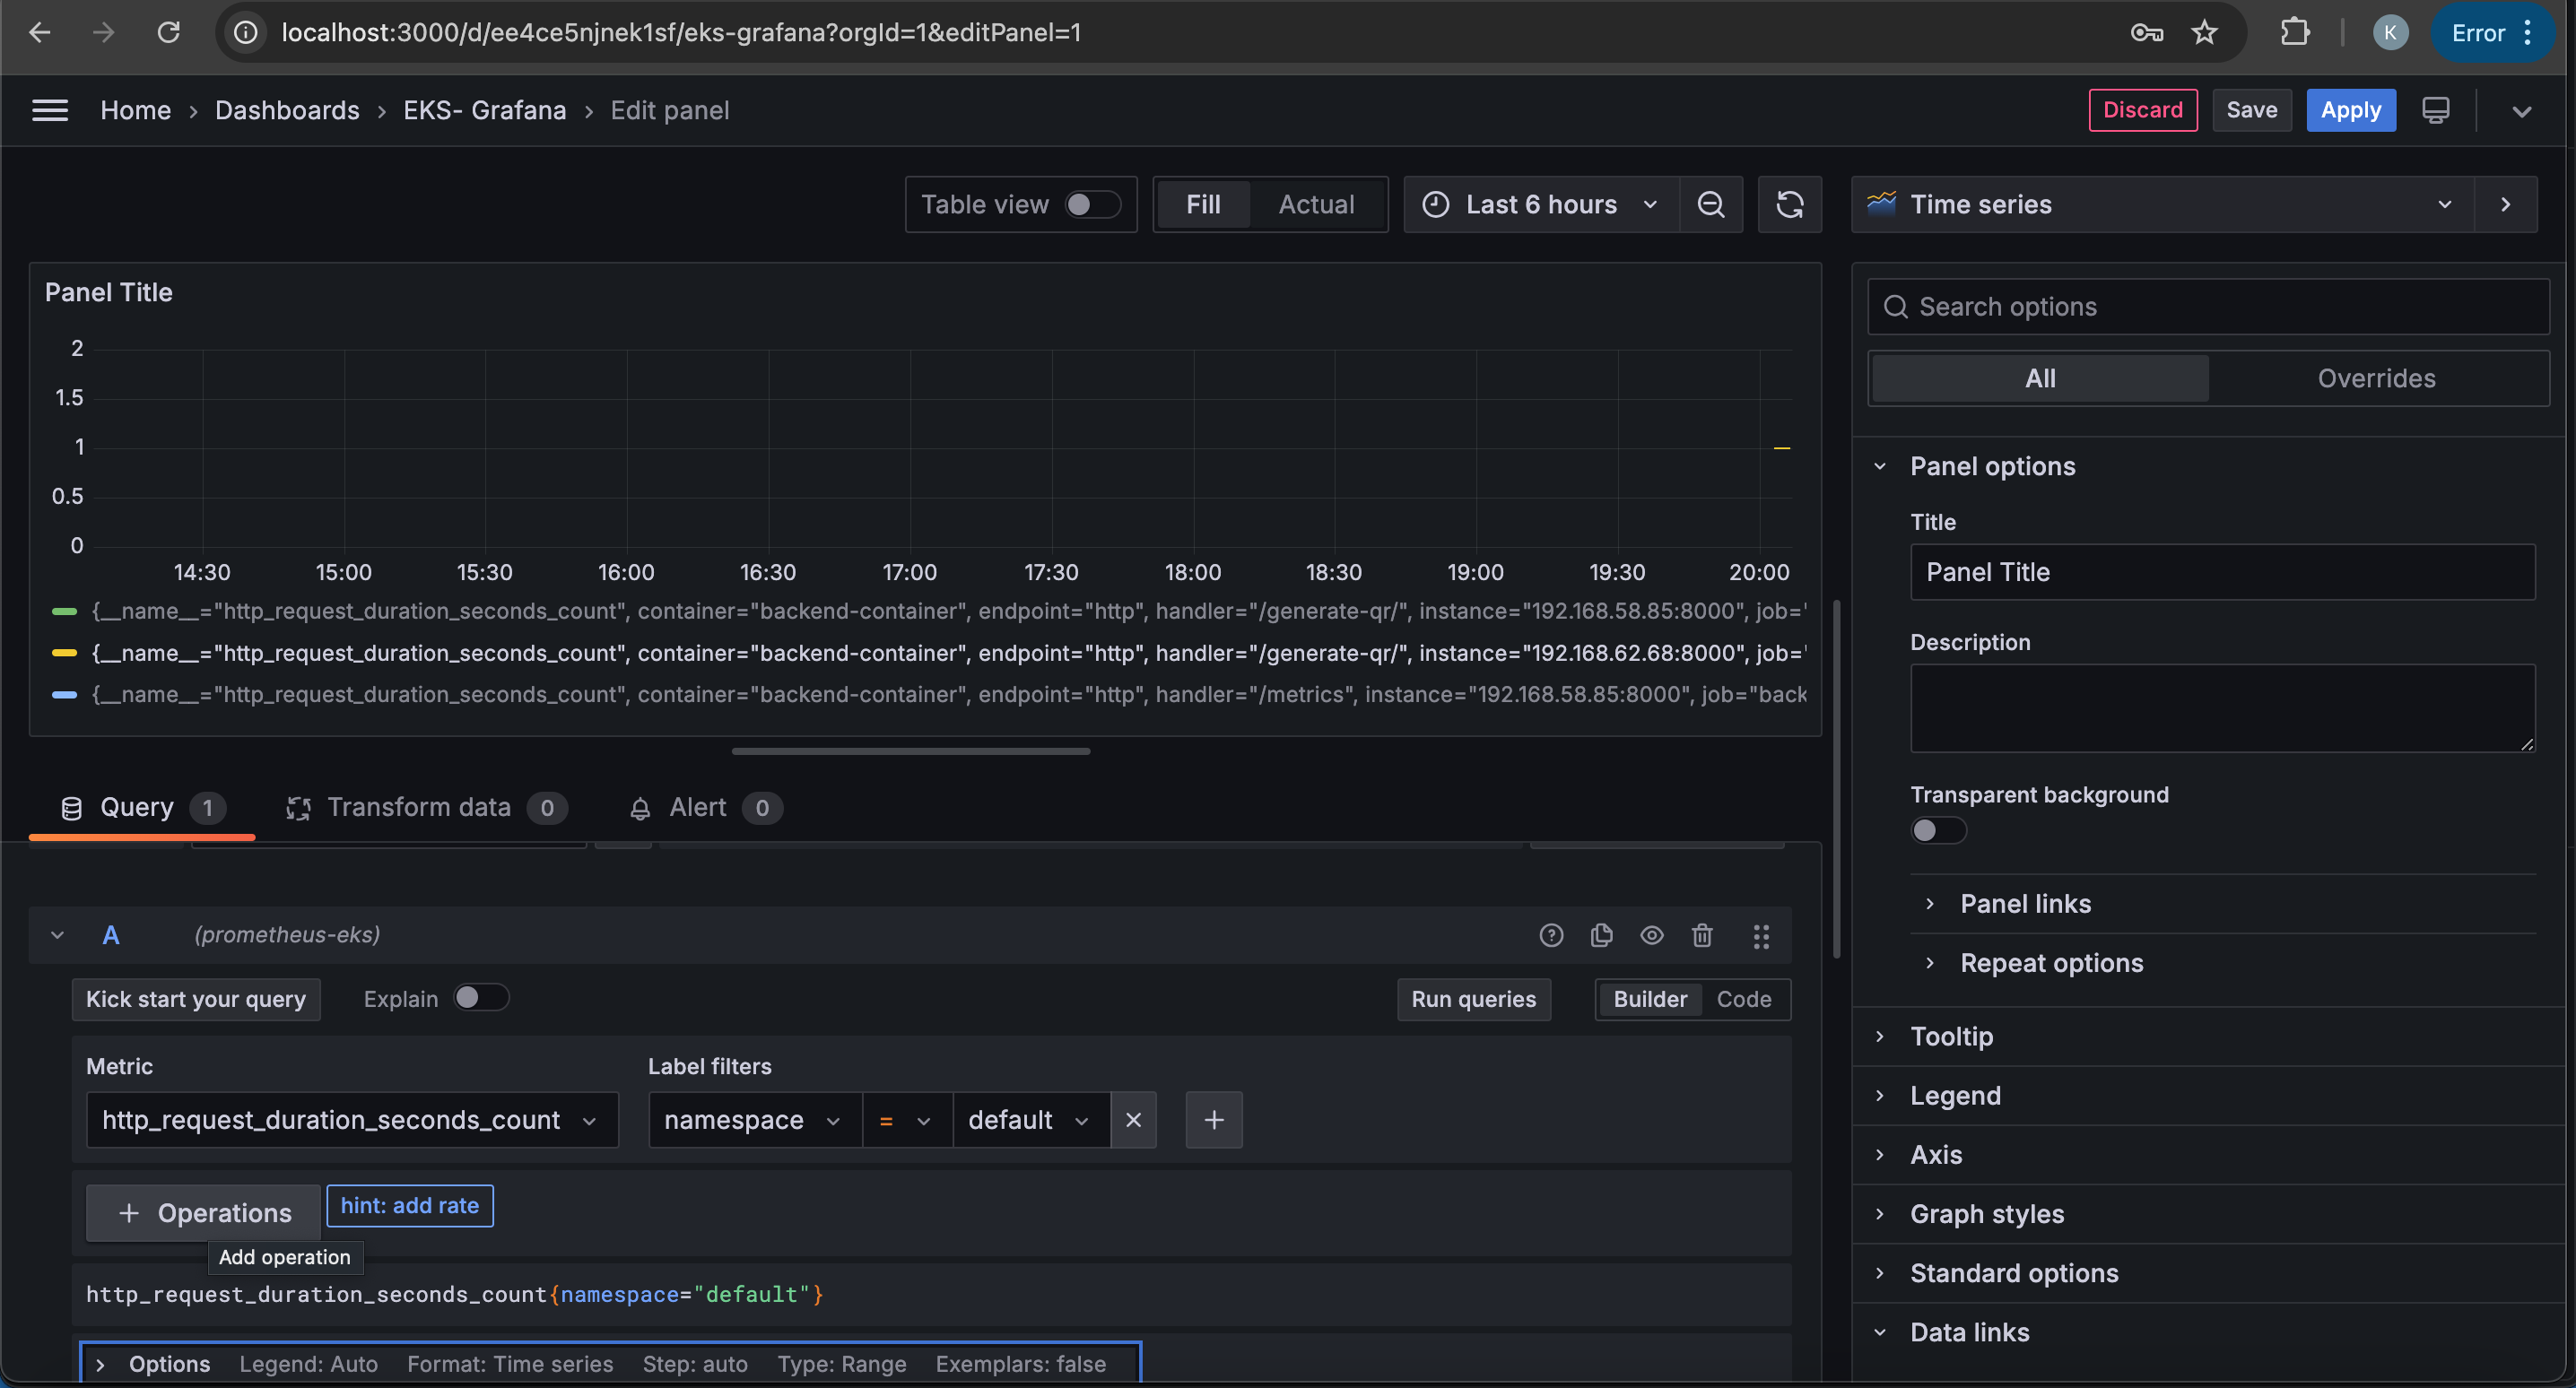
Here you can select the type of visualization you want to add to the dashboard. For this example, we will select the "Time Series" visualization.
You can query the data source by choosing the specified metrics from the metrics dropdown.
Because we are using the FastAPI Instrumentator exporter, we have some default metrics it scrapes like
http_server_requests_total: The total count of HTTP requests received.
http_request_duration_seconds_count: represents the total number of requests received by your FastAPI application, categorized by their durations.
process_cpu_seconds_total: Total CPU time consumed by the application.
process_memory_bytes: Memory used by the application.
process_memory_bytes: Memory used by the application.
The image below shows what it looks like when we scrape the “http_request_duration_seconds_count“ metrics.
We have seen how to monitor the FASTAPI application using the Prometheus UI and Grafana.
Next up is to set up a CI/CD Pipeline to automate our workflow.
Setting Up a CI/CD Pipeline for our Workflow.
Before setting up a CI/CD pipeline, any time we make changes to our code, we will have to restart deployment, rebuild our docker images, and push up to ECR to pick up the latest changes made to any part of the codebase.
It could be cumbersome and tiring to run multiple sets of commands every time we make changes especially if these changes are frequent and made at smaller intervals. For that, we need a pipeline that will automate these tasks, reduce the chance of human error, and make it easier to track and organize your workflow.
Since the codebase is on GitHub, GitHub Actions is a natural choice for setting up CI/CD workflows. It integrates seamlessly with GitHub repositories and supports automating tasks. There are other options like AWS CodePipeline, Jenkins, CircleCI, etc.
within the project root directory, you should see the “.github/workflows“ folder and a “ci-cd.yml“ file. The File contains the configuration we need.
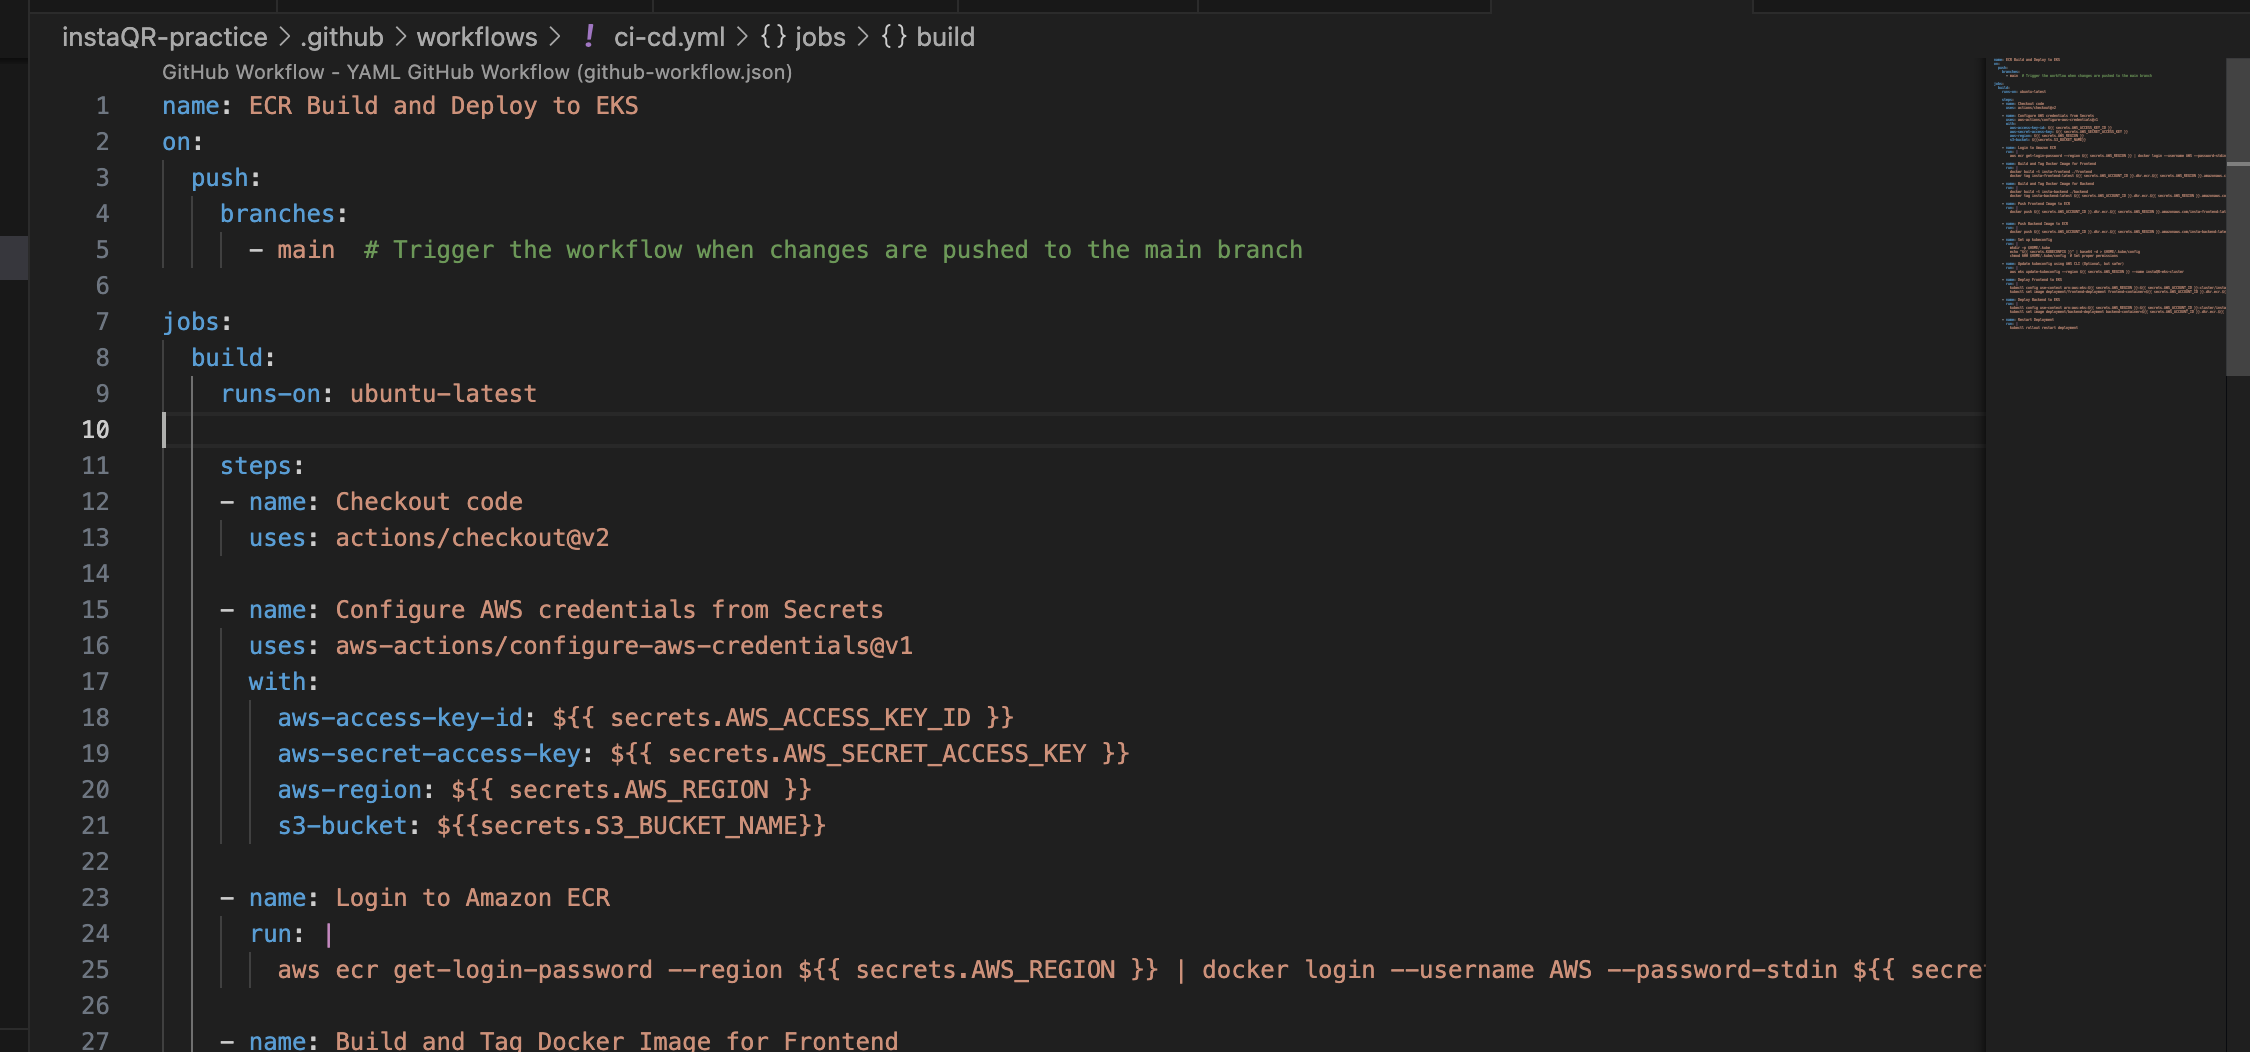
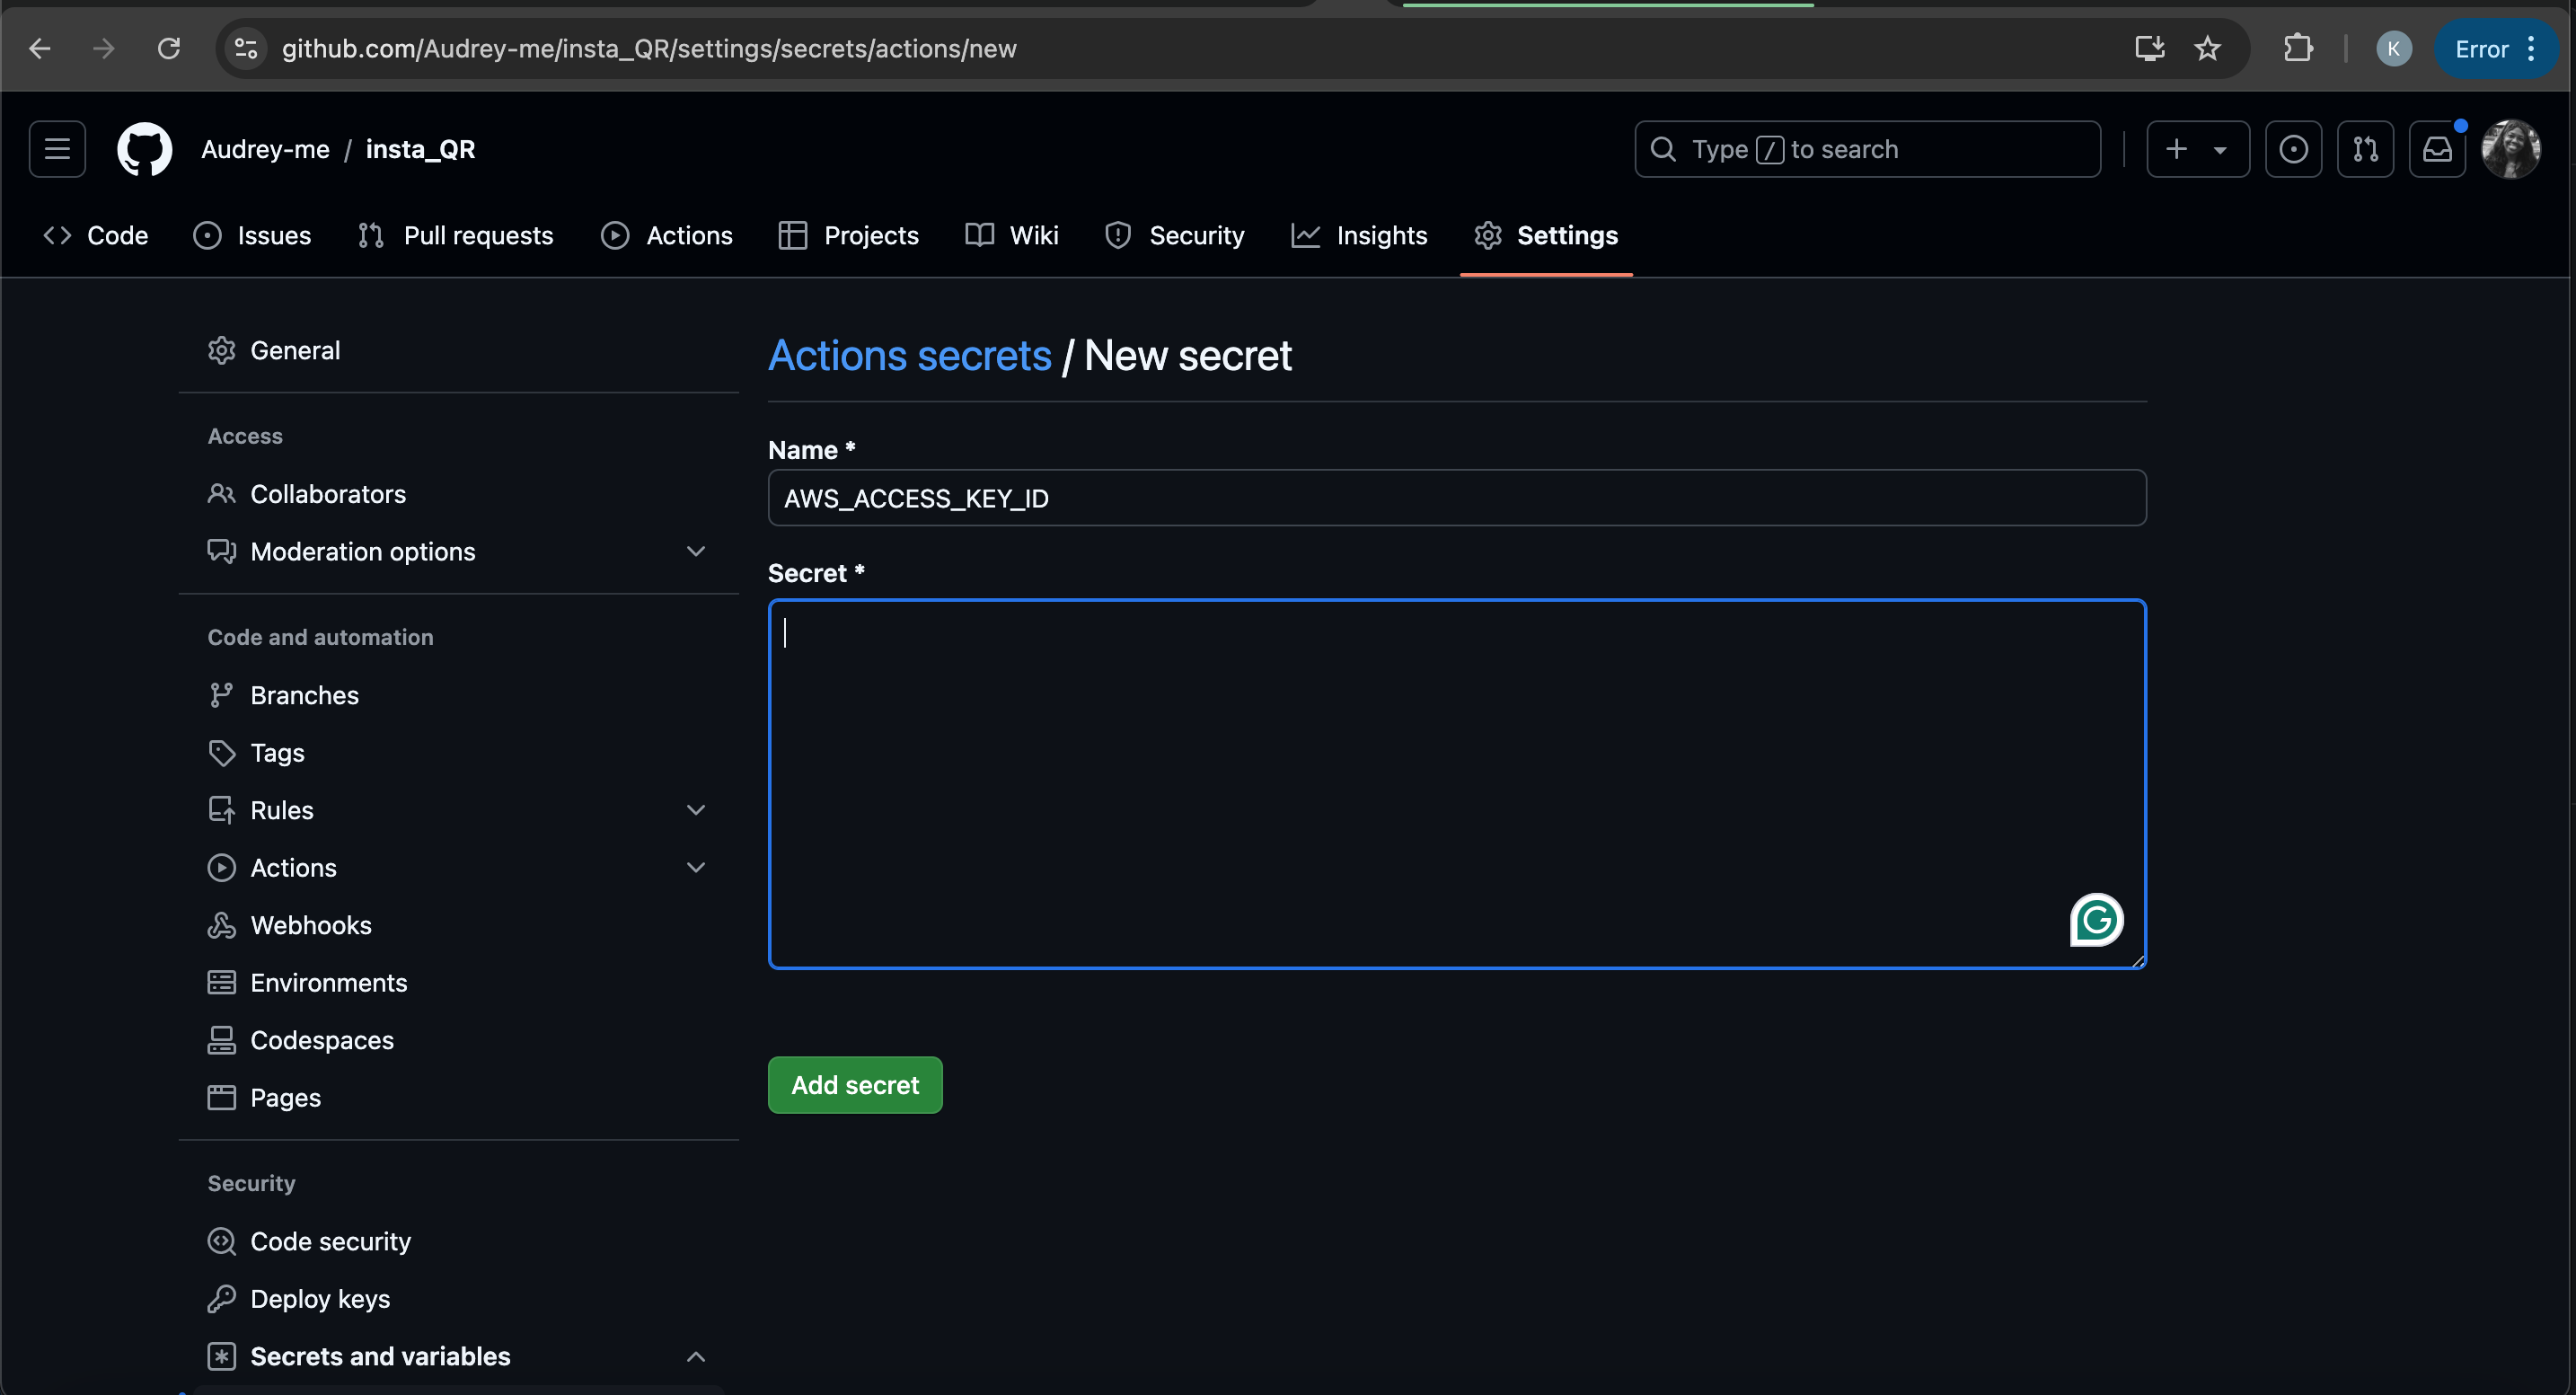
Remove the .env file from the project and add your credentials to GitHub secrets by going to
GitHub repository > Settings > Secrets and variables > Actions.
Retrieve the Kubeconfig File: The
kubeconfigfile is typically stored in~/.kube/configon your local machine and we need to get the file so it can be added as a secret in github.cat ~/.kube/config | base64Copy the output and add it to the kubeconfig secret value field.
Push up your changes to github and you should see this on a successful workflow run.
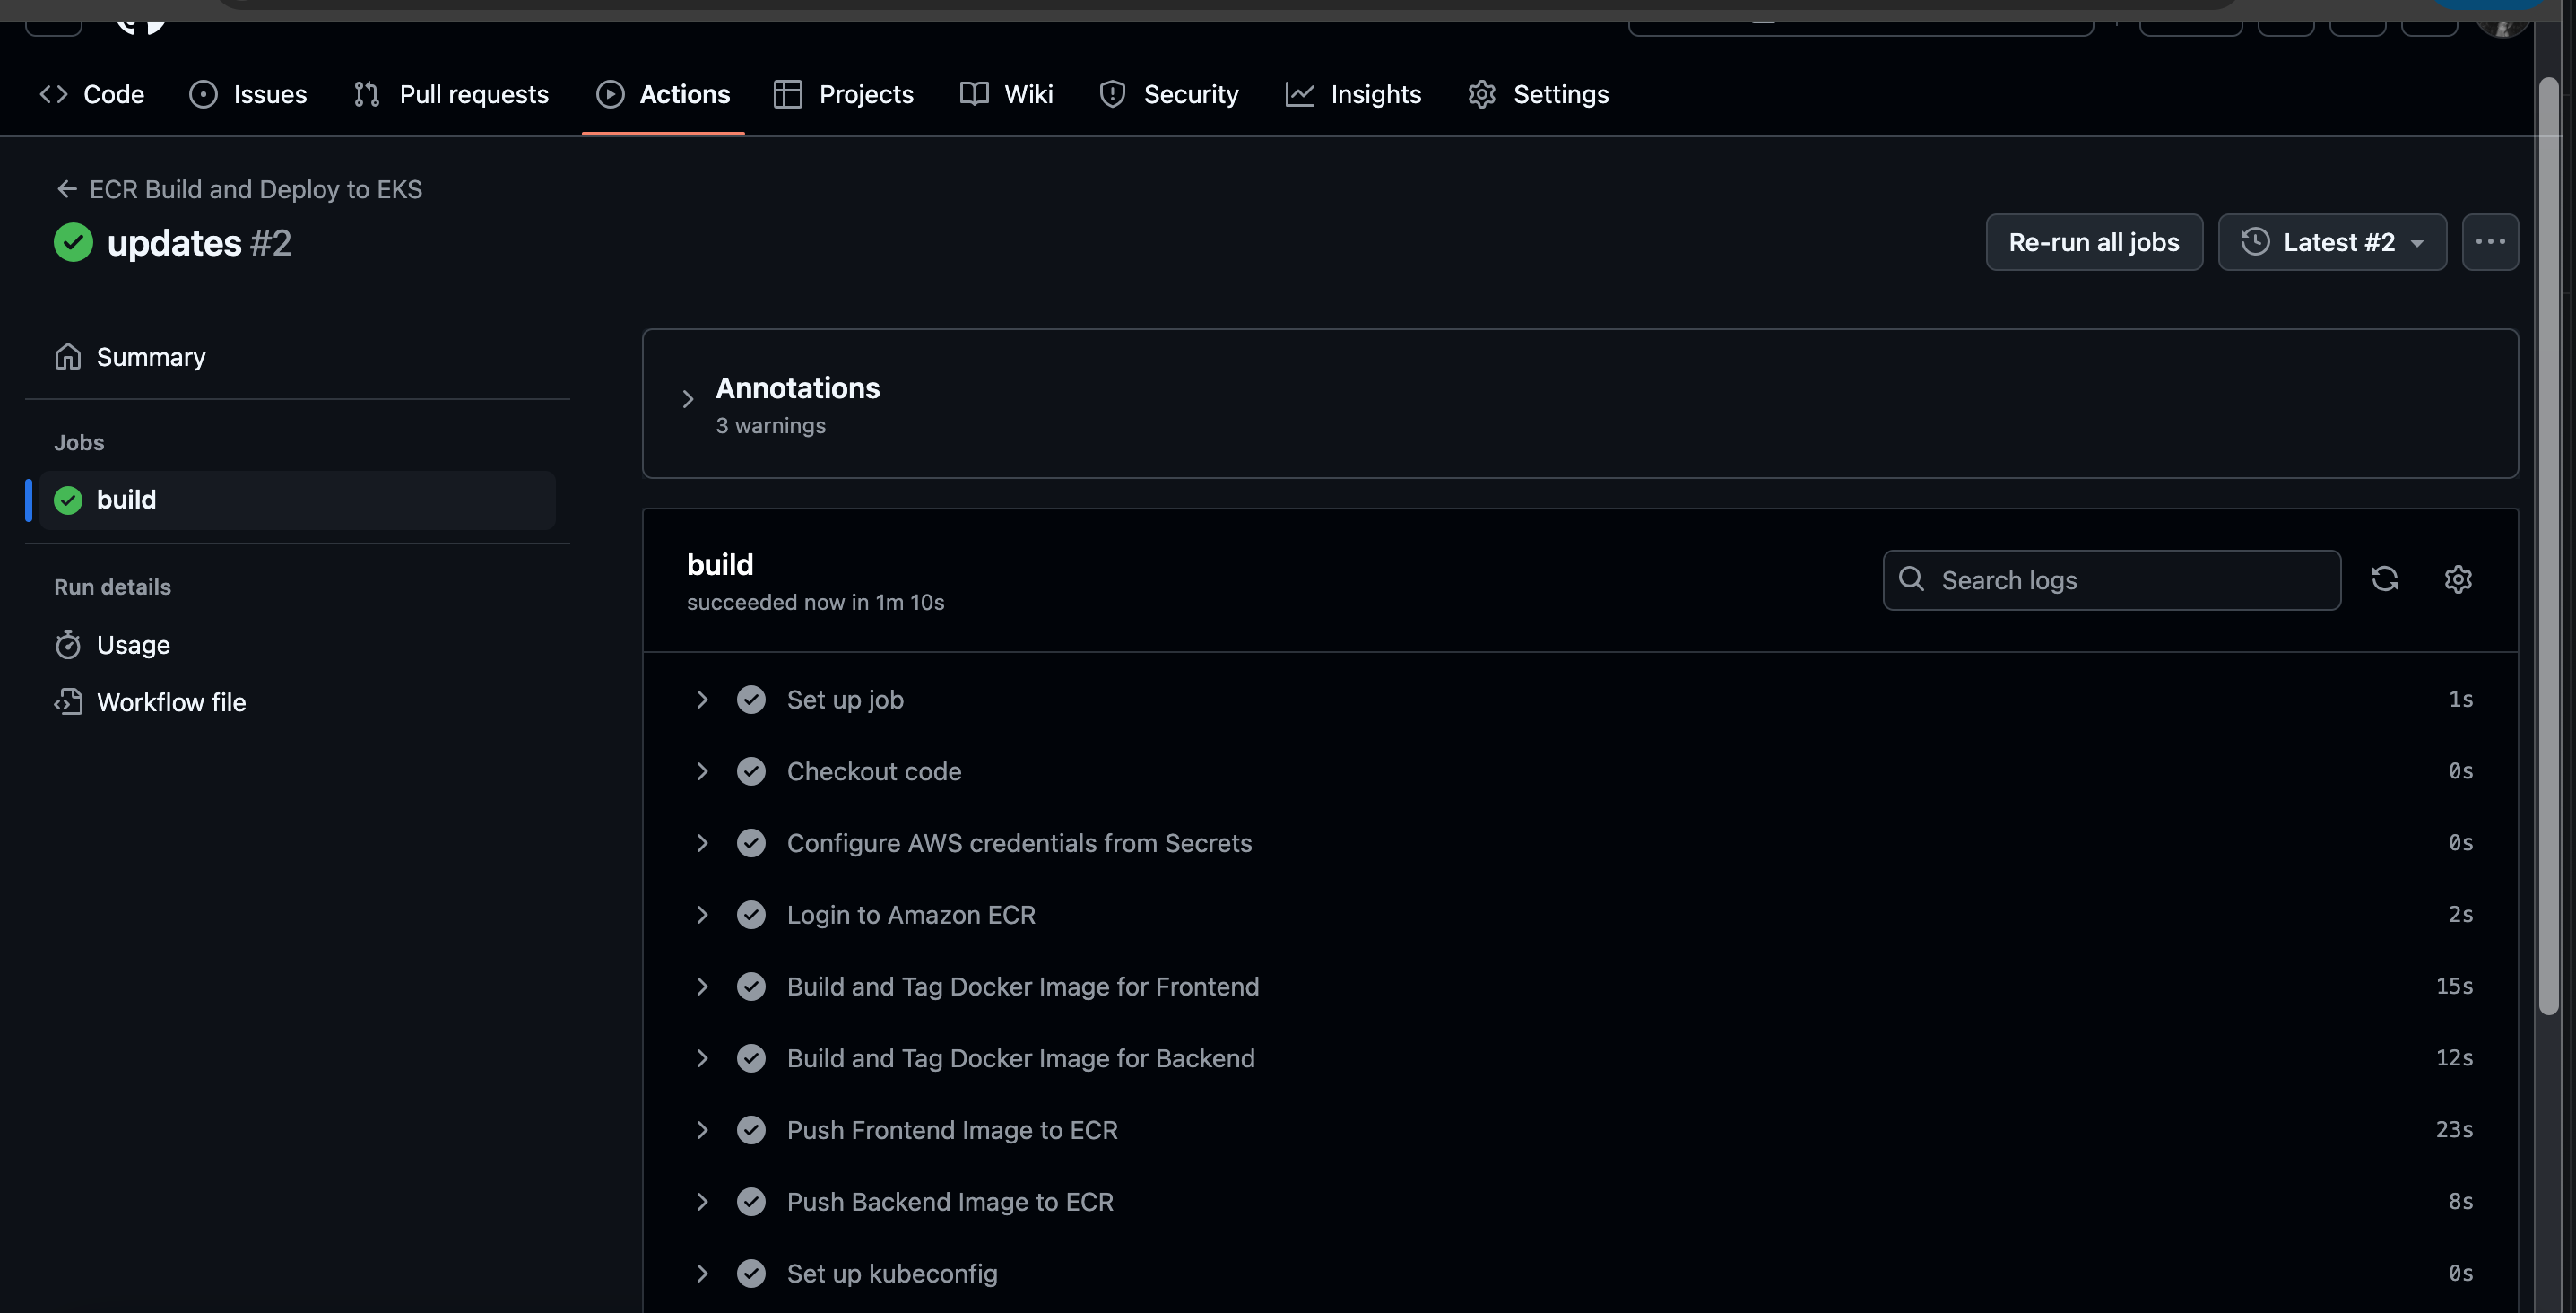
In summary, we have learned creating container images using docker, deploying locally using docker compose, deploying on Elastic Kubernetes Service, monitoring our application on Prometheus and Grafana and finally setting up a CI/CD pipeline to automate our workflow.
Congratulations on getting this far.
Resource Suggestion
For the prerequisites needed to follow along with this article, I've included some resources below that have helped me understand these concepts in the past. Feel free to explore more options as well.
Subscribe to my newsletter
Read articles from Akaeze Kosisochukwu directly inside your inbox. Subscribe to the newsletter, and don't miss out.
Written by

Akaeze Kosisochukwu
Akaeze Kosisochukwu
"Frontend dev exploring the cloud ☁️ | Writing about frontend tools & cloud topics ✍️ | Creating user-friendly interfaces with a focus on performance ⚡️ | Let's connect and dive into the exciting world of frontend development and the cloud! ✨"