Mermaid Test
 Kristofer Koishigawa
Coding can be intense. Especially when you are knee-deep in debugging or trying to map complex projects. For many developers — novice and pros alike — it is not uncommon to spend hours staring at code, looking for answers that won’t come.
You have tried every trick possible but still feel lost. Self-taught programmers often struggle to find pair-coding support or mentorship, and while online resources abound, they can be overwhelming and not always helpful.
Endless hours at the screen without progress can lead to anxiety, burnout, and fears of failure and non-performance.
If you’re working too many hours, take a real break. Pacing yourself is better than risking burnout. But before you get to a very low point, why not try something simple that brings clarity?
I’m talking about flow diagrams – and in this article, I’ll show you how they might be able to help you out.
From Skepticism to Clarity with Flow Diagrams
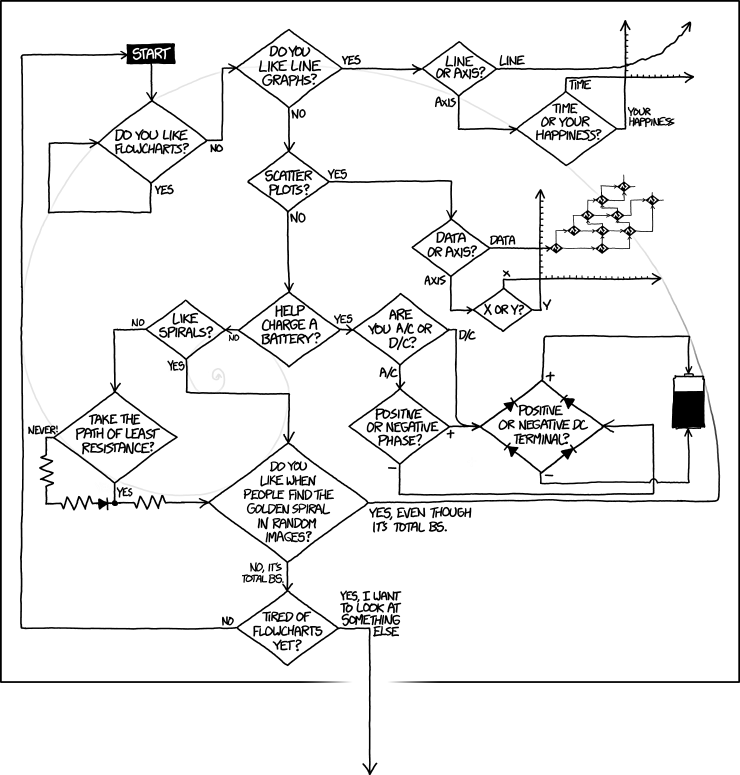
I was actually late to flow diagrams and the sort during my learning journey, finding justifications for my lack of adoption everywhere:
Prejudice ("Flowcharts are for the time of Cobol"), feeling intimidated (just look at the UML and SysML frameworks...)
Their apparent lack of generality (they seemed too focused on OOP)
Not finding real tools that could facilitate their use (my first serious ones were in PowerPoint or Google Slides, uagh!)
These were a few of the reasons that didn’t help to boost my interest. And then finding people drawing diagrams on MS Paint in some online courses, even if explanatory, was not encouraging at all.
Having followed a self-taught path, I also noticed that the courses I took made no mention of the use of these diagrams as a tool to help your coding. In some cases I found people who didn't favour their use, specially those who, like me, were pursuaded by a "learning the hard way" approach (a more a trial and error way of coding). And I didn't see many people using them in the many coder communities I was part of either.
That was my case until one day, frustrated, I mapped out a complex module with a sketch diagram. It was a breakthrough: finally, I could see how the pieces connected.
Later in my career I discovered that, in professional environments, diagrams were everywhere, not just a “like to have” or in PowerPoint presentations. I met a lot of professionals using them when documenting processes or trying to explain implementations to non-technical as well as technical clients. And they were really helpful for me when trying to understand the base code and the relationship between packages implemented by someone else.
Common Use Cases for Flow Diagrams
Keeping aside the numerous sites that praised the use of visual aids, I was interested in how developer communities responded to that basic question: how do developers use flow diagrams?
The answers seemed to show the overwhelming opinion that they were useful. There were, though, many different opinions about for what to use them, with many contributors emphasizing their own preferences.
The most common reasons that I found to use a flow diagram were:
- Focus: A visual resource to help you think about a problem.
Sometimes yes, if a project needs a lot of brain power it just helps to have a flowchart or else I'll hyper-focus on something completely irrelevant and [zoom] out and then start all over again. (ninesonicscrewdriver on reddit)
- Planning: Map out your steps before diving in.
I use flowcharts all the time as my first step in problem solving. Usually helps especially when i need to note every move that i wanna make. (KMbugua on spiceworks)
- Documenting: Keep track of your work in a way that’s easy to follow.
I use flow diagrams all the time in my job to document high level architecture and dependency graphs.(Icanteven______ on reddit)
- Sharing Standard Processes: Use them as a tool to faciliate the reading of standard processes.
There come to be certain diagrams that everybody has a copy of, and that are seen on whiteboards all around the office because they are so important/common. eg, a diagram to describe that "Data from the application, is encapsulated using a UDP header, and then travels to the IP layer, where a header is then added..." (poundifdef on stackoverflow)
- Communicating and Teaching: Explaining your code to both technical and non-technical people.
All the time. When I used to teach college classes, we offered a logic class that used flowcharts to "write" programs. (PopularElevator2 on reddit)
- Analysing Existing Code: Break down your code and others’ to see what’s really going on.
I find flowcharts are useful AFTER the code is written. I make a flowchart when I am analyzing undocumented legacy code. Having the quick reference has helped me be the hero a number of times when no one else could solve the company crisis. (Brian on sololearn)
There are some other situations where I agree that a flow diagram comes handy (from Dam Brown’s post):
Clarifying ambiguous requirements
Identifying conflicting procedures
A way to point to relevant / critical nodes
Drawbacks of Flow Diagrams
But even when flow diagrams aren’t discouraged, I’ve found that they’re not a must-have tool for everyone, and they have their own set of challenges:
- Although very flexible, flow diagrams trend to scale poorly when trying to detail complex processes.
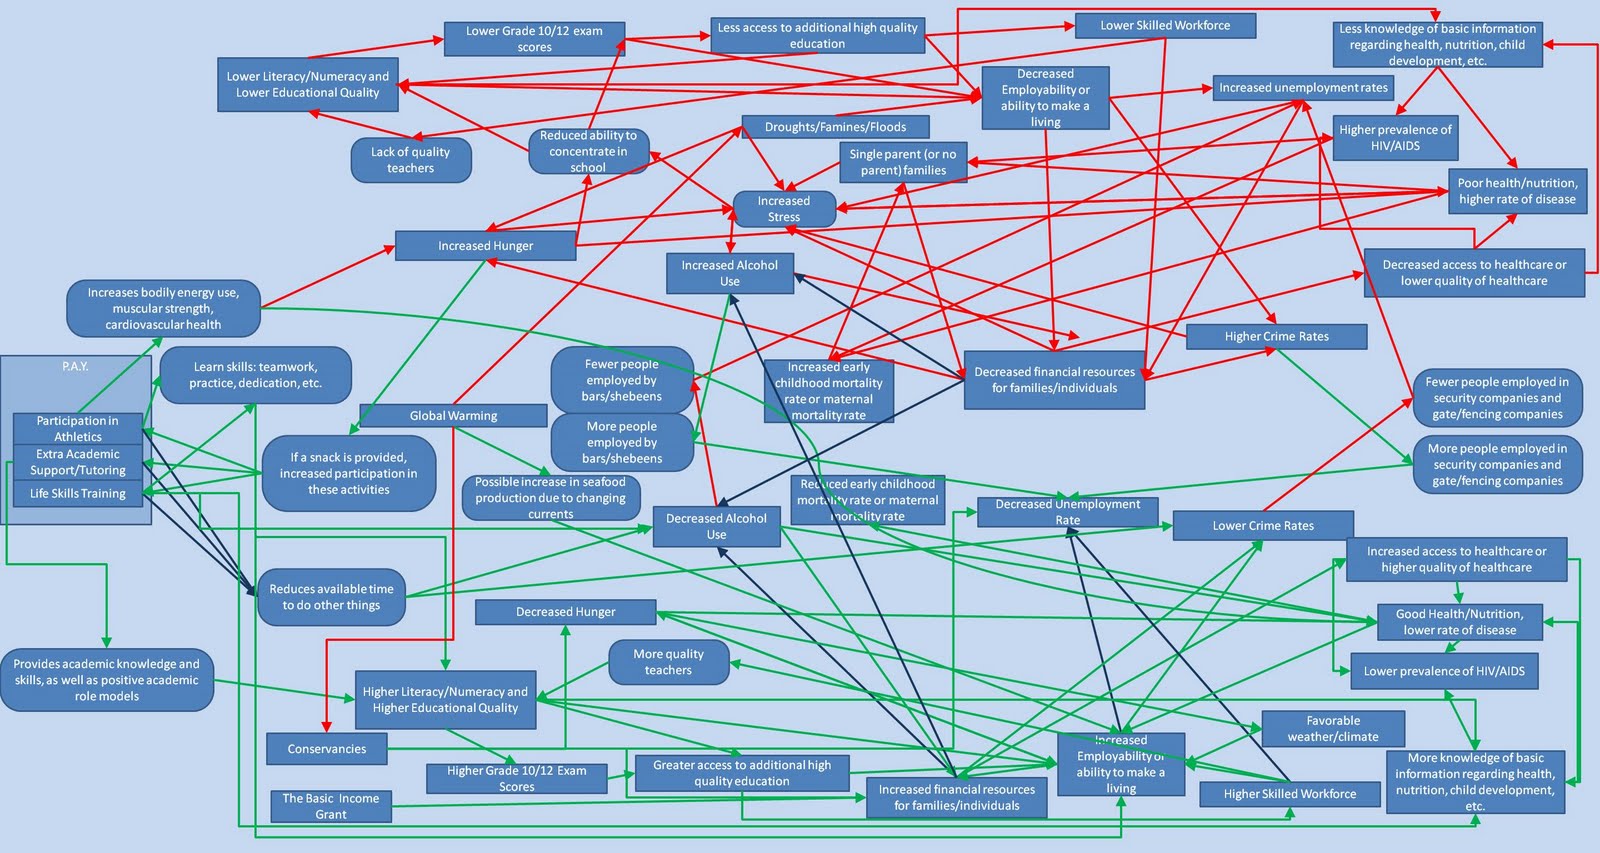
Note how often the diagram ends up looking like a big ball of tangled string. (tonicinhibition on reddit)
- They get quickly outdated in rapidly changing environments.
...we've got several application diagrams that are already outdated with just a couple of sprints. 😉 (David Carroll on sololearn)
- The more experience you get or more exposure you get to the company code base, the less you need extra explanation.
After a few years of practice and work, I switched from doing flowcharts in paper or whiteboard to doing them on my mind... (umlcat on reddit)
Now that you know some of the uses and drawbacks of flow diagrams, let’s see how you can create one yourself. I’ll also share some best practices along the way.
How to Create a Flow Diagram: A Flowchart example
[new section here]
There are many types of flow diagrams, each of them with their own applications, strengths and weaknesses. From all of them, the most popular to describe code logic is the flowchart. Actually, the use of flowcharts in its strict version is very unpopular between coders. However, coders make use of some of its advantages by loosing some of the original conventions.
Although you are free to fit diagrams to your purposes, be aware of the different diagrams that you can use and the conventions associated with them, and see if they work for you.
For my examples I will be using Mermaid, a Javascript library that translate written declarations of entities and relations into diagrams. It is like coding the diagram. The instructions are also Markdown-compatible.
If you are curious about Mermaid and how to use it in your projects, read this Freecodecamp article by Zaira Hira.
Keep in mind that the use of Mermaid is not compulsory. Rather than focusing on the tool I would suggest you to pay attention to the list of things that you should consider when making a flowchart, and that can be also extended to other flow diagrams.
Now let’s see what we need to know when building some flowcharts.
You might not need all the shapes
Specially if you are working on a small problem, or with a lot of unclear steps, or when you and your audience don’t understand what those shapes mean, it is possible to limit the number of shapes to a few of them. Otherwise adding more shapes might add confussion instead of clarity.
The most popular shapes are the following:
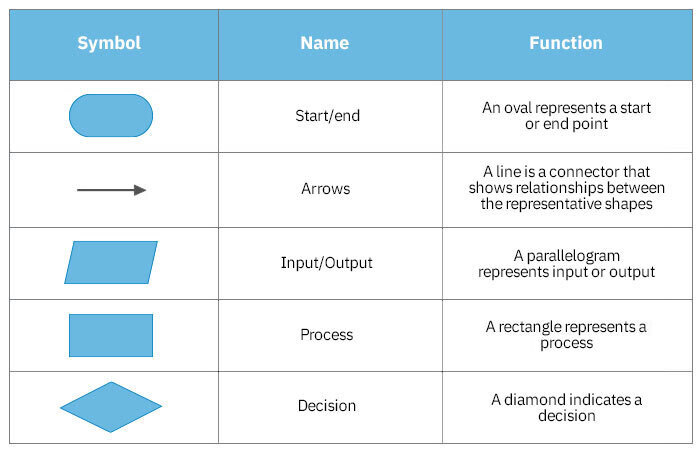
From that table, the Process shape is likely the one you are going to use more as a wildcard shape to replace many of the other unused shapes.
Another shape I am recently using is the hexagon:
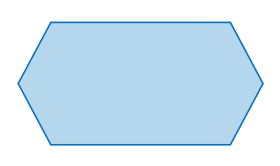
Known as the Preparation symbol, I use it to indicate initial declarations and conditions.
Get an idea of where your flowchart should start and where should end
Remember that it is about a flow. Try to get that flow between those two points.
The construction of flowcharts is rather similar to how you would code under the imperative paradigm, so organize your ideas accordingly. Even if you prefer other paradigms, the exercise that you will make when using flow diagrams is not to code according to the diagram, but capturing and revealing the flows.
You use the start/end shape to indicate the start and end of the flowchart.
flowchart TD
   A([start]) -.-> P([end])
   style A fill:black, color:#fff
   style P fill:grey, color:#fff
Arrows are more than a connection between two nodes.
Arrows play a usually ignored role in diagrams. They are not only valuable in establishing relationships; they can provide additional information about how those relationships are (if it is broken, priority, two-way, etc). The kind of relationship can be indicated with different kinds of arrows and terminations.
I find arrow labelling particularly important. When using flowcharts, I use the labels to make a description of what comes next, as well as notes about variable values I want to keep track of.
flowchart TD
A([start]) --> |variable declaration| B{{"*character*(str)
                                          *count*(num)
                                          *rows*(list)
                                          *result*(str)"}}
style A fill:black, color:#fff
B -.-> C["..."]
Add descriptions to the shapes with references to operations, functions or target variables.
When working on flowcharts, I personally use the shapes to point to the code line, statement or expression that is represented by that step.
flowchart TD
   A["..."] -.-> D[/"`input: *i*`"/]
    --> |"`create strings of character of length (*i* + 1)`"| E["character.repeat(i+1)"]
    style D fill:#F8D192
    E --> |"`add newly created string
            at the end of *rows* list`"| F["`rows.push(**new string**)`"]
    -.-> B["..."]
Make use of simple guides to highlight groups, and add a legend to explain those groupings.
If the flowchart has more than 15 -20 steps, everything would start to look the same if you are using the same wildcard shapes, which can be confussing. You could resource to other guides to better clarify aspects of your flowchart. The most usual guide is coloring.
Let’s show an example. I found this code in the Freecodecamp curriculum:
const character = "#";
const count = 8;
const rows = [];

for (let i = 0; i < count; i = i + 1) {
  rows.push(character.repeat(i + 1))
}

let result = ""

for (const row of rows) {
  result = result + row + "\n";
}

console.log(result);
Here below there is the Mermaid-made flowchart that I using to explain the Javascript code given previously:
flowchart TD
    A([start]) --> |variable declaration| B{{"`*character*(str)
    *count*(num)
    *rows*(list)
    *result*(str)`"}}
    style A fill:black, color:#fff
    B --> |start count-controlled for-loop| C{"`Is *i* >= *count*?`"}
    subgraph COUNT_CONTROLLED_LOOP
    C --> |No| D[/"`input: *i*`"/]
    style D fill:#F8D192
    D --> |"`create strings of character of length (*i* + 1)`"| E["character.repeat(i+1)"]
    E --> |"`add newly created string
            at the end of *rows* list`"| F["`rows.push(**new string**)`"]
    F --> |"`bottom of the block: update *i*`"| G[/i = i+1/]
    style G fill:#F8D192
    G --> |evaluate condition| C
    end
    C ----> |Yes| H[/"`output: *rows* list with *count* string elements`"/]
    style H fill:#ECF892
    H --> |"`start collection-controlled for-loop:
    *rows* = ['#','##','###',...] (length = *count*)`"|I{"`Did we enter all elements
                                                       of the *rows* list?`"}
    subgraph COLLECTION_CONTROLLED_LOOP
    I --> |No|J[/"`input:
               *row* (str) = currentOf(*rows*)`"/]
    style J fill:#F8D192
    J --> |"`concatenate *row* string and a endline (\n) to the current value of *result*`"|K["`*result* + *row* + \n`"]
    K --> |"`overwrite *result* with its new concatenation`"|L["`*result* = **concatenation**`"]
    L --> |"`bottom of the block: update entering value`"| M[/"`currentOf(*rows*) = nextOf(*rows*)`"/]
    style M fill:#F8D192
    M --> |evaulate condition| I
    end
    I --> |Yes| N[/"`output: *result*(str)`"/]
    style N fill:#ECF892
    N --> |"`display *result* on the console`"|O["`console.log(*result*)
            fa:fa-display`"]
    style O fill: #DFFF73
    O --> |finish|P([end])
    style P fill:grey, color:#fff
If you are using colors, I would advise you to select a basic palette with no more than 5 colors and think of just a few groups. Provide also a legend to explain your group definition when possible.
Coloring is not the only resource. There are flow diagram tools that allow you to create partitions and groups, or you can create them manually.
In any of those cases I personally prefer to make a proper definition of those groups at the final draft where I can have a better overview of the diagram.
Be consistent with the conditional expressions.
The following two images below show two different versions of two conditionals evaluating the same variables: x, y and z. This is the first version:
flowchart TD
    A["..."] -.->|first condition| B{"is x > z"}
    B --> |YES|C["Do something with x"]
    C -->  |second condition| D{"is x < y?"}
    style D fill:lightblue
    D -->|NO| E["Do something with x"]
    E --> F["return x"]
    B --> |NO| F
    D --> |YES| F
Now look at the following version and compare the second condition in both diagrams:
flowchart TD
    A["..."] -.->|first condition| B{"is x > z"}
    B --> |YES|C["Do something with x"]
    C -->  |second condition| D{"is x >= y?"}
    style D fill:lightblue
    D -->|YES| E["Do something with x"]
    E --> F["return x"]
    B --> |NO| F
    D --> |NO| F
Differently to the first flowchart, in the second chart the condition has been changed so the action on x is only taken when the condition is true, similarly to the first condition. This is something I would understand as “keeping consistency”.
Evaluating the conditions of your code is not just about getting a nicer flowchart. There are accepted good practices in coding regarding if-statements. Some of them are:
the first conditionals should always check for errors first (a take from experienced colleagues).
Something where flowcharts could be useful is in the evaluation of the if-statements. If after modeling the conditionals of your (planned) code you notice inconsistency in the way you are writing your conditional expressions, it might be that your code requires a bit of refactoring.
CHALLENGE 1: In the flowcharts above the condition evaluating x against y is nested inside the condition evaluating x against z. Let’s say that the nesting is not required, and that x should be evaluated independently against y as well as z. What do you think we could change in the last flowchart for that new logic to apply? (Find an answer at the end of the article)
Loops are conditionals in disguise.
This is something that flowcharts allowed me to understand: loops are syntactic sugar of a conditional expression with a sort of old fashioned GOTO under the hook:
flowchart TD
    A["..."] -.->|"`**(1)** START A LOOP: entering values of initial *repeat* and *stop* (it can be a combination of them)`"| B[/"`input: *repeat*, *stop*`"/]
    B --> C{"`**(2)** Conditional that evaluates *repeat* against *stop*`"}
    C --> |"`**(3)** ENTER THE LOOP: the entering value after evaluating the condition can be FALSE or TRUE (you decide this)`"| D[/"`input: *repeat*`"/]
    D --> |you can use repeat if necessary| E["`**(4)** Do something inside the loop`"]
    E --> |"`**(5)** bottom of the block: update *repeat* value if necessary`"| F[/updated *repeat*/]
    F --> |"`**(6)** evaluate condition again with (new) value of *repeat*`"| C
    C --> |"`**(7)** LEAVE THE LOOP: the value of the evalution changed (if it was FALSE, now it is TRUE, or viceversa)`"| G["somewhere out the loop..."]
(1) For the loop to start, you have to provide a mechanism for it to repeat and to stop. Usually, the repeat is a variable that will change of value at some point of the loop, and stop is a limit value that repeat should reach in order to signal that the loop should end.
(2) The evaluation of the condition should result from boolean comparisons.
(3) What the value of the condition should be in order to execute the inner block depends on how you have stated the conditional expression. It can be true or false.
(4) When inside the block, the procedures inside the inner block will execute. The processes and entering parameters used by the inner block might not change at each repetition, but the values of those parameters could.
(5) At some point of the inner block, usually the end, it could be that the value of the repeat variable will be updated. Depending of the language utilities you have at your disposal, the value of repeat might change automatically. There are loop types though where you have to provide a value-changing mechanism.
(6) After reaching the end of the block the program will go back to the conditional test (this is the GOTO) and evaluate the condition again.
(7) If the loop is not forced to break, it should stop repeating the inside block after asserting that the result of the condition changed into the oppose boolean value (if it was true, now it is false, or viceversa).
When working with flowcharts, that would be the way you will usually draw a loop. There are different loop types and loops are the most targeted control flow statements when it comes to procedures hidden behind syntactic sugar in all languages.
Keep in mind that it is about tracing logic, not literally following the syntax.
What you want to trace is direction and relations of computational abstractions. The start and direction of the events / entities / activities / data / etc and their relations might not literally follow the order of the lines of your code, or being explicitly exposed.
For example, compare this fragment of our example code:
for (let i = 0; i < count; i = i + 1) {
  rows.push(character.repeat(i + 1))
}
with this section of the flowchart:
flowchart TD
    A["..."] --> |start count-controlled for-loop| C{"`Is *i* >= *count*?`"}
    subgraph COUNT_CONTROLLED_LOOP
    C --> |No| D[/"`input: *i*`"/]
    style D fill:#F8D192
    D --> |"`create strings of character of length (*i* + 1)`"| E["character.repeat(i+1)"]
    E --> |"`add newly created string
            at the end of *rows* list`"| F["`rows.push(**new string**)`"]
    F --> |"`bottom of the block: update *i*`"| G[/i = i+1/]
    style G fill:#F8D192
    G --> |evaluate condition| C
    end
    C -.-> |Yes| B["..."]
As you can see, I am adding for myself details that could not be easily spotted in the Javascript code. This is for me one of the benefits of using this kind of tools. It can help you reveal some of the logic hidden under syntactic reductionism. More often than not, being able to reveal that logic for a few cases will have positive repercussions in your understanding of coding in general.
CHALLENGE 2: In the example above there is at least one hidden loop manipulating strings that I didn’t break out. Which one? (Find an answer at the end of the article)
Remember that even expressions can be broken into different steps.
Sometimes you are not understanding a single expression. If that is the case, don’t be scare to use the flowchart to break that expression into pieces if that helps you to understand it better. For example, this line of code:
result = result + row + "\n";
can be modeled with a flowchart like this:
flowchart TD
    A["..."] -.-> J[/"`input: *row* (str) = currentOf(*rows*)`"/]
     --> |"`concatenate *row* string and a endline (\n) to the current value of *result*`"|K["`*result* + *row* + \n`"]
     style J fill:#F8D192
     K --> |"`overwrite *result* with its new concatenation`"|L["`*result* = **concatenation**`"]
     -.-> B["..."]
Practical Tips for Using Flow Diagrams Effectively
Here are some quick tips when using flow diagrams after adding up my own experience and that of others:
Use diagrams only where needed: Use them selectively where they add value. No need to make a flow diagram for all the code or the system.
If you need a diagram, check automatic functionalities first: There are professional applications for coders that would automatically make a flow diagram for you, like this plugin for the Eclipse IDE.
Automatic (incl. AI) tools might not be what you are looking for if you feel like needing more customization or highlighting some specifics of the code, though. If need more customization…
The trick is to keeping them readable: It is not necessarily simplicity, but clarity. Flow diagrams are visualizations, and they will do a better job when following the best practices applicable to other kinds of visualization. If they are not clear they will end defeating the purpose for which they were chosen in the first place. Don’t overdo it.
If they are used for planning, find ways to make them sketchy and disposable, if not easy to modify. This is because they might become quickly outdated after several iterations of your code.
Make them work for you. There exists conventions on how and for what a diagram should be used. Those conventions are not written in stone; you are free to adapt your diagrams to your purpose, especially for explaining code to non-technical clients. That doesn’t mean to ignore the conventions completely. Make a conscious decision based on what you are looking to expose with your diagram, and be clear with your decision.
Start high-level. Using flow diagrams is not about creating a mess (see below). For big projects, start with a broad view before trying to drill into details.
Learn the best practices and explore UML for formal documentation. See how best practices can help you to get the best out the flow diagrams. Useful conventional diagrams when working with technical audiences are class, sequence, or architecture diagrams.
Choose intuitive tools. Whether you prefer pen and paper or software like Lucidchart, pick a tool that makes sense to you. Keep in mind though that there won’t be one perfect solution: just find the one that better suits your preferences.
Better if easily reusable / modifiable. Better tools are those that allow version control and reuse, and that produce results that you can customize. I found those where you can export SVGs the more extensible.
Wrapping Up
Final Thought: Unless you are working with flow-based programming or any other non-code / low-code tool, Flow diagrams won’t replace the hard work required to learn any programming language. But if used correctly, they can help you reveal patterns and hidden operations, as well as stay organized, reduce overwhelm, and ultimately make coding feel more manageable. And this will ultimately improve your coding skills and your state of mind.
So give them a try — you might be surprised at how much they can help.
Answer CHALLENGE 1: If the evaluation of x against y is indepedent of the evaluation of x against z, then the logic should not return x before evaluating both. A possible modification would be:
flowchart TD
    A["..."] -.-> B{"is x > z"}
    B --> |YES|C["Do something with x"]
    C -->  D{"is x >= y?"}
    style D fill:lightblue
    D -->|YES| E["Do something with x"]
    E --> F["return x"]
    B --> |"NO (new flow)"| D
    D --> |NO| F
    B -.-x |This flow must be changed|F
Answer CHALLENGE 2: The loop manipulating strings that I didn’t break down in my diagram was the repeat string method. This method can be modelled as a loop. In fact, in the given example it worked like a nested loop.
Happy coding!
Subscribe to my newsletter
Read articles from Kristofer Koishigawa directly inside your inbox. Subscribe to the newsletter, and don't miss out.
Written by
