Z Order in Delta Lake - Part 1
 Sachin Nandanwar
If you have a strong background with RDBMS and just like me are transitioning over to Delta lake and underlying analytics platforms, you would start to think of similarities between RDBMS and Delta lake. Though they both deal with structured data and are used for processing and analyzing large datasets, most delta lakes offers a distributed approach to processing massive datasets. While RDBMS uses indexes to optimize search queries, delta lakes utilizes partitioning to distribute data across nodes.
On similar lines, I decided to understand the read optimization techniques used in delta lakes. The thumb rule being that you have to perform Z order for faster data retrieval from very very large delta tables and the columns selected for Z order should have high cardinality and high distribution.
Why we need Z Order?
As we all know that indexing of a database is a vital process in order to speed up query evaluation. If you have a strong background working with RDBMS you would be aware of the data structure of B tree that forms the fundamental basis of indexes in RDBMS.
Just a small recap on indexes in RDBMS’s.
Classical approaches in RDBMS use index structures like B or B+ tree having two types of indexes, Clustered and Non clustered. With SQL Server or any RDBMS for that matter, a table can only have one clustered index and have N number of Non Clustered Indexes depending upon the version and edition of SQL Server you are using. The reason for having only one Clustered Index by design is because the data is physically sorted in a clustered index with the actual data located at the leaf level of the index while in Non Clustered index there are pointers at the leaf level to physical location of the data . As data can be physically only be sorted in one way tables in RDBMS allow only one Clustered Index. In short, Clustered Index is data sorted physically on the column that defines the index.
So how what’s the underlying mechanism that’s involved with data retrieval in delta lakes, given that the entire data structure is completely different compared to the B-Tree used in traditional relational databases?
In Delta lakes, faster data retrieval is designed to optimize distributed data processing by leveraging data partitioning and ordering strategies rather than relying on hierarchical tree structures. Unlike B-Trees, which excel in ordered data and emphasis is more on seeking(pointing) of data, delta lake “indexes” are designed to handle distributed and large-scale datasets where the emphasis is more on scanning the data and parallel processing. It acts as an indicator to underlying data files that “might” contain the data that you are looking. The overall emphasis is to minimize the overall scanning of the data files that contains the required data.
To do that it uses a Z order data retrieval algorithm. Though Z-ordering is not a full-fledged B-Tree but serves a similar purpose: it clusters multidimensional data into an efficient linear representation to minimize the resource overhead and reduce I/O while scanning huge amount that involves data filtering across multiple dimensions of data. Microsoft Fabric supports Z-ordering to optimize range-based queries, especially in Delta Lake. It basically provides a linear and serial order for all data points in the multidimensional space.
How is Z Order designed ?
In mathematical terms, the Z-order curve is a space-filling curve that allows multi-dimensional data to be processed in one-dimensional z-ordered space. Its basically a space-filling curve that maps multi-dimensional data to single dimensional values.
This is achieved by assigning a unique index value (known as a Z-value) to each data point based on the coordinates. The Z-value of a data point is the value of its coordinates when x and y are bitwise interleaved. The Z-value is then used to determine the partition in which the data point will be stored.
Z order visits quadrants recursively in order : NW, NE, SW, SE
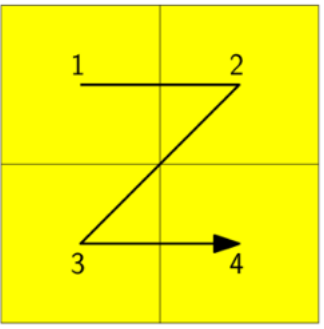
This continues in the NW, NE, SW, SE order
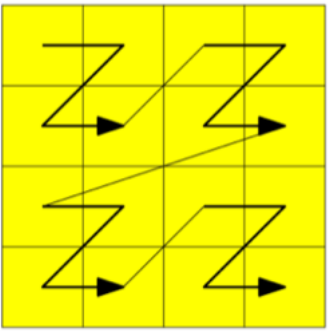
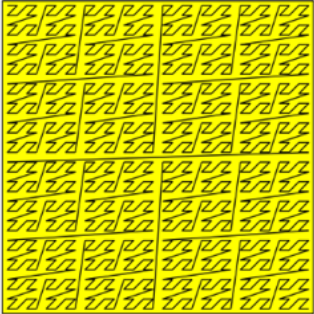
Till it finds all the relevant data across all the files
Lets get into some math behind Z order curve.
Assume that you have two dimensional data with the following four values referenced by p
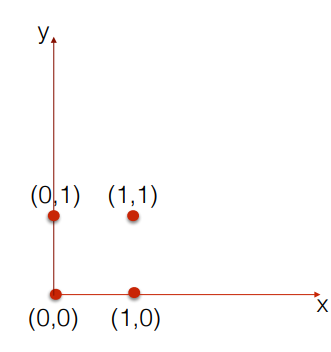
In the above diagram, the Z order curve also called as Morton code will map the two dimensional points into one dimensional value by preserving locality which means the two dimensional points remain close to its equivalent one dimensional value. Now this is achieved by interleaving the bits.
The mathematical equation for Z index can be represented as follows.
$$p = (x_1x_2x_3 \dots x_k, y_1y_2y_3 \dots y_k)\\$$
$$Z\_index : \{0, \dots, 2^k - 1\} \times \{0, \dots, 2^k - 1\} \rightarrow \{0, \dots, 2^{2k} - 1\}$$
$$Z\_index(p) = x_1y_1x_2y_2 \dots x_ky_k$$
where
$$x_1,x_2,x_3...x_k...y_1,y_2,y_3..y_k$$
represent coordinates in binary form at x & y axis respectively
$$Z\index(p)=x_1 y 1 x 2 y_ 2 ...x_ k y_ k $$
and maps the point p to a single value by interleaving the binary digits of x and y.
The term "interleaver" refers to a technique where two or more sequences are interwoven or combined in a specific pattern.
To understand it better, lets compute Z index for the points with value of k bit of 1.
We will first calculate them manually to develop a better understanding of the underlying intuition behind it and then write a python routine to perform the same calculation for k=3 bits for additional data points.
For k=1 bit we will use the following calculator to perform the binary conversion calculations.
https://www.rapidtables.com/convert/number/decimal-to-binary.html
For point (0,0) on the two dimensional space , to calculate the interleaving bits first convert the values to its binary values .For x=0 the equivalent 1 bit binary value is 0 and for y=0 it is 0 and after performing interleaving, the interleaving values are 00 and its equivalent decimal conversion is 0.
Next we perform the same calculations for point (0,1).The binary equivalent for 0 is 0 and for 1 its 1. After interleaving the bits we get a value of 01.The decimal equivalent for 01 is 1.Similarly we get the Z index(p) value for (1,0) and (1,1) to 2 & 3 respectively after performing the conversions and interleaving.
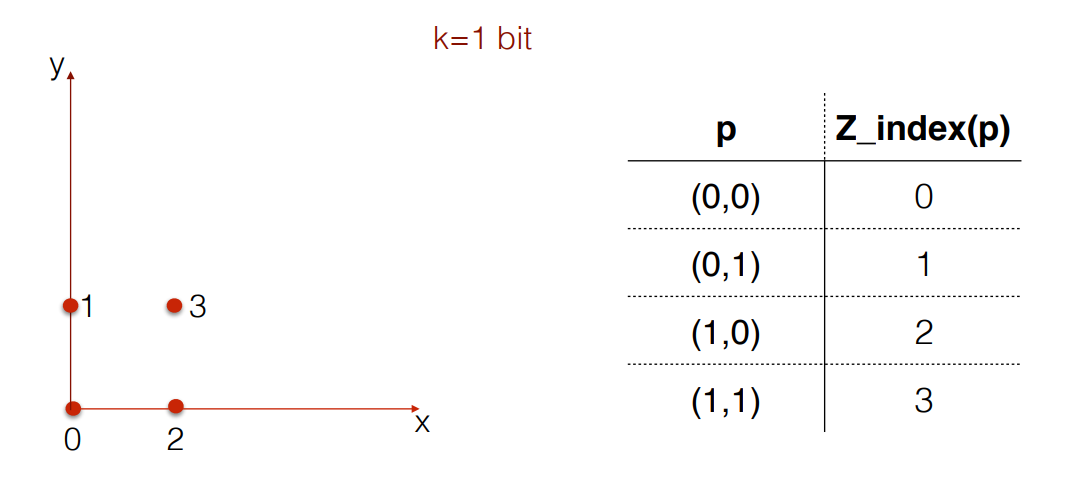
Traversing every Z_index(p) values in a sorted manner results in a Z formation.
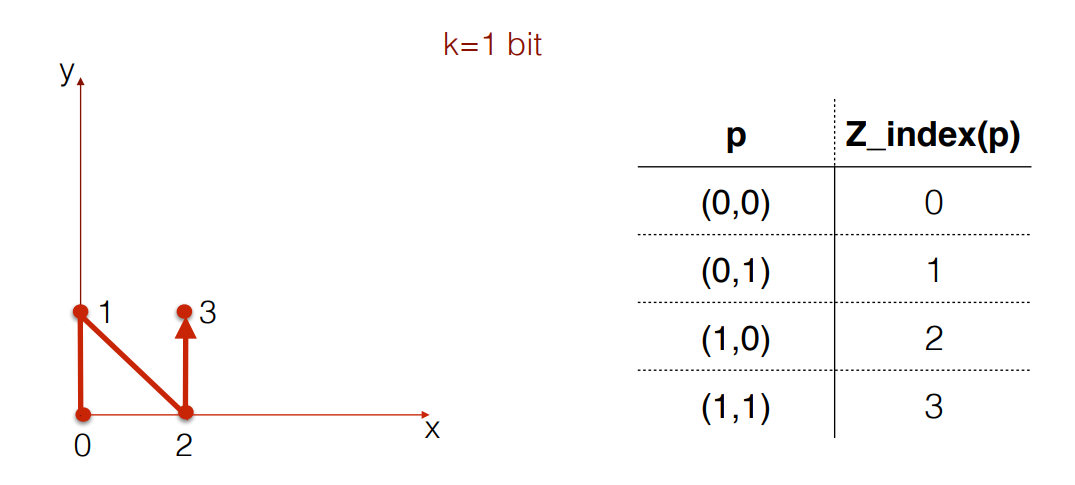
Now that we have looked on how Z curve traverses all points on a two dimensional coordinates lets now extrapolate the same concept to k=3 bit.
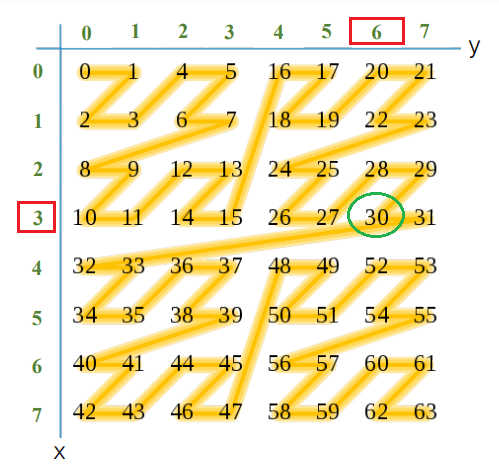
Refer to the following image. In the image, the square of data points in two dimensions can be represented as a grid where the x and y coordinates range from 0 to 7.
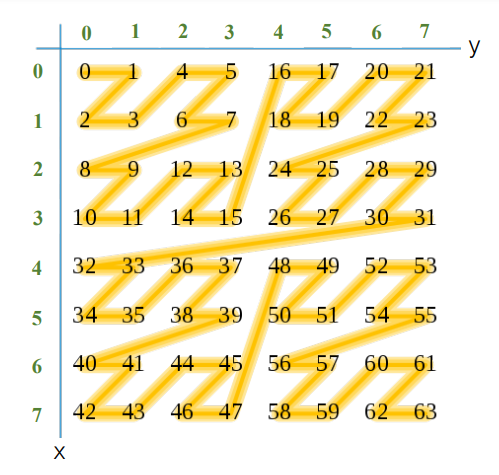
What we have above is two dimensional data with the calculated equivalent Z curve values. The Z-order curve traverses the points in a specific interleaved manner, first in the y-direction and then in the x-direction forming a Z pattern in a sorted manner.
Lets pick up some arbitrary values of x , y and cross check if the calculated Z curve values are indeed correct. Lets check Z curve for x=3 and y=6.
Note we will be performing the conversions for k=3 bits.
According to the image the Z curve calculate value should be 30, marked in green.
The first step would be to calculate the interleaving bits for (x,y).We will do it by writing a simple python routine that performs two operations.
Step 1 : Convert decimal to binary. I picked up this function from
https://www.geeksforgeeks.org/python-program-to-covert-decimal-to-binary-number/
# Function to convert decimal to binary
def DecimalToBinary(num):
    if num > 1:
        return DecimalToBinary(num // 2) + str(num % 2)
    else:
        return str(num)
Step 2 : Interleave the bits.
Reference: https://stackoverflow.com/a/48200012/26868879
# Interleave to combine binary values
def interleave(*iterables):
    result = []
    return [x for x in chain.from_iterable(zip(*iterables)) if x is not None]
Next we write the main routine to call the above functions.
# Driver Code
if __name__ == '__main__':
    # decimal values
    dec_val_x = 3
    dec_val_y = 6

    #Convert decimal to binary
    binary_string_y =DecimalToBinary(dec_val_y)
    binary_string_x =DecimalToBinary(dec_val_x)

    max_len = max(len(binary_string_x), len(binary_string_y))

    #based on length if required add leading 0's
    bin_x = binary_string_x.zfill(max_len)
    bin_y = binary_string_y.zfill(max_len)

    #interleave the bits
    interleaved_result = interleave(bin_x,bin_y)
    result = int(''.join(map(str, interleaved_result)))
    print(result)
I used the following online python code complier to test the python code. https://www.online-python.com.
You can use any other online python compiler like https://python-fiddle.com or https://www.mycompiler.io/new/python
Executing the code above for values of x=3 and y=6 returns a binary value of 11110
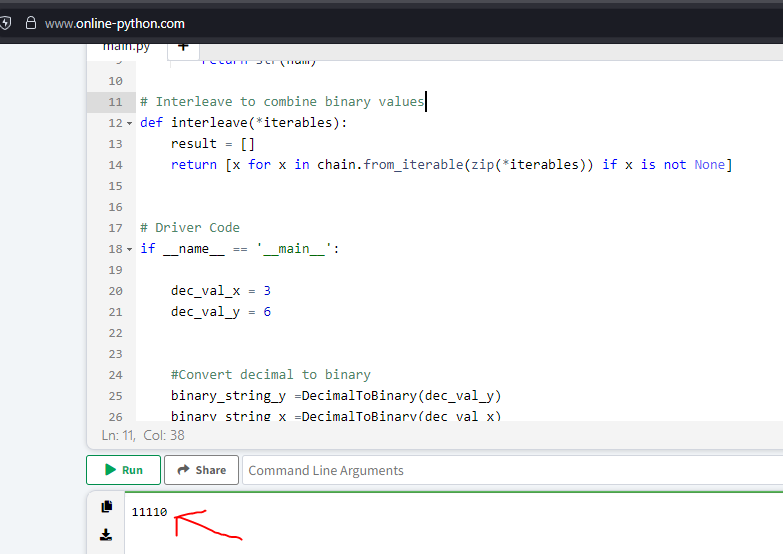
You can use an online tool to convert the above binary value to decimal or just write a simple python code to perform the conversion.
Lets convert it using a python sub routine.
Reference: https://www.geeksforgeeks.org/binary-decimal-vice-versa-python/
def binaryToDecimal(binary):

    decimal, i = 0, 0
    while(binary != 0):
        dec = binary % 10
        decimal = decimal + dec * pow(2, i)
        binary = binary//10
        i += 1
    print(decimal)

# Driver code
if __name__ == '__main__':
   binary = 11110
   binaryToDecimal(binary)
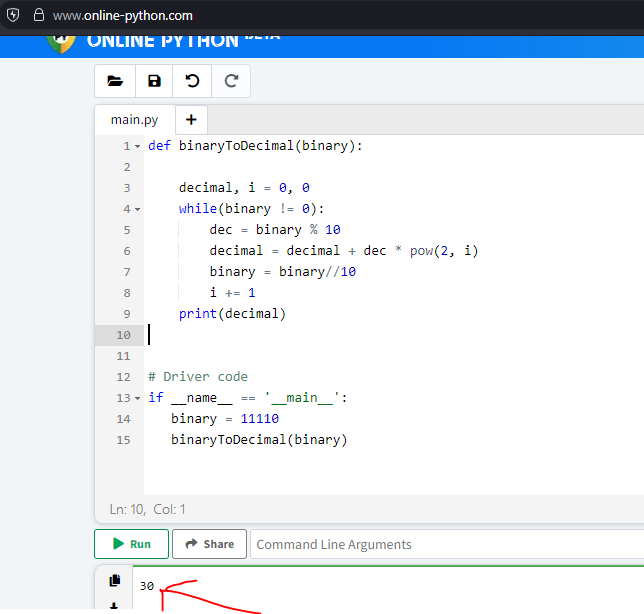
So this confirms that the Z curve value for x=3 and y=6 is 30.
Lets perform one more test.
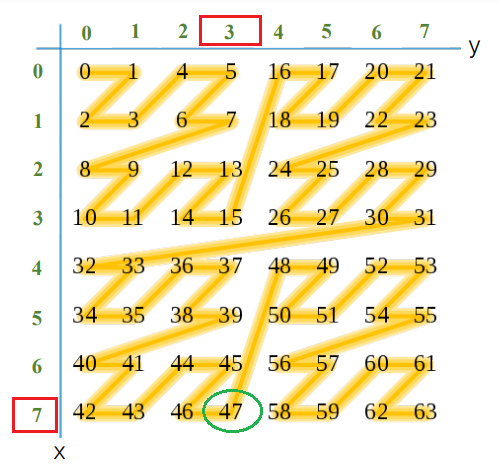
Lets pick x=7 and y=3.According to the image the Z curve value should be 47 marked in green in the image above.
This time lets manually check for k=3 bits.
For y=3

Divide 3 by 2.

Use the integer quotient obtained in this step as the dividend for the next step.
Repeat the process until the quotient becomes 0.

3/2 = 1     >> 1 is reminder (least significant bit)
1/2 = 0  >> 1 is reminder (most significant bit)
So,3 in binary is 11.

But as we are calculating it for k=3 bits we need add a leading 0 as the most
significant bit.The final binary value for 3 is 011.

For x=7

Divide 7 by 2
7/2 = 3 >> 1 is reminder (least significant bit).
3/2 = 1 >>     1 is reminder
1/2 = 0    >> 1 is reminder (most significant bit).

So,7 in binary is 111.

We have binary for y= 3 >> 011 and for x= 7 >> 111

Next step we have to interleave the bits.

After interleaving the bits we get the final binary value 101111.

Converting 101111 to decimal we get the value of 47
Note :
If the MSB(Most Significant Bit) of the binary value of x and y in two dimensional graph is 0** then the Z curve value will always lie in the first quadrant of the two dimensional axis.
If MSB of binary value for y is 1** and x is 0** then Z curve value will lie on the second quadrant.
If MSB of binary value for y is 0** and x is 1** then the Z curve value will lie in the third quadrant.
Finally, if the MSB of binary value for y is 1** and x is 1** then the Z curve value would lie in the last quadrant.
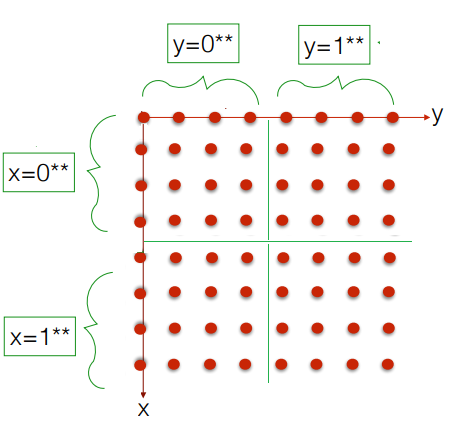
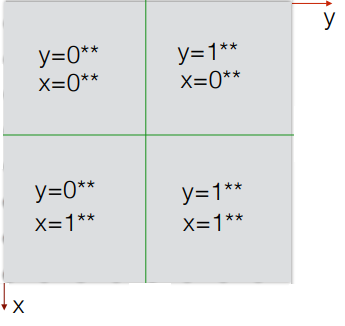
Lets double check if its indeed the case for the two earlier calculations.
For the first example x=3 and y=6,the binary value for x and y are 011 and 110 respectively. Remember that we have added a leading zero to the binary value of x.
So MSB for x is 0** and y is 1**.This means the Z curve order should lie in the second quadrant.
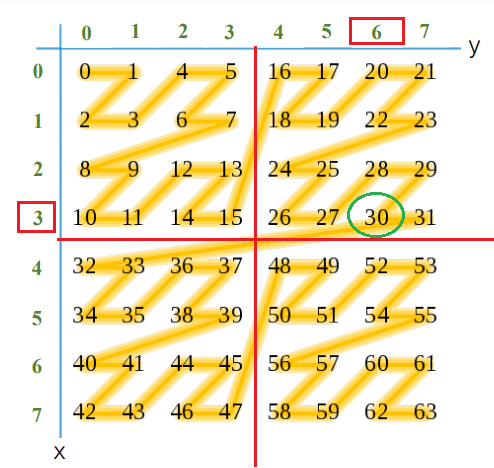
The Z curve value for x=3 and y=6 is 30 and it lies in the second quadrant.
Similarly for second example of y=3 and x=7 the binary values are 011 and 111 and the MSB for x=0** and y=1** which means the Z curve value should lie somewhere in the third quadrant.
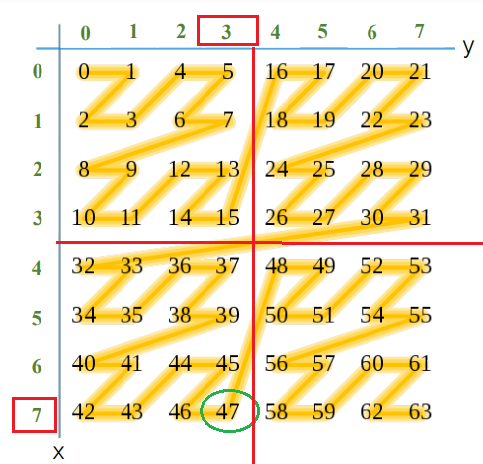
The Z curve value for x=3 and y=7 is 47 and it lies in the third quadrant.
This confirms that we have the correct Z order curve values.
Conclusion
We saw how Z order “organizes” similar data into common clusters and reads the data in a Z pattern by converting the multi dimensional data into its equivalent one dimensional data by using a mechanism called bit “interleaving”.
It provides a linear order for all data points in the multidimensional space. Each multidimensional vector can be converted into a unique integer called Z-address” .Z-order keeps similar types of data in the same file to efficiently skip data files.
In the next article we will see how data is read across the files and how to mitigate the most common issue when it comes to Z order range queries i.e minimize the wasteful query regions due to the properties of the z-order curve.
Stay tuned !!!!
Subscribe to my newsletter
Read articles from Sachin Nandanwar directly inside your inbox. Subscribe to the newsletter, and don't miss out.
Written by
