Implement Metrics and Tracing for a .NET App with Open Telemetry, Jaeger, and Prometheus
 Ankita Lunawat
Below is a step-by-step guide to instrument your .NET application with OpenTelemetry for tracing and metrics, using Jaeger for tracing visualization and Prometheus for metrics collections.
Prerequisites
A .NET application (ASP.NET Core or .NET Console app).
Docker installed (to run Jaeger and Prometheus easily).
Basic familiarity with .NET and containerized environments.
If you don’t have .Net SDK, Docker, Prometheus and Jaeger installed on your system you can install it by using following commands.
Update the package list using the appropriate command for your system.
sudo apt update
Install the .NET SDK on your Ubuntu server.
sudo apt install -y dotnet-sdk-8.0
Install the Docker on your Ubuntu server.
sudo apt install -y docker.io
Start and enable the Docker service.
sudo systemctl start docker
sudo systemctl enable docker
Let's download Prometheus using Docker.
sudo docker pull prom/prometheus
Download Jaeger using Docker with the command to get the Jaeger all-in-one container.
sudo docker pull jaegertracing/all-in-one:latest
Configure OpenTelemetry in Your .NET App
To use a sample .NET application, clone our OpenTelemetry GitHub repository with the following command.
git clone https://github.com/Ankita2295/opentelemetry-prometheus-for-dotnet-app.git
Go to the project directory.
cd opentelemetry-prometheus-for-dotnet-app
1. Instrument the Application with OpenTelemetry
Install OpenTelemetry libraries for tracing and metrics:
In Program.cs (for .NET 6 and above):
nano Program.cs
Add the following content to it.
using System.Globalization;
using System.Diagnostics.Metrics;
using Microsoft.AspNetCore.Mvc;
using OpenTelemetry.Logs;
using OpenTelemetry.Metrics;
using OpenTelemetry.Resources;
using OpenTelemetry.Trace;
using OpenTelemetry.Instrumentation.AspNetCore;
using OpenTelemetry.Instrumentation.Http;
using OpenTelemetry.Exporter;
using Prometheus;

var builder = WebApplication.CreateBuilder(args);

const string serviceName = "roll-dice";


// Add services to the container.
builder.Services.AddControllers();

// Create a custom meter for the API
var meter = new Meter("roll-dice.Metrics", "1.0");


var httpRequestCounter = meter.CreateCounter<long>("http_requests_total", description: "Total number of HTTP requests");


builder.Logging.AddOpenTelemetry(options =>
{
    options
        .SetResourceBuilder(
            ResourceBuilder.CreateDefault()
                .AddService(serviceName))
        .AddConsoleExporter();
});

// Configure OpenTelemetry
builder.Services.AddOpenTelemetry()
    .WithTracing(tracerProviderBuilder =>
    {
        tracerProviderBuilder
            .SetResourceBuilder(ResourceBuilder.CreateDefault().AddService("roll-dice"))
            .AddAspNetCoreInstrumentation() // Tracks incoming HTTP requests
            .AddHttpClientInstrumentation()
            .AddJaegerExporter(jaegerOptions =>
            {
                jaegerOptions.AgentHost = "localhost";  // Update with your Jaeger host if necessary
                jaegerOptions.AgentPort = 6831;         // Default Jaeger agent port
            })
            .AddConsoleExporter(); // Optional: For debugging
    })
    .WithMetrics(meterProviderBuilder =>
    {
        meterProviderBuilder
            .SetResourceBuilder(ResourceBuilder.CreateDefault().AddService("roll-dice"))
            .AddAspNetCoreInstrumentation() // Tracks incoming HTTP request metrics
            .AddHttpClientInstrumentation()
            .AddPrometheusExporter(); // Expose metrics to Prometheus
    });

// Add middleware to count HTTP requests
var app = builder.Build();

// Use the Prometheus middleware to expose the /metrics endpoint.
app.UseRouting();

app.UseHttpMetrics(); // Middleware for collecting HTTP metrics

app.UseEndpoints(endpoints =>
{
    endpoints.MapControllers();
    endpoints.MapMetrics(); // Expose the /metrics endpoint for Prometheus scraping
});
string HandleRollDice([FromServices]ILogger<Program> logger, string? player)
{
    var result = RollDice();

    if (string.IsNullOrEmpty(player))
    {
        logger.LogInformation("Anonymous player is rolling the dice: {result}", result);
    }
    else
    {
        logger.LogInformation("{player} is rolling the dice: {result}", player, result);
    }

    return result.ToString(CultureInfo.InvariantCulture);
}
int RollDice()
{
    return Random.Shared.Next(1, 7);
}
app.MapGet("/rolldice/{player?}", HandleRollDice);
app.Run();
Explanation of the code
1.Imports - These lines bring in the required namespaces for OpenTelemetry, ASP.NET Core, metrics, and Prometheus, offering classes and methods to build the application's telemetry and HTTP features..
2. Service Setup - WebApplication.CreateBuilder(args) initializes the ASP.NET Core application builder. serviceName defines the name of the service, which is used later in telemetry to identify the source of traces and metrics. builder.Services.AddControllers() adds support for controllers to the service container, enabling MVC-style routing.
3.Creating a Custom Meter for Metrics - A custom meter named roll-dice.Metrics is created to track application-specific metrics. The httpRequestCounter monitors the total number of incoming HTTP requests using a custom metric called "http_requests_total".
4.Logging Configuration - This configures OpenTelemetry to manage logging with the service name roll-dice. AddConsoleExporter() sets up console logging to display telemetry data, which is helpful for debugging.
5. OpenTelemetry Tracing Configuration - OpenTelemetry is used for tracing: AddAspNetCoreInstrumentation automatically traces incoming HTTP requests in the application, AddHttpClientInstrumentation traces outgoing HTTP client calls, AddJaegerExporter configures the application to send traces to Jaeger running on the specified host and port, and AddConsoleExporter optionally exports trace data to the console for easier debugging during development.
6. OpenTelemetry Metrics Configuration
Metrics are collected using OpenTelemetry:
AddAspNetCoreInstrumentation: Automatically tracks metrics for incoming HTTP requests, such as latency and request count. *AddHttpClientInstrumentation: Tracks metrics for outgoing HTTP requests made by the application. *AddPrometheusExporter: Exposes metrics on the/metricsendpoint, which can be scraped by Prometheus for monitoring.
7.Building the Application and Configuring Middleware - app.UseRouting() sets up request routing, and app.UseHttpMetrics() integrates Prometheus HTTP metrics, which automatically track details about incoming HTTP requests.
Exposing the
/metricsEndpoint - Maps endpoints for the controllers.MapMetrics()exposes the/metricsendpoint, allowing Prometheus to scrape metric data from the application.Handling the
/rolldiceEndpoint
The HandleRollDice method handles requests to the /rolldice endpoint, rolls a dice using the RollDice() method, and logs the result. If a player name is provided, it logs the name; otherwise, it logs that an anonymous player is rolling the dice.
The RollDice method generates a random number between 1 and 6 to simulate a dice roll.
10. Endpoint Mapping for Roll Dice
Maps the /rolldice/{player?} endpoint to the HandleRollDice method to handle dice roll requests, and app.Run starts the application.
open the MyPrometheusApp.csproj file.
vi MyPrometheusApp.csproj
Add and Update the packages to the latest versions.
Add a <PackageReference Include=”OpenTelemetry.Exporter.Jaeger” Version=”1.5.1″ /> and update “OpenTelemetry.Instrumentation.AspNetCore” Version=”1.7.0″ and “OpenTelemetry.Instrumentation.Http” Version=”1.7.0″
<Project Sdk="Microsoft.NET.Sdk.Web">

  <PropertyGroup>
    <TargetFramework>net8.0</TargetFramework>
    <Nullable>enable</Nullable>
    <ImplicitUsings>enable</ImplicitUsings>
  </PropertyGroup>

  <ItemGroup>
    <PackageReference Include="Microsoft.AspNetCore.OpenApi" Version="8.0.8" />
    <PackageReference Include="OpenTelemetry.Exporter.Console" Version="1.9.0" />
    <PackageReference Include="OpenTelemetry.Exporter.Prometheus.AspNetCore" Version="1.9.0-beta.2" />
    <PackageReference Include="OpenTelemetry.Extensions.Hosting" Version="1.6.0" />
    <PackageReference Include="OpenTelemetry.Instrumentation.AspNetCore" Version="1.9.0" />
    <PackageReference Include="OpenTelemetry.Instrumentation.Http" Version="1.9.0" />
    <PackageReference Include="prometheus-net.AspNetCore" Version="6.0.0" />
    <PackageReference Include="Swashbuckle.AspNetCore" Version="6.4.0" />
    <PackageReference Include="OpenTelemetry.Exporter.Jaeger" Version="1.5.1" />
  </ItemGroup>

</Project>
Explanation of the code:
This project file sets up the .NET web application to leverage modern observability tools and web standards. It defines the project to use the Microsoft.NET.Sdk.Web SDK, which is specifically designed for building web applications using ASP.NET Core, including all the necessary tools and dependencies for web projects.
PropertyGroup Section:
- The project file specifies the .NET version as
.NET 8.0, enables nullable reference types for safer code, and allows automatic inclusion of common using directives to simplify the code.
- The project file specifies the .NET version as
ItemGroup Section: This part lists all the external dependencies (NuGet packages) needed for the project.
Run Prometheus for Metrics Collection
Create a prometheus.yml configuration file:
vi prometheus.yml
Change the targets by providing your EC2 instance's public IP address.
global:
  scrape_interval: 15s

scrape_configs:
  - job_name: 'MyPrometheusApp'
    scrape_interval: 5s
    metrics_path: '/metrics'
    static_configs:
      - targets: ['<EC2-instance-IP>:8080']
Configure OpenTelemetry in Your .NET App
To compile and run your application, use the following commands.
Build the application.
dotnet build
Run the application.
dotnet run
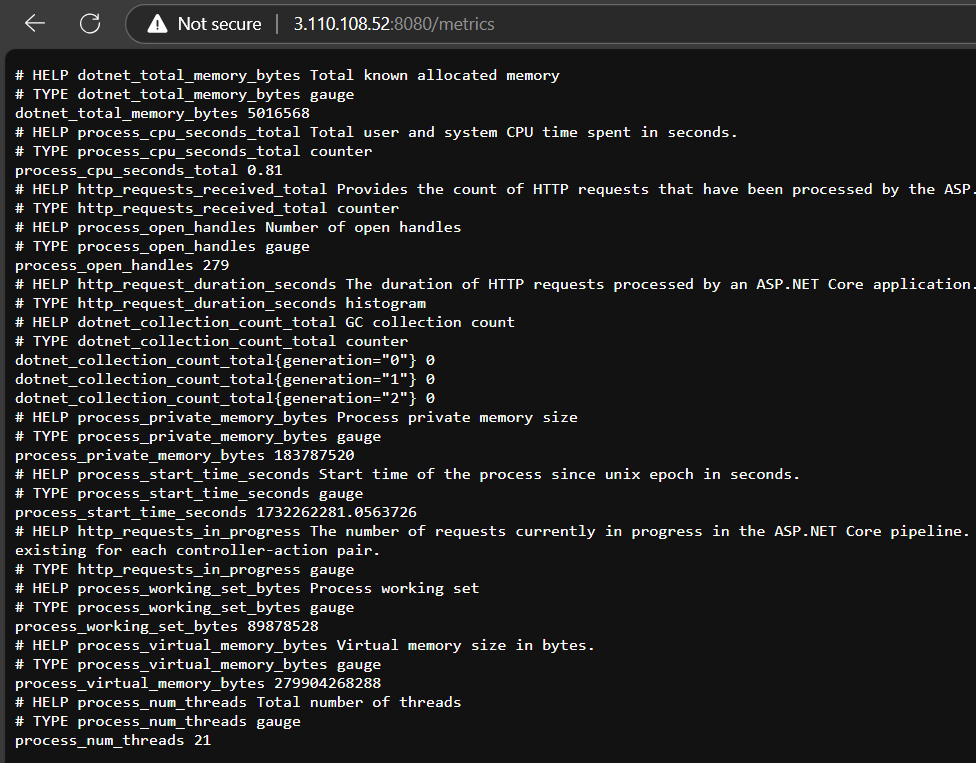
This will start the application and expose the /metrics endpoint for Prometheus to collect data.
You can test your application by visiting the endpoint that provides the HTTP metrics, such as http://<EC2-Instance-IP>:8080/metrics.
http://<EC2-Instance-IP>:8080/metrics
You can run the application rolldice using http://<EC2-Instance-IP>:8080/rolldice, which simulates a dice roll and returns the result.
cd opentelemetry-prometheus-for-dotnet-app
Run the Prometheus container to start collecting metrics.
sudo docker run -p 9090:9090 -v ~/opentelemetry-prometheus-for-dotnet-app/prometheus.yml:/etc/prometheus/prometheus.yml prom/prometheus
Once the container is running, access the Prometheus web interface at http://<EC2-Instance-IP>:9090.
To verify Prometheus is collecting metrics from your .NET application, go to the "Targets" page in the Prometheus UI, click "Status" in the menu, then "Targets," and check that your job MyPrometheusApp is listed and marked as "UP."
Run Jaeger for Tracing
Use Docker to spin up a Jaeger container:
sudo docker run -d --name jaeger \
  -e COLLECTOR_ZIPKIN_HTTP_PORT=9411 \
  -p 5775:5775/udp \
  -p 6831:6831/udp \
  -p 6832:6832/udp \
  -p 5778:5778 \
  -p 16686:16686 \
  -p 14268:14268 \
  -p 14250:14250 \
  -p 9411:9411 \
  jaegertracing/all-in-one
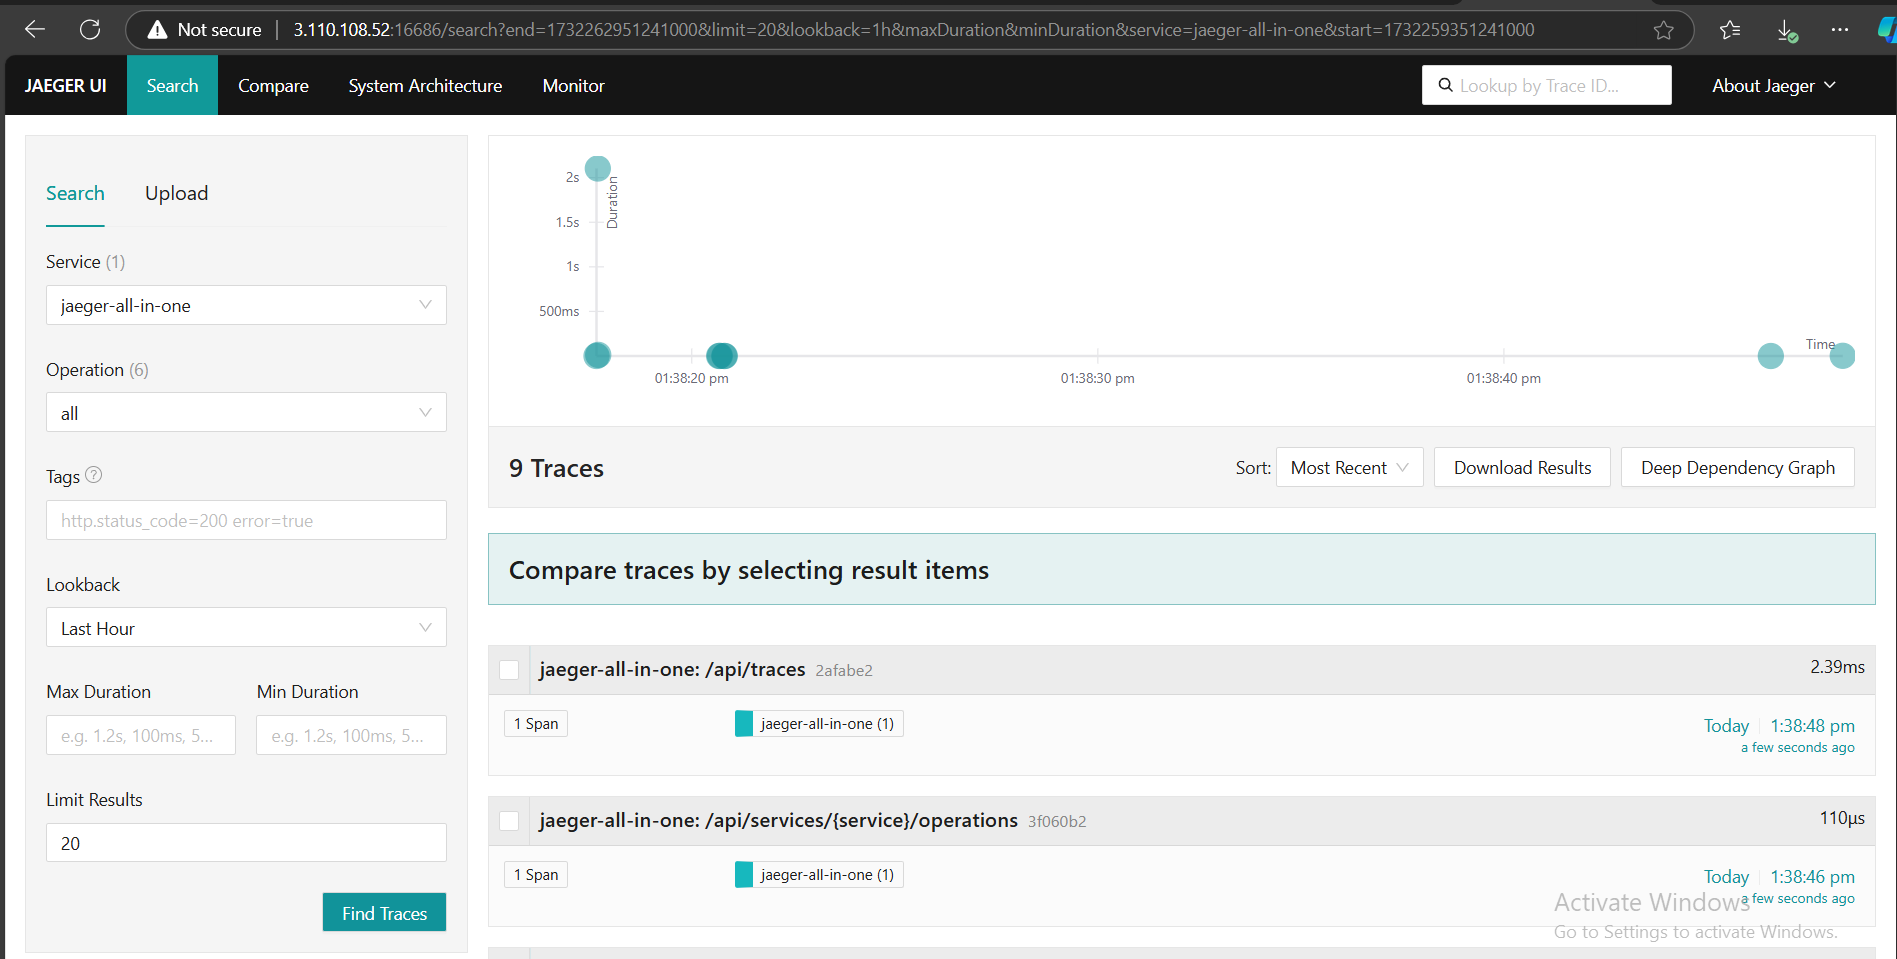
After running the application, open http://<EC2-Instance-IP>:16686 in your browser to access the Jaeger UI and view traces from your .NET application, including traces for incoming HTTP requests and any custom spans.
In the service, choose roll-dice instead of jaeger-all-in-one, select specific operations like all, GET, or GET/rolldice/{player?}, set the Lookback time to 5 minutes, and adjust the Max Duration, Min Duration, and Limit Results for the number of traces you want.


This setup provides a robust observability framework for monitoring and diagnosing .NET applications. Let me know if you'd like to expand any part of the guide!
Subscribe to my newsletter
Read articles from Ankita Lunawat directly inside your inbox. Subscribe to the newsletter, and don't miss out.
Written by

Ankita Lunawat
Ankita Lunawat
Hi there! I'm a passionate AWS DevOps Engineer with 2+ years of experience in building and managing scalable, reliable, and secure cloud infrastructure. I'm excited to share my knowledge and insights through this blog. Here, you'll find articles on: AWS Services: Deep dives into core AWS services like EC2, S3, Lambda, and more. DevOps Practices: Best practices for CI/CD, infrastructure as code, and automation. Security: Tips and tricks for securing your AWS environments. Serverless Computing: Building and deploying serverless applications. Troubleshooting: Common issues and solutions in AWS. I'm always eager to learn and grow, and I hope this blog can be a valuable resource for fellow DevOps enthusiasts. Feel free to connect with me on [LinkedIn/Twitter] or leave a comment below!