Analyzing the PCam Dataset with CNNs and Attention Mechanisms
 Rushil Ravi
INTRODUCTION
In this blog post, we explore the use of Convolutional Neural Networks (CNNs) and enhanced architectures with attention mechanisms for classifying the PatchCamelyon (PCam) dataset, a benchmark for detecting metastatic tissue in histopathological images. Our methodology includes hyperparameter tuning, model design, and integrating attention layers to boost model performance.
We delve into how CNNs and attention-enhanced models improve image classification by focusing on the most relevant regions of input data. Attention mechanisms capture long-range feature interactions and enhance representation capabilities, enabling more accurate and efficient detection of critical features in complex datasets like PCam.
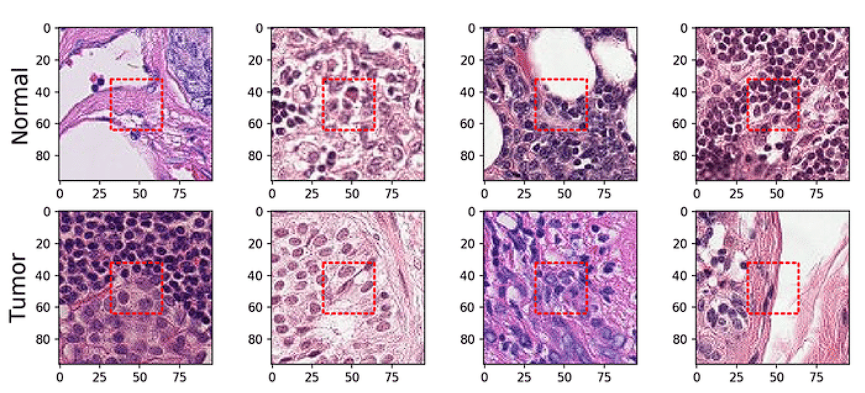
Overview of the Dataset
PatchCamelyon (PCam) is an image classification dataset created to facilitate research in automated cancer detection through machine learning. It consists of 327,680 color images (96x96 pixels), each labeled as either containing or not containing metastatic tissue. The dataset is a collection of images extracted from histopathological scans of lymph node sections. Developed as a part of the Camelyon16 challenge, it is divided into training, validation, and test sets. In terms of size, the dataset is greater than CIFAR-10 but smaller than ImageNet, which allows it to be trained on a single GPU.

The table above shows the number of images in the PCam dataset and their partitioning for training, validation, and testing. It is evident that this is a balanced dataset.
Methodology
To evaluate the effectiveness of attention mechanisms, we implemented and compared two models: a baseline CNN and an enhanced CNN with attention layers. Both models were trained on the PatchCamelyon dataset, a challenging dataset for detecting metastatic tissue in histopathological images.
Exploratory Data Analysis
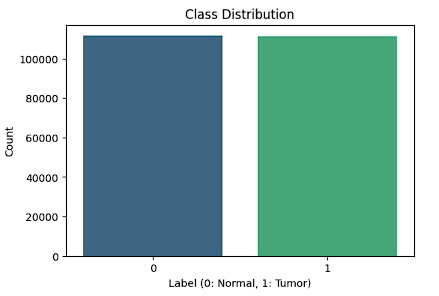
We perform Exploratory Data Analysis (EDA) on the PCAM dataset to explore class distributions and key visual features of the microscopy images. It starts by computing the class distribution (Normal vs Tumor) for training set, ensuring the dataset is balanced.
The bar plot below illustrates the class distribution of the PatchCamelyon (PCAM) dataset. It highlights a balanced representation of the two classes: Normal (Label 0) and Tumor (Label 1). Both classes contain approximately the same number of samples, ensuring that the dataset does not suffer from class imbalance. This balance is critical for developing unbiased machine learning models, as it prevents overfitting toward a dominant class and ensures fair evaluation metrics.
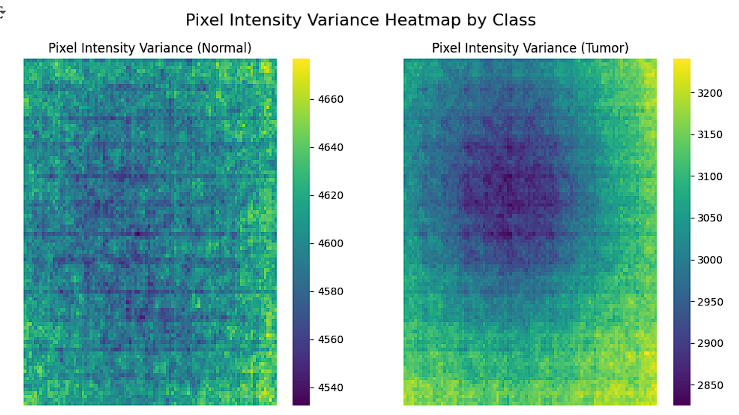
The pixel intensity variance heatmap provides a visual representation of the variability in pixel intensities across all images for both classes, Normal and Tumor. For the Normal class, the variance is more uniform, indicating consistent staining and pixel intensity distribution throughout the images. In contrast, the Tumor class shows a distinct region of lower variance in the center, which could correspond to tumor-specific features or regions of interest. This analysis offers valuable insights into patterns in pixel intensity distribution, helping to identify distinguishing features and guiding the process of feature extraction and class differentiation.
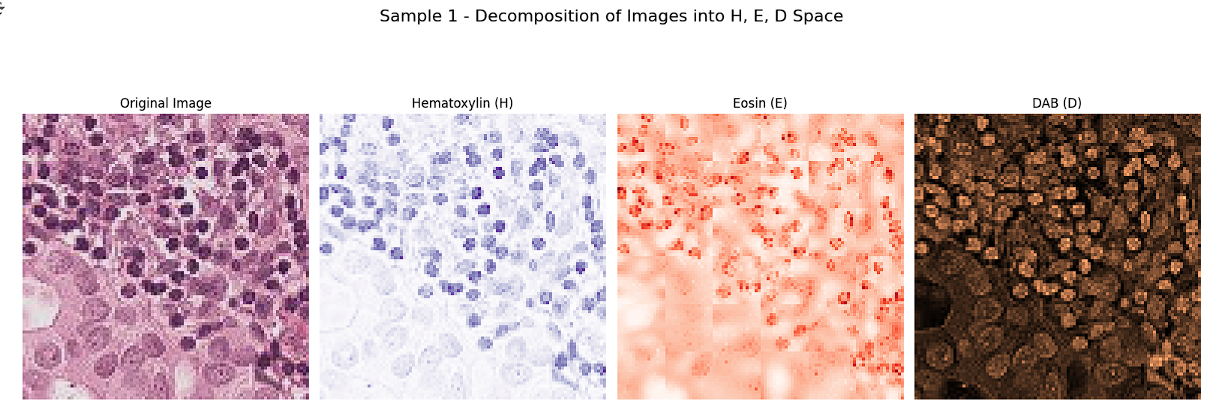
Separating the images into H, E, and D channels provides detailed insights into how the original RGB-stained histopathological images are constructed. These channels correspond to Hematoxylin, which highlights cell nuclei (blue/purple); Eosin, which stains the cytoplasm and extracellular matrix (pink/red); and Diaminobenzidine (DAB), which marks specific antigens (brown). This decomposition allows us to analyze the contribution of each stain to the overall image, facilitating the identification and verification of features associated with each channel. Visualization of these channels reveals distinct patterns, enabling precise feature extraction and supporting preprocessing steps such as stain normalization, which are crucial for improving the accuracy of classification tasks.
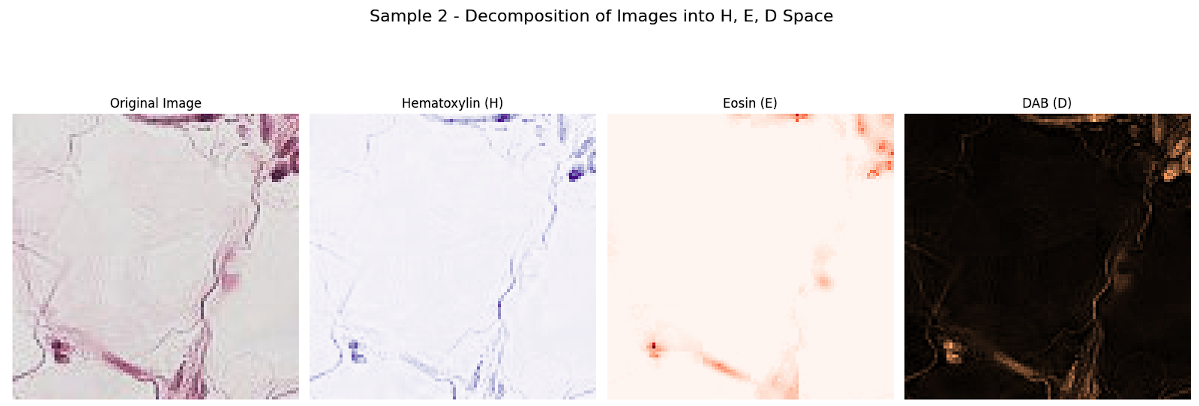
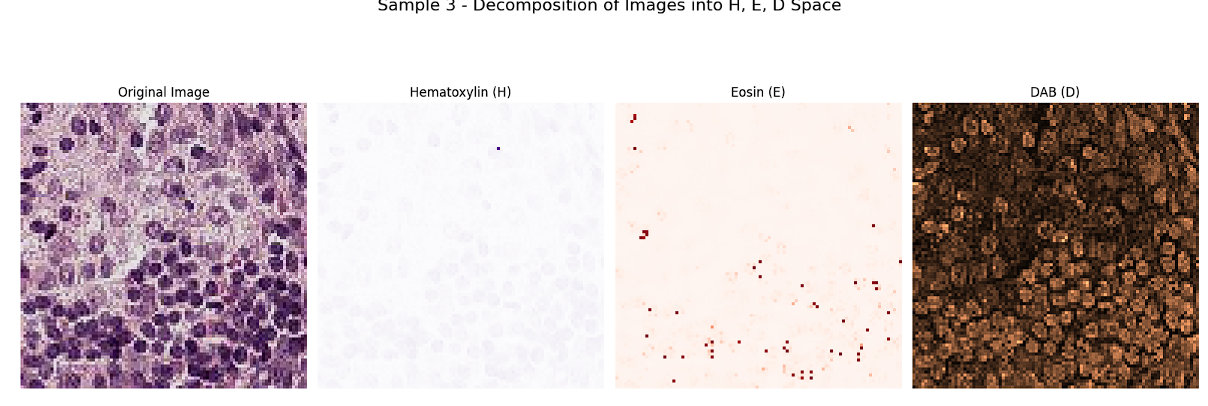
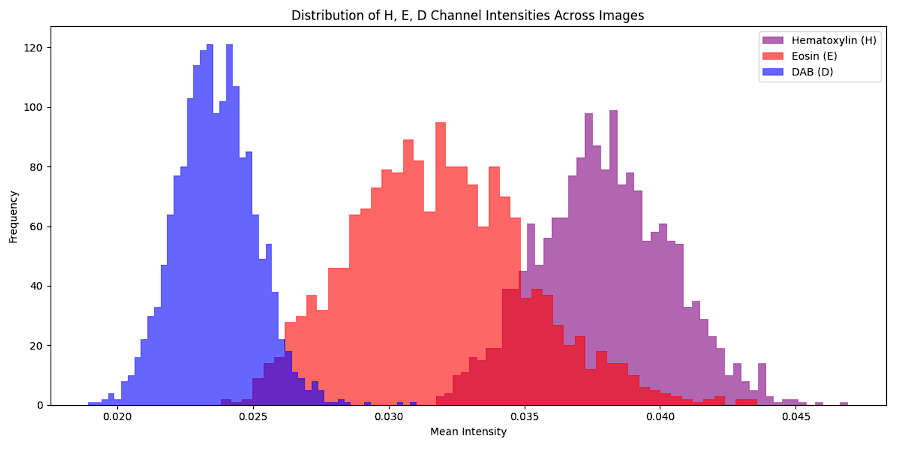
We analyze the intensity distribution of the Hematoxylin (H), Eosin (E), and DAB (D) channels in histopathological images by converting the RGB images into HED color space. It computes the mean intensity of each channel for all images in the dataset and visualizes their distributions using histograms. This analysis provides insights into how each stain contributes to the overall image composition. The Hematoxylin channel highlights nuclear regions with consistent intensity, the Eosin channel captures cytoplasmic and extracellular matrix staining with slightly more variability, and the DAB channel reflects specific antigenic regions with a compact distribution. These distinct patterns help identify features critical for classification and guide preprocessing tasks such as stain normalization.
Model Design
To enhance the detection of metastatic tissue, we developed a Convolutional Neural Network (CNN) integrated with attention mechanisms. The architecture comprises convolutional blocks for feature extraction, attention layers to focus on critical features, and fully connected layers for classification. This design enables the model to dynamically prioritize regions associated with metastasis.
Convolutional Layers
The model includes four convolutional blocks, each consisting of:
Conv2D Layers: Sequential layers with 64, 128, 128, and 256 filters, utilizing 3x3 kernels with ReLU activation to capture spatial features.
MaxPooling2D Layers: 2x2 max-pooling operations to down sample feature maps, reducing computational load while preserving essential information.
Dropout Layers: Applied after each convolutional block with rates of 0.3, 0.2, 0.3, and 0.5, respectively, to mitigate overfitting.
This configuration effectively captures both low-level and high-level patterns from the input images.
Attention Mechanism
Post feature extraction, attention mechanisms are employed to enhance focus on pertinent regions:
Attention Block: Implements scaled dot-product attention by transforming input features into query, key, and value representations.
Scaled Dot-Product Attention: Computes similarity between queries and keys to generate attention scores, which are scaled and normalized to obtain attention weights.
Weighted Sum: Applies attention weights to value representations, emphasizing significant regions in the feature map.
Integrating attention mechanisms allows the model to dynamically highlight areas critical for accurate classification of metastatic tissue.
Results and Discussion:
The baseline CNN model was trained for 20 epochs, with approximately 8 million parameters, requiring over 6 hours of training due to the large dataset size. In contrast, the improved CNN with Attention layers was trained for 15 epochs, significantly reducing the model size to 600–700 thousand parameters, and completing training in approximately 5 hours.
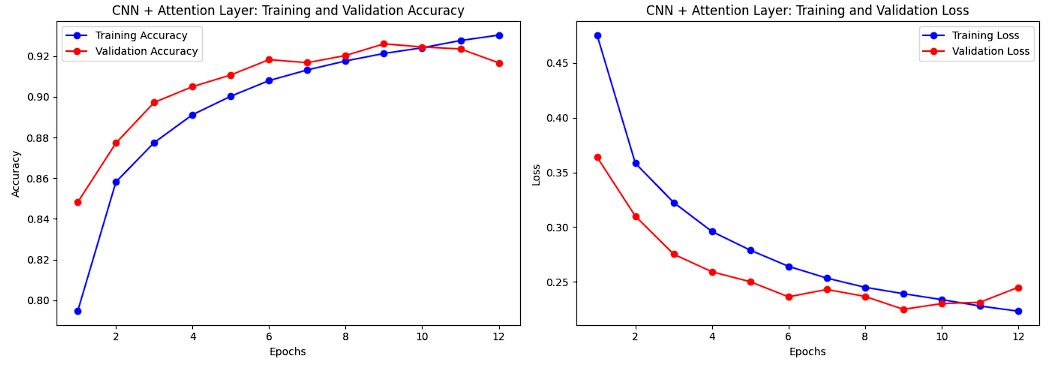
The comparative performance of both models is depicted through their training and validation accuracy and loss curves, as shown in the plots below. These results highlight the advantages of integrating attention layers in improving both computational efficiency and model performance.
Training and Validation Accuracy and Loss Plot for Baseline CNN:
The training and validation accuracy curve for the baseline CNN shows steady improvement over 20 epochs, with training accuracy increasing rapidly and validation accuracy gradually plateauing around the 15th epoch. This indicates effective learning on the training set but highlights slight overfitting as the gap between the two curves grows. Similarly, the loss curves reveal a consistent decrease in training loss, while validation loss stabilizes earlier, reflecting diminishing returns in validation performance. The divergence between the curves suggests that while the model learns well, its generalization capability is limited by overfitting.
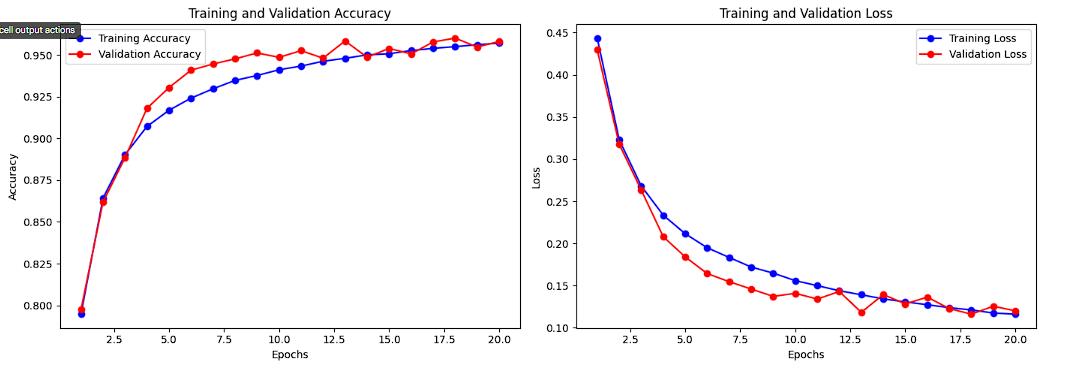
Training and Validation Accuracy and Loss for CNN + Attention Layer:
The accuracy curves for the improved CNN with an attention layer demonstrate faster convergence for both training and validation datasets compared to the baseline model, with validation accuracy plateauing sooner at higher values. This reflects the effectiveness of the attention mechanism in extracting meaningful features and preventing overfitting. The loss curves show that validation loss flattens earlier and remains consistently lower than the baseline model, supported by the use of regularization techniques like dropout and L2 regularization. These trends highlight the model's improved generalization and robustness.
Comparison of Performance Metrics for Baseline CNN and CNN with Attention Layer

The table highlights the performance improvement of the CNN with an attention layer over the baseline model. The improved CNN achieves higher accuracy (83.1% vs. 78.6%) and F1 score (80.8% vs. 73.6%), reflecting better overall performance. While both models show high precision, the attention-enhanced CNN significantly improves recall (70.9% vs. 59.8%), reducing false negatives. This demonstrates the attention layer's ability to focus on important features, making it more effective for tasks like medical imaging.
Conclusion
This project provided valuable insights into the PatchCamelyon (PCAM) dataset, revealing distinct patterns in class distributions, brightness, and channel-specific intensities (Hematoxylin, Eosin, DAB). The balanced dataset ensured unbiased analysis, while the decomposition into HED channels highlighted unique features like consistent nuclear staining (H) and antigenic regions (D). These patterns underscore the importance of preprocessing steps such as stain normalization and brightness adjustments, which can improve classification performance. Additionally, brightness and intensity variations between Normal and Tumor classes demonstrated their potential as discriminative features for machine learning models.
The improved CNN with Attention layers demonstrated better performance than the baseline CNN, achieving higher accuracy, F1 score, and recall, while being more computationally efficient. The attention mechanism enhanced the model’s ability to focus on critical features, making it particularly effective for complex tasks like medical imaging.
Future work could involve leveraging these findings for advanced classification tasks by employing deep learning models like CNNs, supported by stain normalization and augmentation techniques to enhance robustness. Transfer learning and explain ability tools like SHAP or Grad-CAM could further aid in model interpretability and performance evaluation, bridging the gap between AI predictions and medical domain knowledge.
References:
[1] Veeling, B. S., Linmans, J., Winkens, J., Cohen, T., Welling, M. (2018). PatchCamelyon: A benchmark for computational pathology. https://github.com/basveeling/pcam
[2] Vaswani, A., Shazeer, N., Parmar, N., et al. (2017). Attention Is All You Need. NeurIPS. https://arxiv.org/abs/1706.03762
[3] Chollet, F. (2017). Xception: Deep Learning with Depth wise Separable Convolutions. CVPR.
[4] X. Wang, I. Ahmad, D. Javeed, M. E. Ghoneim, S. A. Zaidi, F. M. Alotaibi, Y. I. Daradkeh, J. Asghar, and E. T. Eldin, "Intelligent Hybrid Deep Learning Model for Breast Cancer Detection," Cancers, vol. 12, no. 7, pp. 1932–1945, Jul. 2020, MDPI, doi: 10.3390/cancers12071932.
[5] K. S. Gill, R. Chauhan, N. Yamsani, R. Gupta, H. Alshahrani, A. Sulaiman, M. S. Al Reshan, and A. Shaikh, "Advancements in Histopathologic Cancer Detection: A Deep Learning Odyssey," in Interdisciplinary Conference on Electrics and Computer (INTCEC), Chicago, USA, 2024, pp. 1–8, IEEE, doi: 10.1109/INTCEC61833.2024.10603337.
[6] C. Rane, R. Mehrotra, S. Bhattacharyya, M. Sharma, and M. Bhattacharya, "A Novel Attention Fusion Network-Based Framework to Ensemble the Predictions of CNNs for Lymph Node Metastasis Detection," The Journal of Supercomputing, vol. 77, no. 9, pp. 4201–4220, Sep. 2020, Springer, doi: 10.1007/s11227-020-03432-6.
[7] Using convolutional neural networks for the classification of breast cancer images - Scientific Figure on ResearchGate. Available from: https://www.researchgate.net/figure/Normal-and-tumor-example-images-from-the-PCam-data-set-The-red-rectangle-corresponds-to_fig1_354268900 [accessed 22 Nov 2024]
Code and Project Repository
The complete project, including python notebooks, dataset links, and trained model files, is hosted on GitHub. Feel free to explore, modify, and use it for further experimentation.
➡️ Access the GitHub Repository Here : https://github.com/SubhikshaSaravanan/PCam-CNNs-Attention-Analysis
Subscribe to my newsletter
Read articles from Rushil Ravi directly inside your inbox. Subscribe to the newsletter, and don't miss out.
Written by
