Curious case of context transition in DAX
 Sachin Nandanwar

Its been a quite some time that I haven’t blogged on Power BI DAX. So finally decided to pen down a very important and one of the most misunderstood concept in Power BI DAX called Context Transition.
When it comes to row evaluation in Power BI DAX, there are very two important concepts called Row and Filter Context. A thorough understanding of these two concepts immensely helps in designing powerful and scalable DAX queries.
In this article, I won't be discussing or delving into the details of Row and Filter Context. If you're already familiar with these concepts, only then continuing to read this article would be beneficial to understand the context transition mechanism.
Classification of Functions in Row and Filter Contexts
By default, some DAX functions operate under a row context, while others operate within a filter context.
For example ADDCOLUMNS operate under row context while SUMMARIZECOLUMNS under filter context. Calculated columns inherently use row context while functions like CALCULATE and CALCULATETABLE use filter context.
Aggregate functions like SUM,AVG,MIN,MAX get evaluated under filter context while iterative functions like SUMX,AVGX,MINX,MAXX execute under row context so do all operators like Addition,Division,Multiplication etc etc.
You can find the complete list here : https://dax.guide

Context Transition Definition
A concise definition of context transition in a single sentence can be:
Context transition is a process through which DAX transforms an active row context into a corresponding filter context when evaluating a measure.
So , what does this mean ?
It means that if a row is executing under a row context, using expressions/functions that support filter context you can change the context of the current row from row context to filter context i.e transition the current context from row to column.
For example, a row context is “transitioned” into a filter context when an expression is wrapped in a CALCULATE function. This enables the calculations to consider current row’s values as filters.
Now there are some functions that support context transition when used with row context. CALCULATE and CALCULATETABLE and Time-Intelligence Functions support context transition.
You can find the complete list here : https://dax.guide
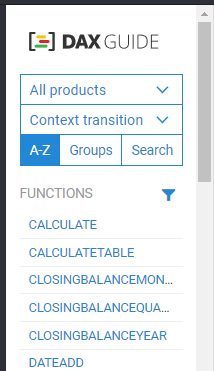
I will use the CALCULATE function to demonstrate context transition in this article.
CALCULATE function
As mentioned earlier, a CALCULATE function always runs under a filter context and can be used to transition from a row context to a filter context.
Before we move to on how CALCULATE performs a context transition lets do a quick recap of the CALCULATE syntax and its evaluation.
CALCULATE(<expression>, <filter1>, <filter2>, ...)
<expression>: The expression to be evaluated. It can be any aggregate function or any other measures<filter1>, <filter2>, ...: The filter expression/s applied to the current filter context.
It is important to understand the types of filters that affect CALCULATE functions.
There are two types of filters, called Implicit and Explicit filters. I like to call them Internal and External filters.
Explicit filters (External filters) : These are the filters are external which means these filters are applied externally by user interaction(slicer or visual filters) or by default filter configuration(page or report filters)prior to CALCULATE evaluating the row.
Implicit filters (Internal filters) : These are the filters that internal and are part of the CALCULATE function but can be added or modified by Explicit filters (External filters).For example using SELECTEDVALUE you can modify the internal filters.
Evaluation Order of CALCULATE function
On surface, this is a two step process
Initial Evaluation : The expression( example aggregate function) is first evaluated within the context of the current filter context. It means that for a given row if there are any external filters(slicer, page level or visual filters) those are applied and the expression is calculated.
Filter Evaluation : Once the expression is calculated, the internal filter expression gets involved and the
CALCULATEfunction “applies” them.
Lets take a very simple example of a Sales table that has three basic columns
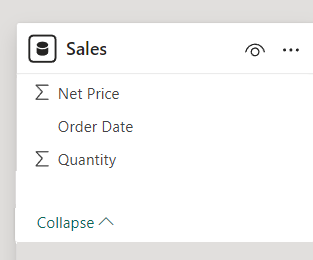
Here is a snapshot of the existing data
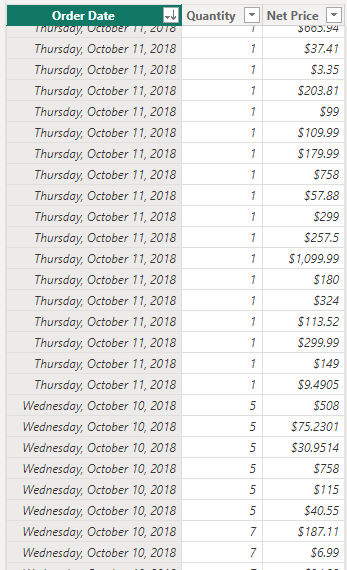
The table contains data for Quantity sold for each date with Net price.
I have uploaded the same csv file here.
Now, if I want to fetch Net Price and Dates when the Quantity sold was greater than 5, I can do it through the following DAX query
EVALUATE
SELECTCOLUMNS (
    Sales,
    "SaleDate", Sales[Order Date],
    "Net Price", Sales[Net Price],
    "SoldQuanity>5", CALCULATE ( SUM ( Sales[Quantity] ), Sales[Quantity] > 5 )
)
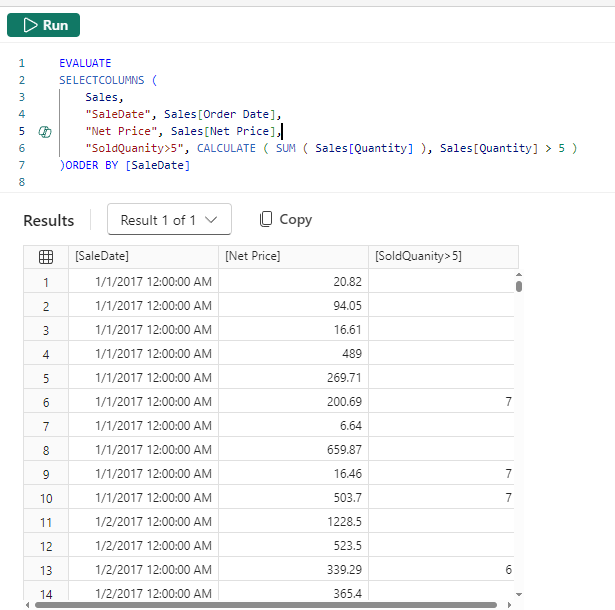
I could modify the DAX query to hide the blank dates post application of the filter Sales[Quantity] > 5
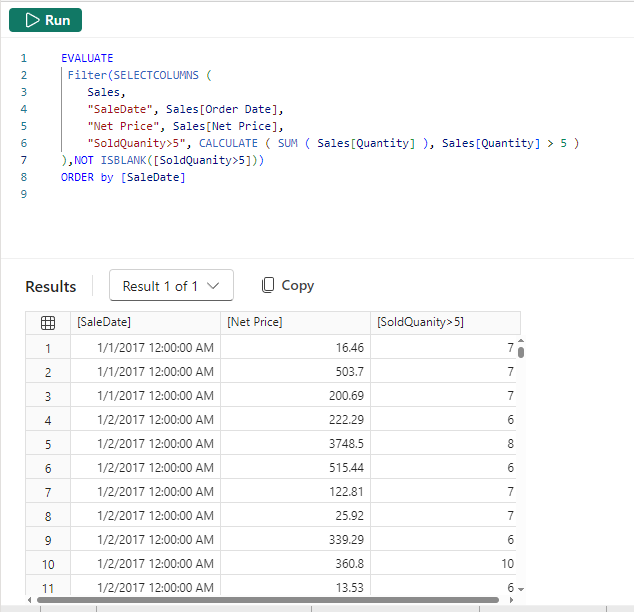
CALCULATE function Step-by-Step Evaluation Process for the above example:
The
SUM(Sales[Quantity])is first evaluated in the current filter context. This might include filters coming from slicers, visual-level filters, or other parts of the model.CALCULATEapplies a filter forSales[Quantity] > 5. This modifies the filter context to only include rows where theSales[Quantity] > 5The
SUM(Sales[Quantity])is then evaluated with the modified filter context (only whereSales[Quantity] > 5)The intermediate result of
SELECTCOLUMNSwould be a combination of Dates where rows that dont have a Quantity >5 returning BLANK values against Quantity and the Quantity values that are >5Finally apply the outer filters to discard dates that have BLANK values for the evaluated column
Sales[Quantity] > 5
Incase I want to fetch the Total Quantity and Individual Quantity for a given date but only consider the Quantity where the sold Quantity >5 with the corresponding Net Sales for those quantities, I can modify the DAX query to this
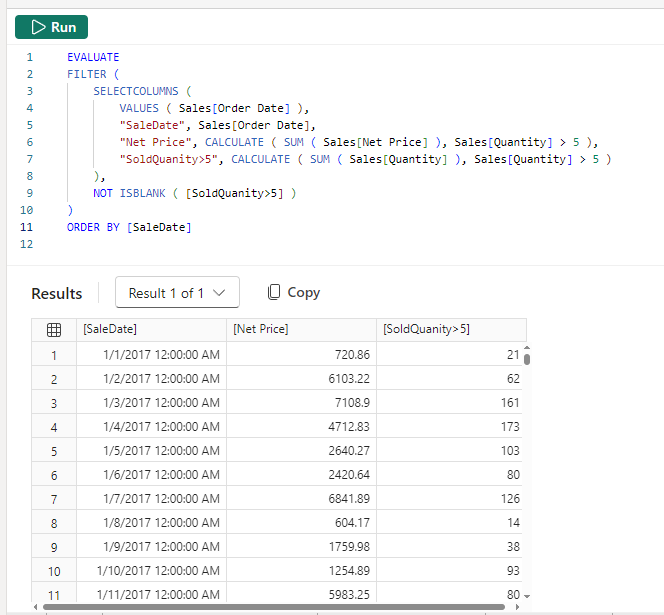
Now that we understand the way CALCULATE evaluates a given expression, lets check how CALCULATE performs context transition.
To test that we would have to create a use case where the CALCULATE function is part of a row context and observe how the CALCULATE function modifies the row context.
Lets assume that formulae of [Total Sales] is a product of Sales[Quantity] * Sales[Net Price]
To calculate the total sales for individual day one might consider simply applying the [Total Sales] formula in the DAX query, which would return the value for[Total Sales].
Lets find out.
EVALUATE
SELECTCOLUMNS (
    Sales,
    "SaleDate", Sales[Order Date],
    "Quantity", Sales[Quantity],
    "Net Price", Sales[Net Price],
    "Total Sales",SUMX(Sales,Sales[Quantity] * Sales[Net Price])
)ORDER BY [SaleDate]
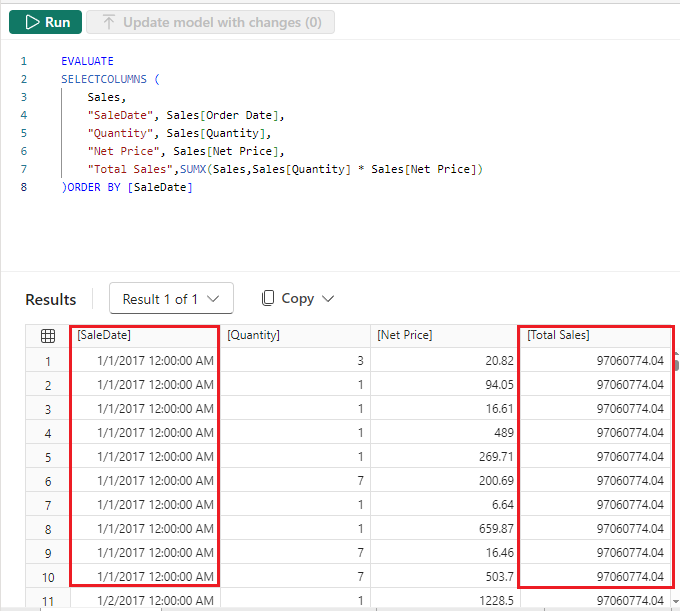
Well, what just happened here ? Those numbers look absolutely absurd.
There is NO WAY that the Total Sales on Jan 1st 2017 is 97+ million and apart from that, the same value i.e 97+ million repeats for ALL the rows in the table.
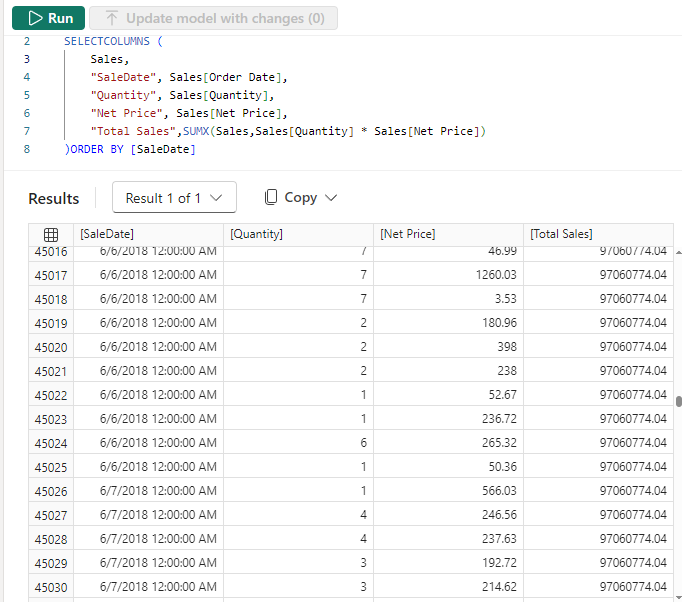
We used a SUMX function. Recall that SUMX is a iterative function and always executes under a row context. So due its inherent behavior SUMX is unaware of the filter that exists across every row.
So, the question now is how to make SUMX "aware" of the filter ? If your answer is “do it by using a filter context”, then you are absolutely CORRECT. But how ?
Just introduce a CALCULATE function that wraps the SUMX function.
EVALUATE
SELECTCOLUMNS (
    Sales,
    "SaleDate", Sales[Order Date],
    "Quantity", Sales[Quantity],
    "Net Price", Sales[Net Price],
    "Total Sales",CALCULATE(SUMX(Sales,Sales[Quantity] * Sales[Net Price]))
)ORDER BY [SaleDate]
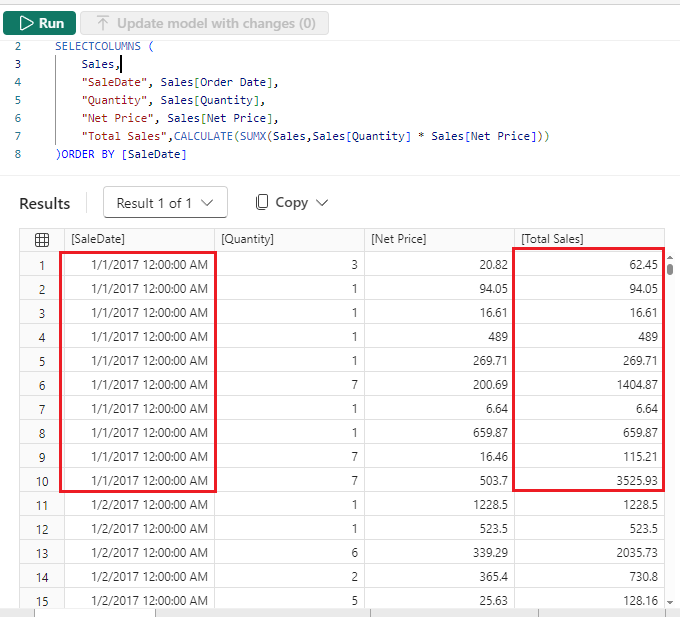
This way we have now successfully “transitioned” the evaluation from row context to a filter context.
Incase you want to get the sum of the Total Sales for each day you can use SUMMARIZE function.
Note : SUMMARIZE function operates in row context.
EVALUATE
SUMMARIZE(SELECTCOLUMNS (
    Sales,
    "SaleDate", Sales[Order Date],
    "Quantity", Sales[Quantity],
    "Net Price", Sales[Net Price]
),[SaleDate],"Total Sales Per Day",CALCULATE(SUMX(Sales,Sales[Quantity] * Sales[Net Price])))
ORDER by [SaleDate]
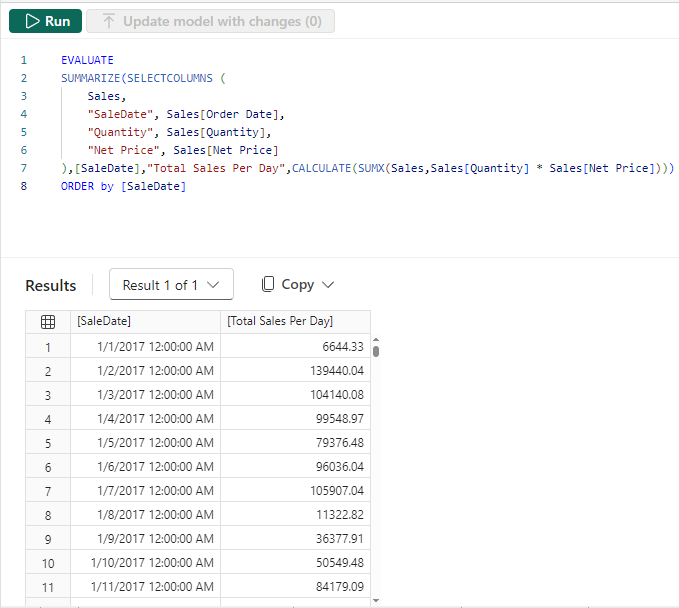
Just to double check if the method that we used to “transition” from row context to filter context is indeed correct, you can use the REMOVEFILTERS function to discard the filter context and we have the result similar to the one we had using only the SUMX function.
EVALUATE
SUMMARIZE(SELECTCOLUMNS (
    Sales,
    "SaleDate", Sales[Order Date],
    "Quantity", Sales[Quantity],
    "Net Price", Sales[Net Price]
),[SaleDate],"Total Sales Per Day",CALCULATE(SUMX(Sales,Sales[Quantity] * Sales[Net Price]),
  REMOVEFILTERS(Sales)))
ORDER by [SaleDate]
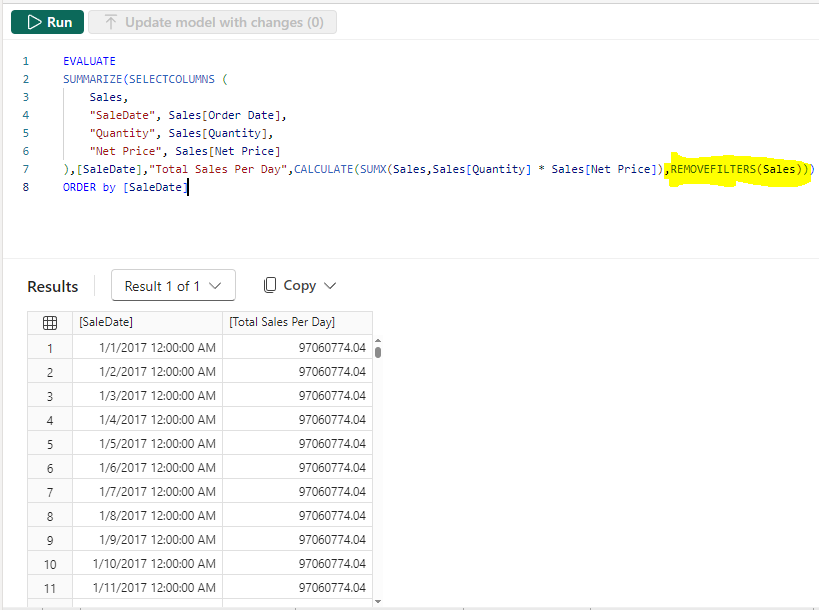
You can also use ALL function instead of REMOVEFILTERS to discard the filter context , but I would prefer using REMOVEFILTERS as it removes “direct” filters applied on columns while ALL removes “direct” as well as “indirect” filters. Indirect filters are the filters created through relationships.
Just incase if you missed the link to the sample file I quoted earlier in the article, here it is.
Conclusion
With this small example I tried to demonstrate the fundamental approach on how context transition operate in Power BI DAX. Context transition occurs when a calculation moves from a row context to a filter context, as we saw when using functions like CALCULATE. It is very important that one understands context transition thoroughly to create accurate and efficient DAX measures, especially when you need to control how filters are applied within a calculation. By mastering context transition you can ensure that your measures produce the intended and error free results.
Thanks for reading !!!
Subscribe to my newsletter
Read articles from Sachin Nandanwar directly inside your inbox. Subscribe to the newsletter, and don't miss out.
Written by
