Understanding Confidence Levels in Statistics and Their Application in Financial Data Analysis
 Opadotun Taiwo Oluwaseun
Confidence levels are a cornerstone of statistical analysis. They provide a measure of certainty regarding the results of a test, enabling analysts to make informed decisions based on data. In this blog, I’ll demystify confidence levels and illustrate how I applied this concept to analyze financial data and determine an optimal failed rate percentage that aligns with achieving a Total Payment Volume (TPV) target in a fintech context.
What is a Confidence Level?
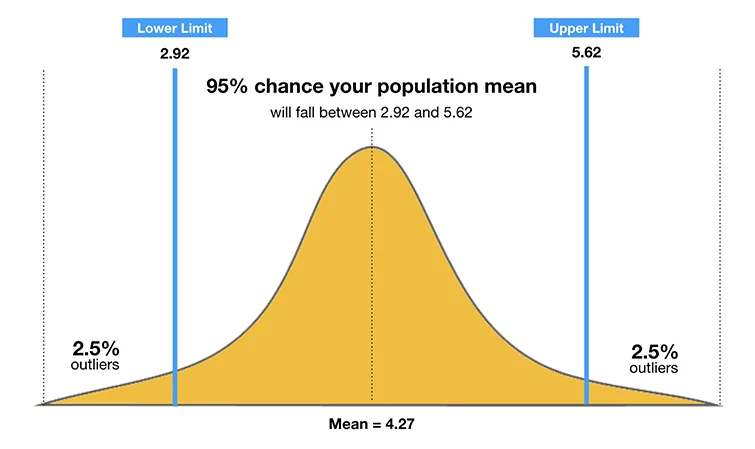
A confidence level in statistics indicates the percentage of times a statistical test would capture the true parameter of a population if repeated multiple times. For example, a 95% confidence level means that if we were to repeat the same test 100 times, 95 of those tests would capture the true value.
Confidence levels are closely tied to confidence intervals, which define the range within which the true value lies. Analysts commonly use confidence levels of 90%, 95%, or 99% to determine the reliability of their insights.
Applying Confidence Levels in Fintech: A Real-World Scenario
Working as a data analyst in the fintech industry, one of my key responsibilities is to evaluate and optimize financial metrics. Recently, I faced a challenge: the TPV target was not being met consistently due to high transaction failure rates. My task was to determine the optimal failure rate that would ensure we meet the TPV target while maintaining a realistic operational framework.
Step-by-Step Approach
1. Problem Framing
The TPV equation is influenced by the transaction success rate and average transaction value. A high failure rate negatively impacts the TPV. My objective was to calculate the maximum acceptable failure rate (“failure threshold”) that would allow us to meet our TPV target.
2. Collecting Data
I started by gathering data on:
Total transaction attempts.
Success and failure rates.
Average transaction value.
Historical TPV data.
3. Formulating Hypotheses
Using a one-sample t-test, I hypothesized:
Null Hypothesis (H0): The failure rate is acceptable and does not significantly impact the TPV.
Alternative Hypothesis (H1): The failure rate exceeds the acceptable threshold, adversely affecting the TPV.
4. Confidence Level and t-Test
I set the confidence level at 95% (α = 0.05), a common standard for financial analysis. The one-sample t-test was chosen to compare the observed failure rates against the hypothesized threshold value.
Calculating the Optimal Failed Rate
Here’s how I approached the problem:
Data Preparation: Using Python, I imported the transaction dataset and calculated the mean failure rate, standard deviation, and sample size.
 import scipy.stats as stats
 import numpy as np

 # Example data
 failure_rates = [0.03, 0.05, 0.04, 0.06, 0.02]  # Sample failure rates
 mean_rate = np.mean(failure_rates)
 std_dev = np.std(failure_rates, ddof=1)
 n = len(failure_rates)

 # T-test
 t_stat, p_value = stats.ttest_1samp(failure_rates, 0.04)  # Hypothesized threshold
 print(f"T-Statistic: {t_stat}, P-Value: {p_value}")
Interpreting Results: The t-test provided a t-statistic and p-value. At a 95% confidence level:
If the p-value < 0.05, we reject H0, indicating that the failure rate significantly impacts the TPV.
If the p-value ≥ 0.05, we fail to reject H0, suggesting that the failure rate is within an acceptable range.
Adjusting Threshold: Based on the analysis, I identified a failure rate of 4% as the tipping point. Any rate beyond this would jeopardize meeting the TPV target.
Insights and Recommendations
By applying confidence levels and t-tests, I determined actionable thresholds for the transaction failure rate. This process highlights the power of statistical analysis in guiding decision-making:
Optimize Processes: Focus on minimizing failure rates through technical improvements, such as better payment gateways and server reliability.
Dynamic Monitoring: Use dashboards to track real-time failure rates and TPV metrics.
Scenario Planning: Continuously test different thresholds to adapt to changes in transaction volume and value.
Why This Matters
Confidence levels and hypothesis testing are not just academic concepts; they are practical tools for solving real-world problems. By understanding and applying these techniques, analysts can uncover insights that drive impactful decisions. For fintech professionals, this means optimizing financial metrics, enhancing customer satisfaction, and achieving business goals.
Conclusion
Confidence levels empower analysts to make decisions with measurable certainty. My experience applying t-tests to determine optimal failure rates in TPV analysis demonstrates how statistical methods can lead to tangible business improvements. I encourage fellow analysts to explore these tools and apply them to their unique challenges you might be surprised at the clarity and direction they provide.
Subscribe to my newsletter
Read articles from Opadotun Taiwo Oluwaseun directly inside your inbox. Subscribe to the newsletter, and don't miss out.
Written by
