How I generated Heatmaps 100x faster
 Panth Patel
My company spent a bunch of months building the backend for Heatmap. Here's how it went down: we used the IDW algorithm with wind speed and direction to figure out the value for each spot.
We set up a heatmap config in our database.
A cron job ran every hour.
We grabbed all the configs.
For each config, we had boundaries, known devices, limits, and color codes.
We pre-computed a grid of small 1km x 1km boxes and stored it in the CDN.
We used the center of each box in the pre-computed grid as the unknown value.
We knew each gas parameter for all devices, plus real-time geolocation, wind speeds, and directions.
Using IDW with wind effects, we calculated the value for each box in the grid.
Colors were added to the grid based on user-defined limits.
A Base64 PNG image was created and stored in a time-series database.
This image was served to the frontend when requested.
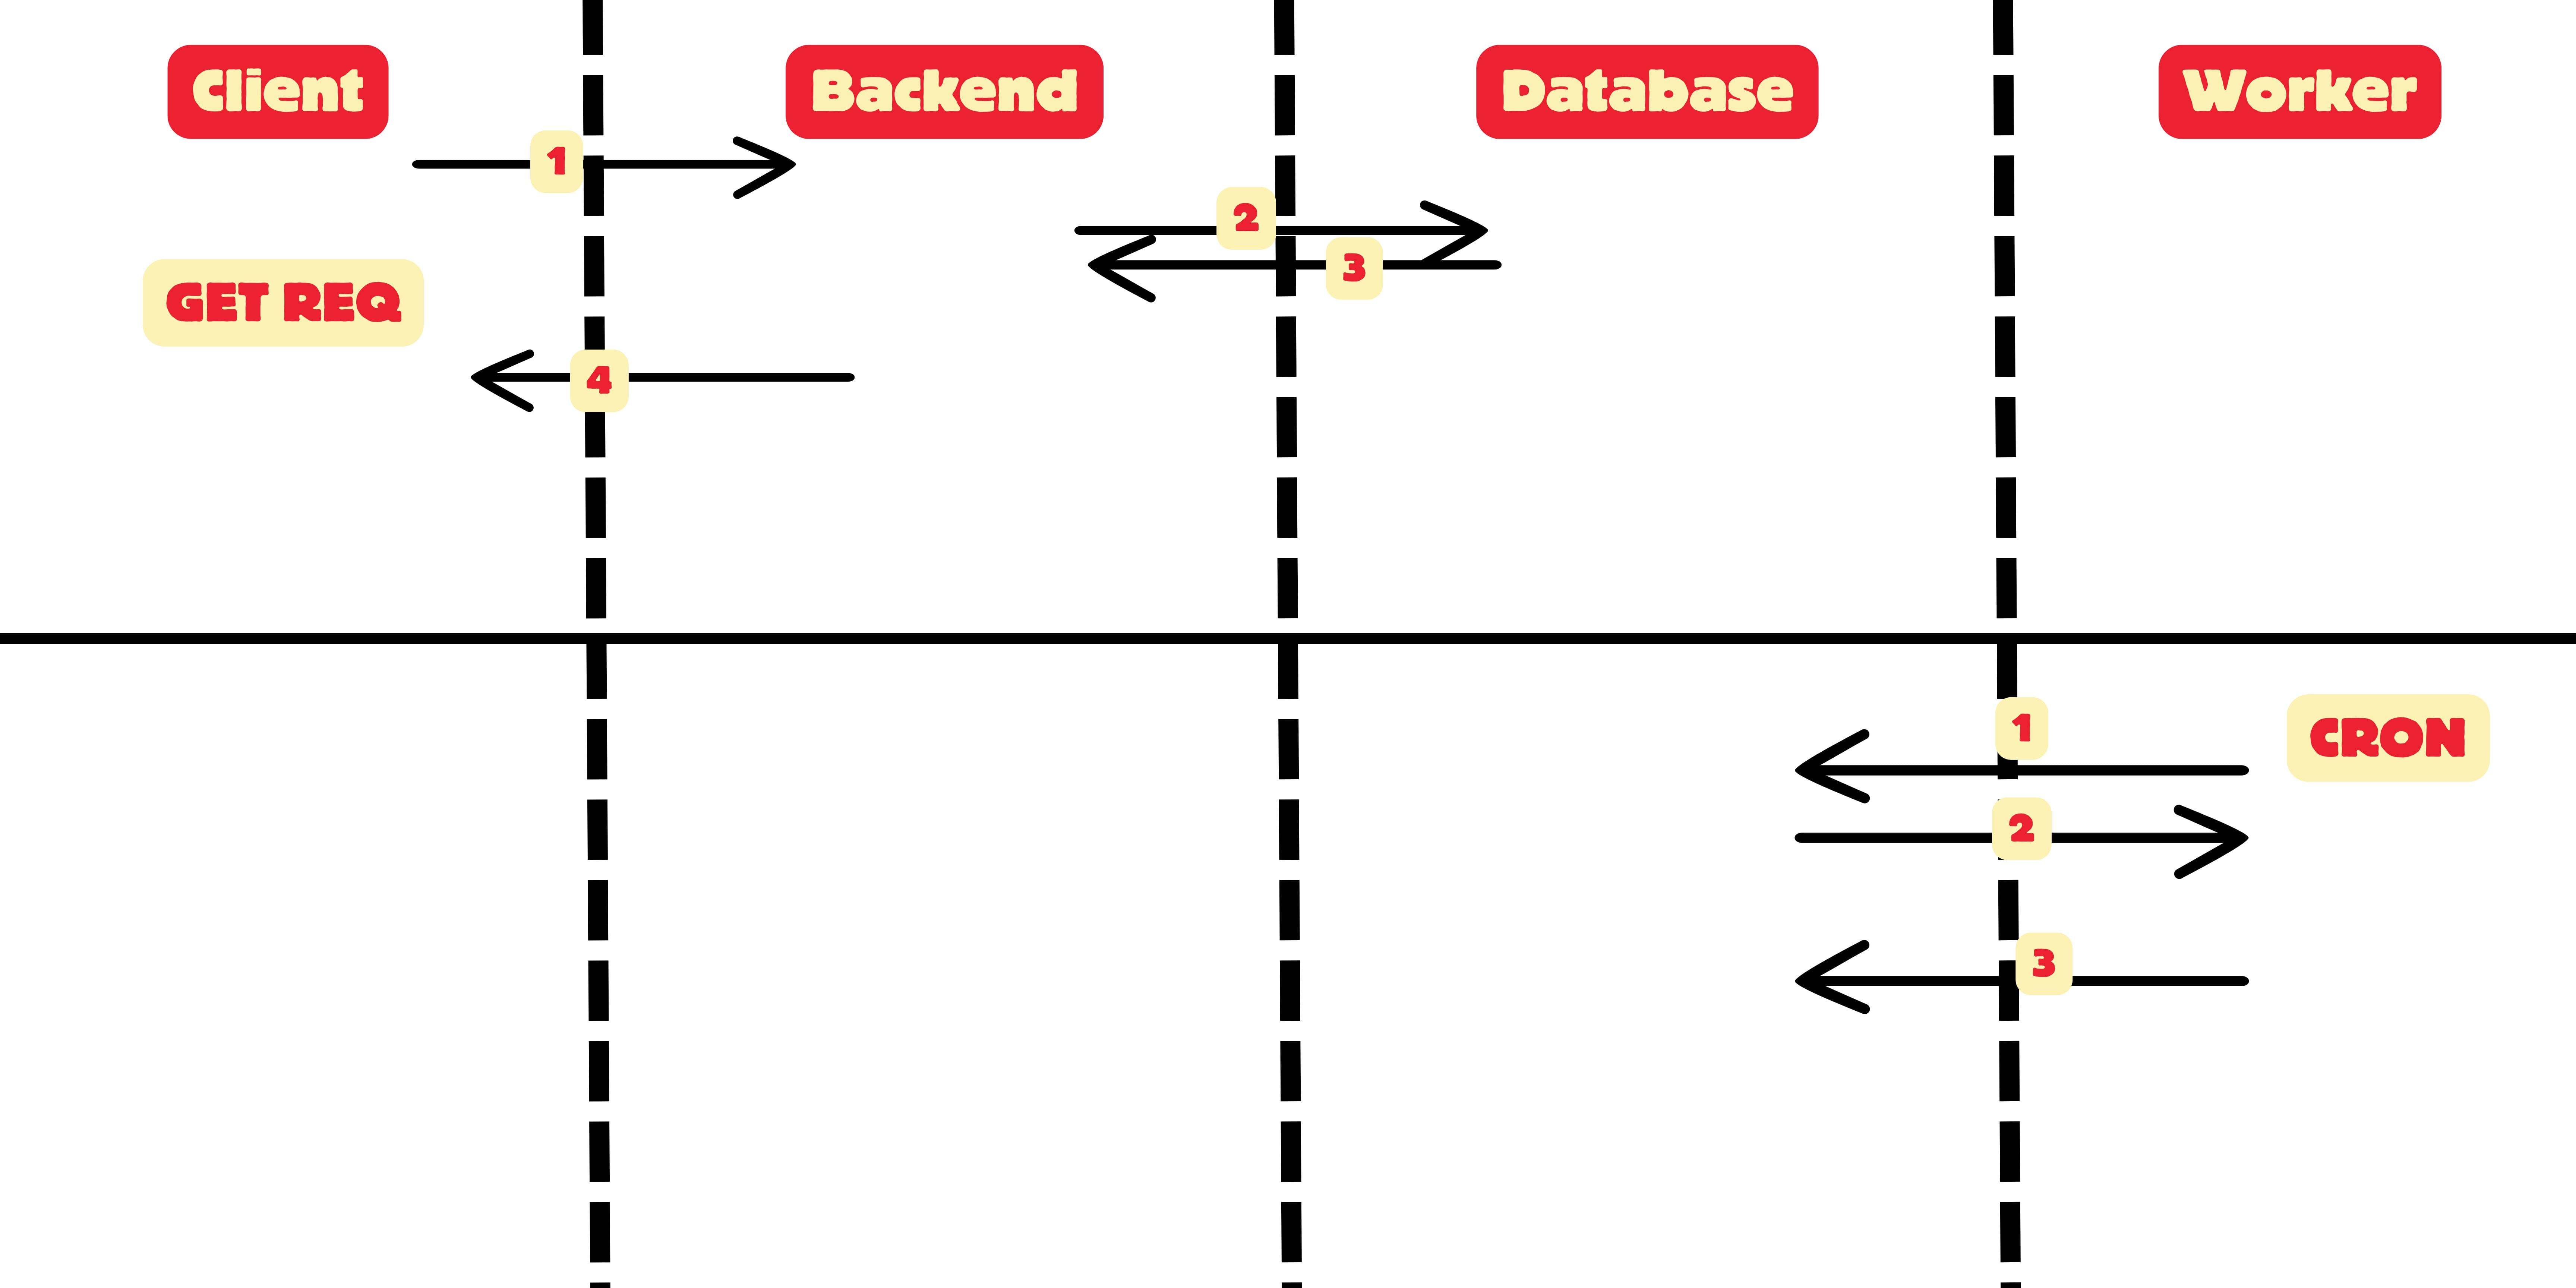
This was written in Python and used up a ton of resources (4GB RAM, 2 CPUs, 1-2 instances depending on the load), and it still wasn't enough. Each image took 10-20 seconds to process. It just wasn't fast. Back then, heatmap was a brand new feature, and we only had 3 configs, so it clearly wasn't scalable. Plus, on closer look, the wind effects weren't even used correctly.
When I found out about this, I suggested generating the heatmap on the frontend! My boss thought the idea was nuts. He didn't believe it was even possible. My argument was simple: today, there are tools like Canva and Figma, and many others that let you edit photos and videos right in the browser. There are even proper 2D games and simulations being played in the browser, and some resume websites are like 3D games. Technology has improved, and coding patterns and styles have changed a lot in the past 2 years, so I thought it was doable. He was convinced and decided to hire an intern to do the R&D 😂, typical corporate.
This really bugged me because I've always wanted to dive into image generation projects, and this seemed like my golden opportunity. So, I spent a weekend 💪 putting together a POC for a heatmap in the browser. And guess what? It worked 🎉.
This was just the start. I still needed to add wind effects, map (long, lat) to (x, y) coordinates, include user-defined boundaries (from a GeoJson polygon), and finally, add gradient colors.
Boss saw it, boss liked it, and of course, I felt great. Everyone was happy 🤭.
He still had a good point. We don't want to do this on the frontend because our frontend runs on old phones, corporate laptops, and sometimes even TVs—in other words, places without much computing power. So, maybe we can set up a proxy server to handle all the heatmaps and generate them on the fly.
Pretty smart idea, right? So, I went ahead and set up a Node server and built the whole thing. It worked great! Turns out, when you use gradient colors, there's not much difference between a 150px resolution and a 1000px resolution, except for having sharper edges.
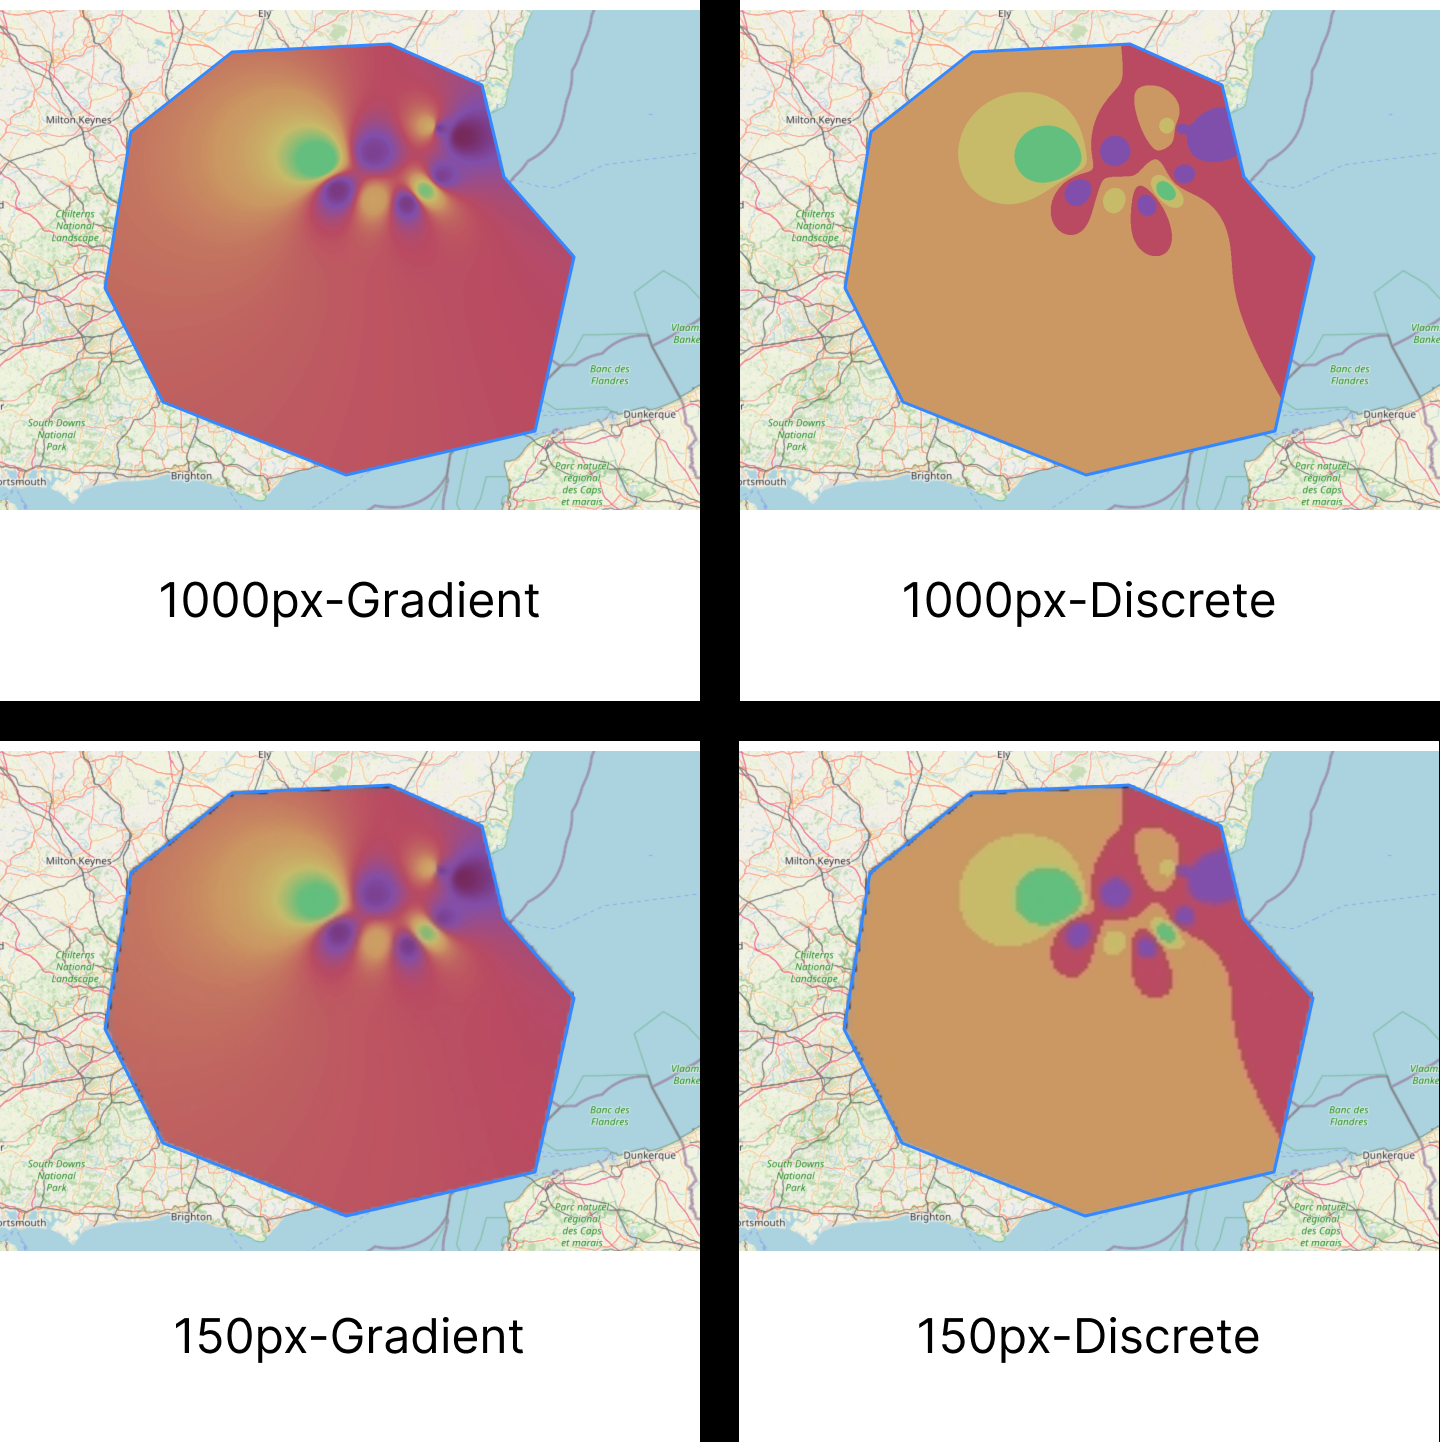
Test case: each request with 100px resolution, 10 known points with 40 images
In Node.js, the results were amazing!
5 req/sec for 5 seconds: 108ms-874ms (average 419ms)
50 req/sec for 5 seconds: 97ms-26,588ms (average 14,687ms, with 2 req/sec failing)
500 req/sec for 5 seconds: 172ms-37048ms (average 22,152ms, with 432 requests failing)
This is so, so much better than anything we had before! 🎉
After this, I decided that to make it even faster, we should use a lower-level language. We also wanted to ensure the language is easy for other developers to understand. So, I chose GoLang.
5 req/sec for 5 seconds: 80ms-175ms (average 114ms)
50 req/sec for 5 seconds: 157ms-265ms (average 458ms)
500 req/sec for 5 seconds: 241ms-10,891ms (average 4,405ms, 296 req/sec failing)
This was so much faster and had less throttling! 🎉
Something still felt off; it shouldn't take this long! After adding time logs for each function, I discovered the bottleneck was Base64 PNG encoding. Each image took 1-3ms, which was 80% of the time! Switching to JPEG boosted performance dramatically!
5 req/sec for 5 seconds: 18ms-56ms (average 29ms)
50 req/sec for 5 seconds: 29ms-132ms (average 88ms)
500 req/sec for 5 seconds: 44ms-929ms (average 496ms, 80 req/sec failing)
🥳 🎉 👏
The only downside to JPEG is that it cannot create transparent images, as it lacks an alpha channel. However, we have a straightforward solution: let the backend handle all the computational tasks, while the frontend focuses on one task—masking the image and selecting only the required portions. This can be accomplished in the frontend using JavaScript, within 10-30ms. If the client can render GeoJSON, maps, and images, it can also perform image masking.
This approach also offers an advantage: the difference between a 150px and a 1000px image is that the 1000px image has sharper edges. To achieve sharper edges for a 150px image, we generate an image with an additional 2px around the boundary and crop the necessary section in the frontend. This results in sharper edges.
🎉🎉🎉 Here's what I did:
The frontend creates a config from backend APIs and stores it in the database.
The frontend requests images for a config, gas parameters, and given time bounds.
The backend fetches all the resources and sets up a payload to send to the GoLang heatmap server.
In the GoLang server: It takes all the boundary points in (long, lat), maps them to (x, y) within 0-1, creates a grid of boxes based on resolution, and finds the ones within the polygon.
It converts all the known points/devices' locations from (long, lat) to (x, y) based on grid transformation.
This grid context is used to precompute the weight of each known point on each target pixel.
Based on the given colors, we create a gradient of values ranging from 0-256 integers.
We set up the encoder and precompute the (x, y) to (pixel position) in the data image array.
For each snapshot of values, we quickly compute the grid's value using precomputed weights.
We magnify each value to bring it between 0-256.
We fill the RGB values in the data image array.
We use the encoder for the base64 image.
These images are sent back to the core server.
The core server sends them back to the client.
The frontend masks the required portion using geo boundaries. Done!
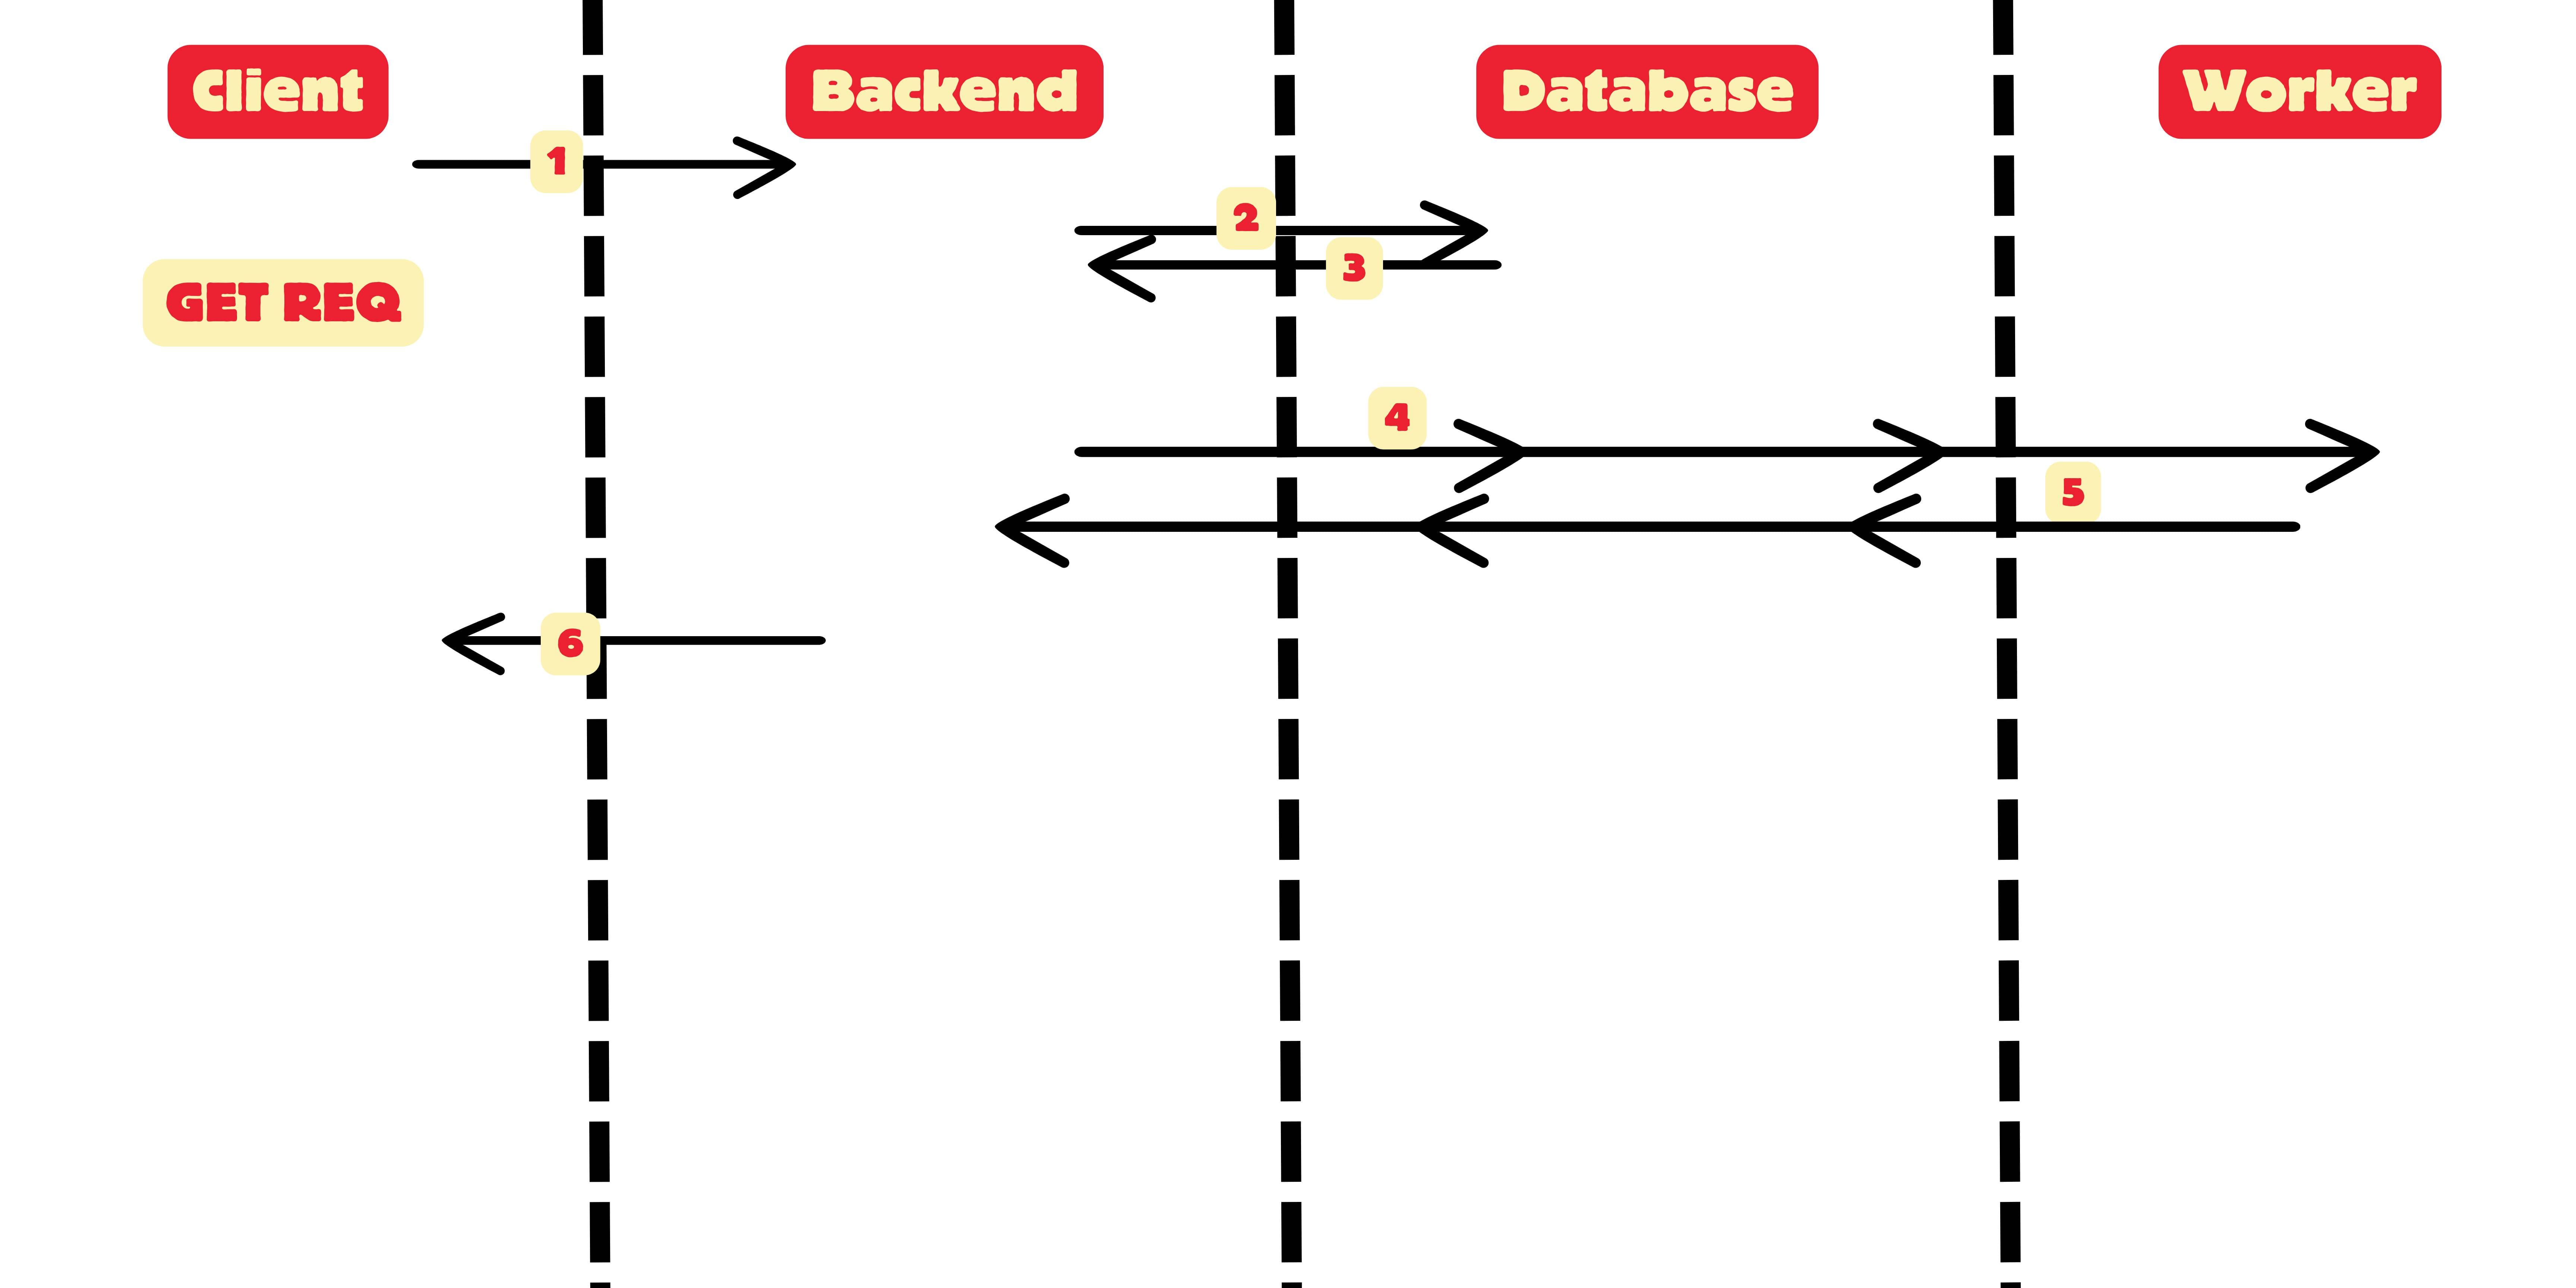
Benefits: Images are generated on the fly, so we can now create past images too. We use fewer resources, which makes everything cheaper overall. Plus, it's finally scalable and versatile.
Heatmaps were only available after they were created → Now we can get heatmaps for any time range.
For a fixed 1-hour average → You can completely customize it.
5 seconds per image → Now it's 30 ms for 20 images.
Python → GoLang.
Complex scheduler-based solution → Simple request/response-based solution.
Fixed options → Custom options for resolution, distance power, wind power, and wind effect.
Finally:
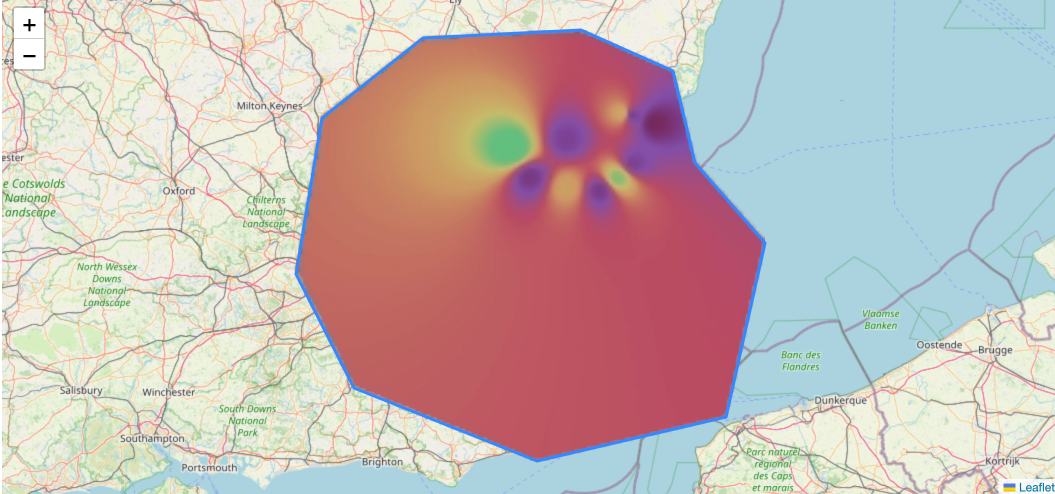
Of course, the data used to create this heatmap is fake and random. But this is how it would look. 😍
Subscribe to my newsletter
Read articles from Panth Patel directly inside your inbox. Subscribe to the newsletter, and don't miss out.
Written by
