How to add another server on node-exporter and prometheus and Structure.🚀
 Birendra Kumar Chaudhary
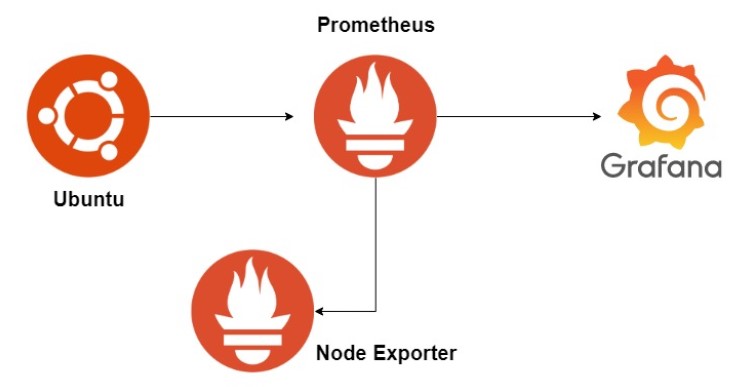
Prometheus acts as the server, scraping and storing metrics from Node Exporter, the client, which collects system-level metrics (CPU, memory, disk, etc.) and exposes them at http://server_ip:9100/metrics. Prometheus is configured to scrape this endpoint, storing the data in its time-series database. You can visualize the metrics using Prometheus' UI or integrate it with Grafana for advanced dashboards.
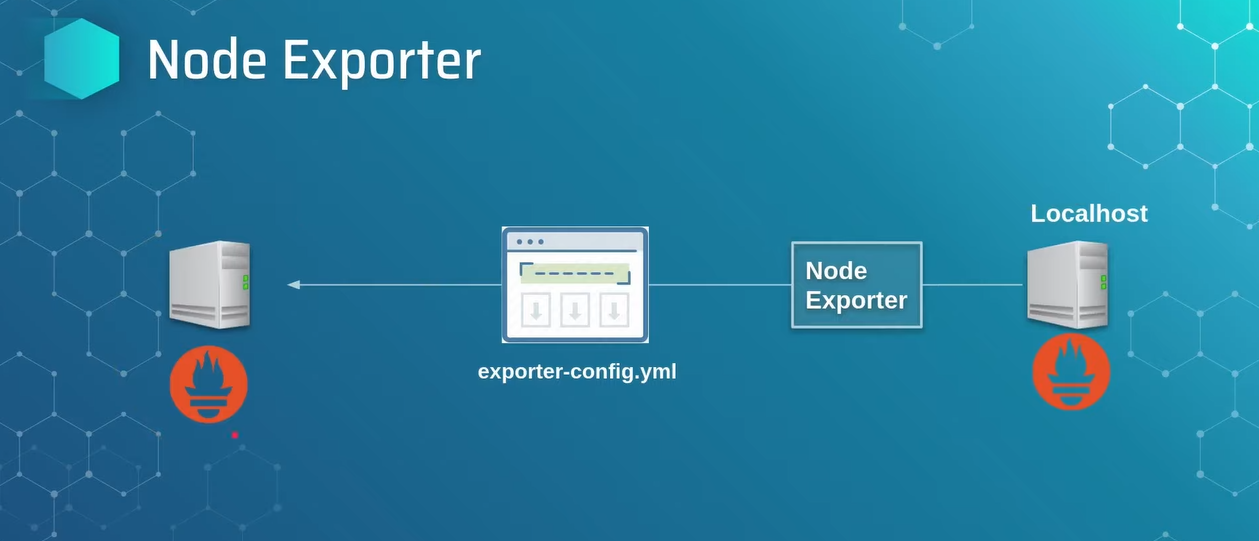
➡How to add another server:
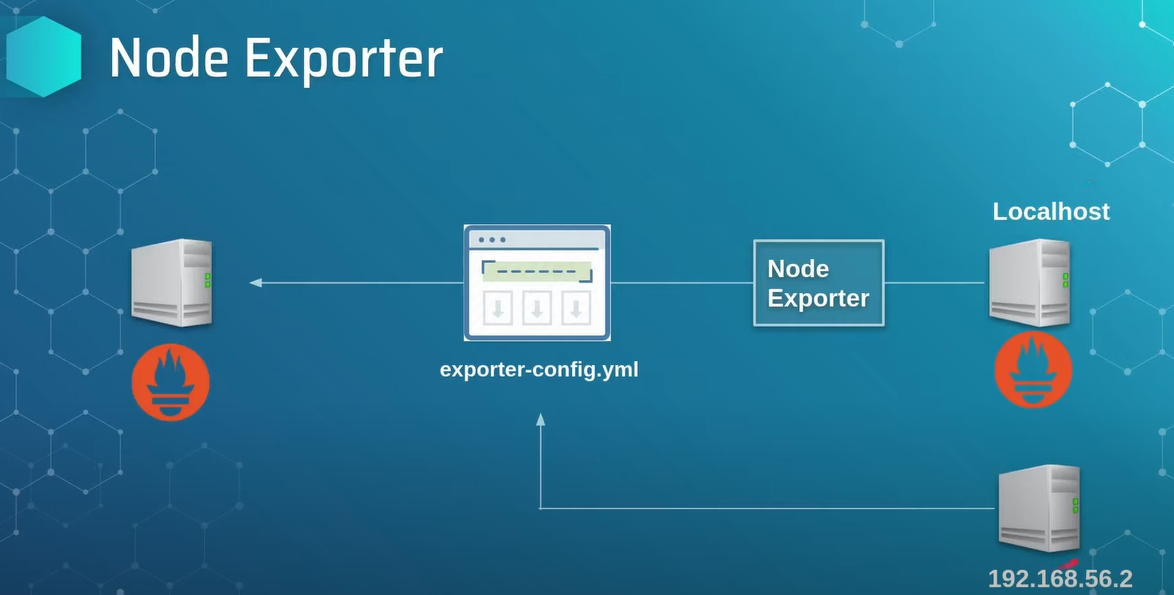
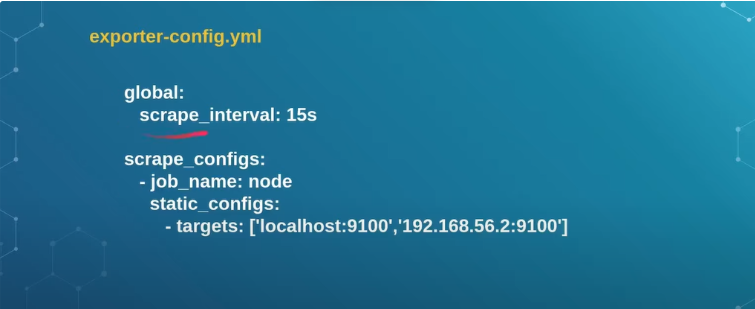
➡Inside prometheus directory exporter-config.yml file add ip_address.
On Next blog: How to install Grafana and how to connect with prometheus and node-exporter.
If you have any questions or face issues, feel free to drop a comment below or mail me at birendra2783@gmail.com!
Subscribe to my newsletter
Read articles from Birendra Kumar Chaudhary directly inside your inbox. Subscribe to the newsletter, and don't miss out.
Written by
Birendra Kumar Chaudhary
Birendra Kumar Chaudhary
🌐 DevOps Enthusiast | Cloud & System Administrator | WordPress Expert With 2+ years of experience, I specialize in cloud infrastructure, server management, and WordPress development. At Appharu PVT. LTD., I optimize systems, reduce costs, and implement monitoring solutions. Experienced in deploying 50+ WordPress sites, AWS S3 integration, and troubleshooting technical issues, I’m focused on performance, security, and continuous learning in DevOps and automation.