Real Estate Data Pipeline with AWS, Airflow, Snowflake & Power BI
 Umair
Umair
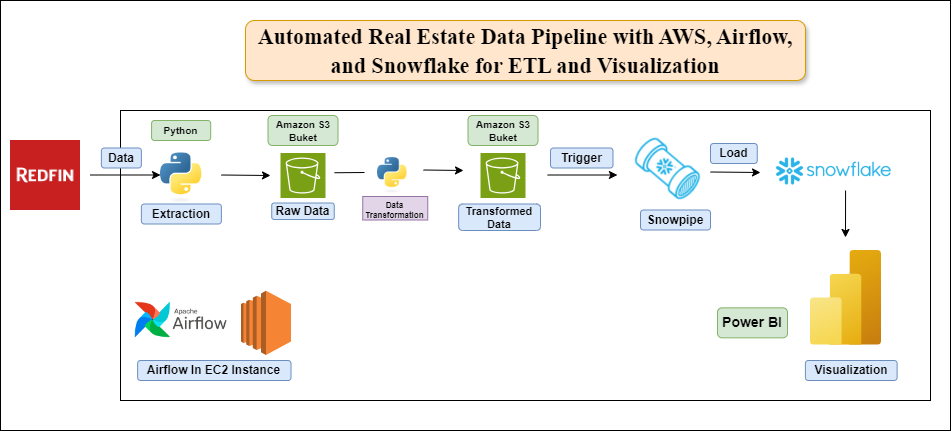
This project implements a scalable data pipeline to extract, transform, and load real estate data from Redfin into Snowflake using AWS services. The data is later visualized in Power BI to provide insights into real estate trends.
Overview
The pipeline involves the following stages:
Data Extraction:
Redfin source data is extracted using Python.
The raw data is loaded into AWS S3 buckets.
Transformation:
Python scripts are used to transform the data.
Transformed data is stored in a separate S3 bucket.
Snowpipe:
- Snowpipe automatically triggers to load transformed data from S3 into Snowflake.
Data Loading:
- Transformed data is ingested into Snowflake for further analysis and querying.
Visualization:
- Data in Snowflake is connected to Power BI for creating visualizations and dashboards.
Orchestration with Airflow:
- Apache Airflow, running on an EC2 instance, orchestrates the entire process, scheduling and monitoring the data pipeline.
Architecture
The architecture includes the following components:
AWS S3: Stores raw and transformed data.
Python: Handles data extraction and transformation.
Snowflake: Stores the final processed data for analytics.
Apache Airflow: Orchestrates the ETL pipeline.
Power BI: Provides visualization for data insights.
Technologies Used
Python: For extraction and transformation scripts.
AWS S3: For cloud storage of raw and transformed data.
Apache Airflow: For orchestrating and automating the data pipeline.
Snowflake: For cloud-based data warehousing.
Power BI: For data visualization.
AWS EC2: For running the Airflow instance.
Key Features
Automated Data Ingestion: Redfin data is automatically ingested and stored in S3 buckets.
ETL Orchestration: Airflow schedules and monitors the ETL pipeline.
Real-Time Loading: Data is continuously ingested into Snowflake using Snowpipe.
Visualization: Power BI connects to Snowflake for advanced analytics and dashboards.
Visualizations through Power BI
Sum of Homes Sold
Sum of Inventory
Subscribe to my newsletter
Read articles from Umair directly inside your inbox. Subscribe to the newsletter, and don't miss out.
Written by


