Real-Time Intelligence with PySpark / Python Notebooks and Power BI – The Perfect Trio for Tracking the International Space Station (ISS)
 Nalaka Wanniarachchi
Table of contents
- Introduction
- System Architecture
- Step 01
- Step 02 - Setting up Eventstream 01 | ISS_Geo_Location_ES
- Step 3 - Code execution via Pyspark/ Python Notebook
- Key Functions:
- Step 04 -Creating tables in Eventhouse KQL DB.
- Step 05 - Setting up Eventstream 02 | ISS_Geo_Astronauts_ES
- Step 05 - Code execution via Pyspark/ Python Notebook
- Step 06 - Design KQL query sets and apply transformations.
- Step 07 - Connecting the dots in PowerBI
- Step 08 - Show Time in PowerBI
- ISS Live
- Orbit Trajectory
- Conclusion
- Key Takeaways

Introduction
Did you know that astronauts aboard the International Space Station (ISS) witness 16 sunrises and sunsets every day?
Travelling at 28,000 km/h (17,500 mph), the ISS completes 15.5 orbits around Earth daily, making it one of the most fascinating engineering marvels in human history. As of February 2025, the station has hosted over 270 astronauts from 19 countries, symbolizing a remarkable achievement in human ingenuity and cooperation.
This blog explores how real-time streaming intelligence can be achieved using Microsoft Fabric Python/PySpark notebooks, event streams, and KQL databases and my ever loving tool PowerBI. Rather than just building another ISS tracking report/dashboard, the focus is on showcasing the power of real-time data processing and end-to-end analytics within Fabric.
This work is inspired by many prior implementations, including those by Anshul Sharma and Bradley Ball @ Microsoft, who demonstrated ISS tracking with Azure Logic Apps. Kudos also to Vahid DM (Microsoft MVP ) for his article, which provided valuable insights on the same topic for API integration with Notebooks and Eventstream. Expanding on these foundations, this approach introduces new techniques that enhance flexibility and efficiency using custom endpoints and event-streaming without Azure Logic Apps.
Let’s dive in and see how we can track the ISS and its astronauts in real-time / near real-time 😊
System Architecture

To acquire data on the International Space Station (ISS), we utilize two APIs: the ISS Location API and the Astronauts Data API. We process this data using separate Python or PySpark notebooks, which send the payload to an event stream via custom endpoints. Subsequently, the streamed data is stored as tables in the Eventhouse KQL Database, serving as the foundation for our Power BI reports and dashboards.
Step 01
First, we create a new Eventhouse to hold the KQL Database and subsequent tables.

In my setup, the Eventhouse is named 'ISS_Eventhouse,' and the KQL Database is named 'ISS_DB_001.' Adopting a meaningful naming convention is always a best practice that enhances clarity and maintainability.

Since we are working with two distinct data streams—one for ‘ISS Geo location’ and the other for ‘ISS Astronauts’—we need to create two separate tables to store this data. For now, we'll focus on setting up the Eventstream and leave the table creation on hold. As you progress, you'll understand why it's essential to first establish the Eventhouse and KQL Database before moving forward with the Eventstream setup.
Step 02 - Setting up Eventstream 01 | ISS_Geo_Location_ES
Creating a new Eventstream is very straightforward ; and after that we have to add a source. In this exercisE since I am planning to get ‘ISS Geo’ API data I would use custom endpoint as my source (Refer to my previous blog post on comprehensive use case with Custom endpoint)

Once Custom endpoint added as a source we can get the SAS Key (Connection string - primary key) as below.

Step 3 - Code execution via Pyspark/ Python Notebook
Okay, now we need to switch to our notebook and start writing the code to retrieve data from the API and push the payload to the ‘ISS_Geo_Location_ES’ Eventstream . First, we need to install the following libraries .
requests: Used to send HTTP requests to the API and fetch live data.
pytz: Helps manage time zones and convert timestamps. In this blog, we’ll use Sri Lanka,Colombo Time.
azure-servicebus: Allows us to send messages from the Notebook to Fabric’s EventStream.
pip install requests pytz azure-servicebus
import requests
import json
import time
from datetime import datetime
from azure.servicebus import ServiceBusClient, ServiceBusMessage
import pytz

# Replace with your Fabric EventStream connection string
myconnectionstring = "YOUR SAS KEY"

# API URL - Change this to any API you want to use
API_URL = "http://api.open-notify.org/iss-now.json"
# API_URL = "https://api.wheretheiss.at/v1/satellites/25544"  # Example: ISS API

# Function to fetch data from any API
def fetch_api_data():
    try:
        response = requests.get(API_URL)
        response.raise_for_status()  # Raises an error if the request fails
        data = response.json()

        # Convert single object response to a list for consistency
        if isinstance(data, dict):
            return [data]  # Wrap single dictionary in a list

        return data  # Return list as-is
    except requests.exceptions.RequestException as e:
        print(f"Error fetching data: {e}")
        return None

# Function to add timestamps in Sri Lanka (Colombo) time with explicit UTC +5:30
def add_timestamps(data):
    colombo_tz = pytz.timezone("Asia/Colombo")
    now_colombo = datetime.now(colombo_tz)

    formatted_datetime = now_colombo.strftime("%m/%d/%Y %I:%M:%S %p") + " UTC +5:30"  # MM/DD/YYYY HH:MM:SS AM/PM UTC +5:30
    date_column = now_colombo.strftime("%d-%m-%Y")  # DD-MM-YYYY
    time_column = now_colombo.strftime("%H:%M:%S")  # HH:MM:SS
    utc_offset = "UTC +5:30"  # Explicitly set the offset

    for record in data:
        record["datetime"] = formatted_datetime  # Full timestamp with explicit UTC +5:30
        record["date"] = date_column  # Just the date
        record["time"] = time_column  # Just the time
        record["utc_offset"] = utc_offset  # Separate UTC offset for reference

    return data


# Function to send processed data to Microsoft Fabric EventStream
def send_to_eventstream(messages, connection_string):
    # Extract EntityPath from connection string
    entity_path = None
    for param in connection_string.split(';'):
        if param.startswith('EntityPath='):
            entity_path = param.split('=')[1]
            break

    if not entity_path:
        raise ValueError("EntityPath not found in connection string. Please check your connection details.")

    # Ensure data is always a list before sending
    if isinstance(messages, dict):
        messages = [messages]  # Convert single object to a list

    # Establish connection to Fabric EventStream
    servicebus_client = ServiceBusClient.from_connection_string(connection_string)
    try:
        with servicebus_client.get_queue_sender(entity_path) as sender:
            # Convert messages to JSON format
            batch_message = [ServiceBusMessage(json.dumps(msg)) for msg in messages]
            sender.send_messages(batch_message)
            print(f"Successfully sent {len(messages)} records to EventStream.")
    except Exception as e:
        print(f"Error sending messages: {e}")
    finally:
        servicebus_client.close()

# Infinite loop to fetch and send data every 2 seconds
print(f"Starting real-time data streaming from {API_URL} to Fabric...")
while True:
    data = fetch_api_data()  # Fetch data from API
    if data:
        processed_data = add_timestamps(data)  # Add date and time
        send_to_eventstream(processed_data, myconnectionstring)  # Send data to EventStream
        print(f"Sent {len(processed_data)} records at {processed_data[0]['datetime']}")
    time.sleep(2)  # Wait for 2 seconds before fetching new data
Here, we are using the following API to retrieve the current location of the ISS : "http://api.open-notify.org/iss-now.json".
This code block continuously fetches data from an above API (tracking the International Space Station's location), adds timestamps in Sri Lanka's time zone (UTC +5:30) (My current Location), and sends the processed data to Microsoft Fabric’s EventStream every 2 seconds.
Key Functions:
fetch_api_data() – Retrieves data from the specified API.
add_timestamps() – Adds the current date and time in Colombo (Sri Lanka) time zone.
send_to_eventstream() – Sends the processed data to Microsoft Fabric EventStream using Azure Service Bus.
The script runs indefinitely, pulling live data every 2 seconds and streaming it to Fabric.
After running the code above, we should receive a confirmation message indicating that the payload has been successfully ingested into the EventStream.I tested this with both Pyspark and Python notebooks in Fabric ,both worked well,Since the payload is quite small for a tumbling window I used Python Notebooks for the rest of the demo.Below figure shows the successful ingestion to EventStream.

If we go back to EventStream, we can see the incoming data stream for ‘ISS Geo Location’ as below.

Step 04 -Creating tables in Eventhouse KQL DB.
As you remember in Step 01 ,we created a KQL Database named ‘ISS_DB_001’ . In order to create a table to save the data receiving from Eventstream we select ‘Get data’ option and select ‘Existing Eventstream’ as below.

Once select that, we can choose to save a table name , in this case I chosen as ‘ISSGeoLocation’ and configured the rest as it is.

Once we finish this step and confirm that everything is working as expected, we can verify that the following flow in Eventstream has been correctly mapped in the Eventstream(ISS_Geo_Location_ES) canvas.

Step 05 - Setting up Eventstream 02 | ISS_Geo_Astronauts_ES
Similar pattern continues for Eventstream 02 and rest as above .

Locating the SAS Key for use of python Notebook as below

This time we use the API for Astronauts data “API_URL = "http://api.open-notify.org/astros.json"
Step 05 - Code execution via Pyspark/ Python Notebook
Only change Aare the API URL and SAS KEY ,others are same.
import requests
import json
import time
from datetime import datetime
from azure.servicebus import ServiceBusClient, ServiceBusMessage
import pytz

# Replace with your Fabric EventStream connection string
myconnectionstring = "YOUR SAS KEY"

# API URL - Change this to any API you want to use
API_URL = "http://api.open-notify.org/astros.json"
# API_URL = "https://api.wheretheiss.at/v1/satellites/25544"  # Example: ISS API

# Function to fetch data from any API
def fetch_api_data():
    try:
        response = requests.get(API_URL)
        response.raise_for_status()  # Raises an error if the request fails
        data = response.json()

        # Convert single object response to a list for consistency
        if isinstance(data, dict):
            return [data]  # Wrap single dictionary in a list

        return data  # Return list as-is
    except requests.exceptions.RequestException as e:
        print(f"Error fetching data: {e}")
        return None

# Function to add timestamps in Sri Lanka (Colombo) time
def add_timestamps(data):
    colombo_tz = pytz.timezone("Asia/Colombo")
    now_colombo = datetime.now(colombo_tz)

    formatted_datetime = now_colombo.strftime("%m/%d/%Y %I:%M:%S %p")  # MM/DD/YYYY HH:MM:SS AM/PM
    date_column = now_colombo.strftime("%d-%m-%Y")  # DD-MM-YYYY
    time_column = now_colombo.strftime("%H:%M:%S")  # HH:MM:SS

    for record in data:
        record["datetime"] = formatted_datetime
        record["date"] = date_column
        record["time"] = time_column

    return data

# Function to send processed data to Microsoft Fabric EventStream
def send_to_eventstream(messages, connection_string):
    # Extract EntityPath from connection string
    entity_path = None
    for param in connection_string.split(';'):
        if param.startswith('EntityPath='):
            entity_path = param.split('=')[1]
            break

    if not entity_path:
        raise ValueError("EntityPath not found in connection string. Please check your connection details.")

    # Ensure data is always a list before sending
    if isinstance(messages, dict):
        messages = [messages]  # Convert single object to a list

    # Establish connection to Fabric EventStream
    servicebus_client = ServiceBusClient.from_connection_string(connection_string)
    try:
        with servicebus_client.get_queue_sender(entity_path) as sender:
            # Convert messages to JSON format
            batch_message = [ServiceBusMessage(json.dumps(msg)) for msg in messages]
            sender.send_messages(batch_message)
            print(f"Successfully sent {len(messages)} records to EventStream.")
    except Exception as e:
        print(f"Error sending messages: {e}")
    finally:
        servicebus_client.close()

# Infinite loop to fetch and send data every 2 seconds
print(f"Starting real-time data streaming from {API_URL} to Fabric...")
while True:
    data = fetch_api_data()  # Fetch data from API
    if data:
        processed_data = add_timestamps(data)  # Add date and time
        send_to_eventstream(processed_data, myconnectionstring)  # Send data to EventStream
        print(f"Sent {len(processed_data)} records at {processed_data[0]['datetime']}")
    time.sleep(2)  # Wait for 2 seconds before fetching new data
Eventstream 02 get the payload of Astronauts data as below.

Similarly, for astronauts, we create a new table in the KQL database for astronaut data as ‘ISSAstronauts’.

With this step completed, our work with Eventstream and Notebooks are concluded (Notebooks needs to be scheduled). The remaining tasks involve the KQL database, KQL Magics, and Power BI.
Step 06 - Design KQL query sets and apply transformations.
The KQL queries that have been used I have attached follows.These queries were first tested in KQL DB and then used inside the PowerBI and setting up the storage mode as Direct query.
// Code for the ISS latest tragectory -100 Time Points

ISSGeoLocation
| top 100 by timestamp
| project iss_position_longitude, iss_position_latitude, timestamp
| render scatterchart with ( kind=map )
// ISS Geo location in Past 90 Minutes

ISSGeoLocation
| extend Timestamp=todatetime(timestamp)
| where Timestamp > ago(90m)
| project iss_position_longitude, iss_position_latitude, Timestamp
// Details of ISSAstronauts

ISSAstronauts
| top 1 by ['datetime']
| mv-expand people
| project Name= people.name, Craft=people.craft
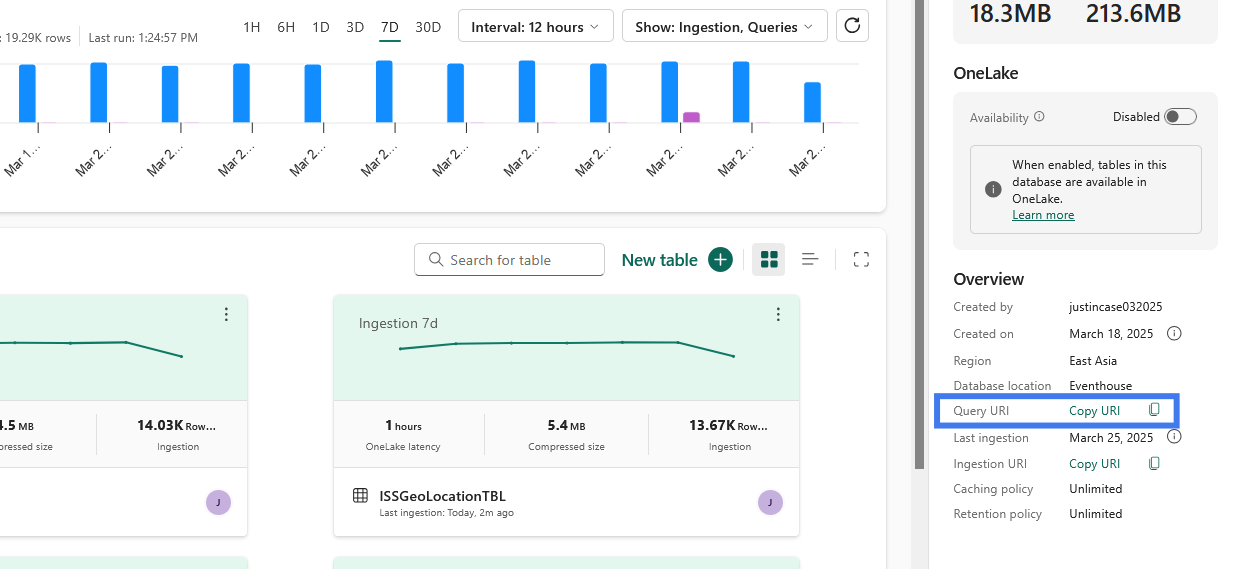
Obtain the Ingestion URI by copying as above in KQL DB.This will be our cluster URL for ADX / Kusto source.
Step 07 - Connecting the dots in PowerBI
We then use the same KQL queries and use as a Directquery storage mode in PowerBI in order to see the latest and greatest data from KQL DB tables.
ISS Location Table -Current Live Location of ISS

GetAstronauts Table -Astronauts Data

ISSOrbit Table - ISS Trajectory in Past 90 minutes

Step 08 - Show Time in PowerBI
I have enabled page-level refresh every 3 seconds in Power BI (Desktop/Service), ensuring that the latest location and details are updated every 3 seconds, providing a near real-time experience.
At the time of writing this blog, the ISS is traveling across the Atlantic Ocean at an astonishing speed of 27,584 km/h.


You may notice that I have included the altitude and speed (Km/H) of the ISS. To achieve this, I used an additional API (https://api.wheretheiss.at/v1/satellites/25544), following the same process as above. The retrieved data was stored in a new table and integrated into the Power BI report.
altituderepresents the ISS's altitude above Earth's surface in kilometers.
velocity/speed indicates the ISS's speed in kilometers per hour.(See the speed 😮😮😮)
ISS Live

Orbit Trajectory

Conclusion
This blog post showcased a real-time streaming solution for tracking the ISS and astronauts using Microsoft Fabric, KQL, and Power BI—all without relying on Azure Event Hub. The use of custom endpoints and Python/Pyspark notebooks makes this approach flexible and scalable.
Key Takeaways
✅ No Need for Azure Logic Apps – This method simplifies the architecture while maintaining real-time streaming capabilities.
✅ Scheduled Refresh & Auto Page Refresh – Notebooks are scheduled for refresh, and Power BI auto-refreshes every 3 seconds for a near real-time experience.
✅ Lightweight & Efficient – Using Python notebooks, the resource usage remains minimal (max 2vCores/16GB), avoiding the need for a heavy cluster.
✅ Fully Housed in Microsoft Fabric – The entire solution is built within Microsoft Fabric, leveraging Notebooks, Eventstream, KQL DB, and Power BI for a seamless experience.
🔗 Resources – Check out my GitHub repo for PBIX files, KQL queries, and other references.
As usual Thanks for Reading !!!
Subscribe to my newsletter
Read articles from Nalaka Wanniarachchi directly inside your inbox. Subscribe to the newsletter, and don't miss out.
Written by
Nalaka Wanniarachchi
Nalaka Wanniarachchi
Nalaka Wanniarachchi is an accomplished data analytics and data engineering professional with over 20 years of working experience. As a CIMA(ACMA/CGMA) UK qualified ex-banker with strong analytical skills, he transitioned into building robust data solutions. Nalaka specializes in Microsoft Fabric and Power BI, delivering advanced analytics and engineering solutions. He holds a Microsoft certification as a Fabric Analytic Engineer and Power BI Professional, combining technical expertise with a deep understanding of financial and business analytics.