Analytical Patterns: The most obvious ones
 Rutvik Joshi
This article is based on my learnings and the content from Zach Wilson’s Data Engineering YouTube bootcamp.
TLDR;
Analytical patterns offer a structured approach for data professionals to efficiently process and analyze data, akin to mathematical formulas. They streamline workflows for data engineers, scientists, and analysts, focusing on interpreting results and making data-driven decisions. Key methods include aggregation, cumulation, and window functions. Patterns like Growth Accounting and Survivorship Analysis help track user behavior, while Funnel Analysis optimizes conversion rates, enhancing analytical capabilities across domains.
Analytical Patterns - who, what and why?
I know, you won’t shut your mind when I say “Math”. It runs within you to a certain extent so hear me out when I say, that just as mathematical formulas provide a structured way to solve problems, analytical patterns offer a systematic approach for data professionals to efficiently process and analyze data.
Who relies on these patterns?
What does it help with?
Why is it required?
Abstraction Methods
These analytical patterns can be used through higher-level abstractions like aggregation, cumulation, and window functions, which serve as the essential tools that simplify complex data operations.
Aggregation: condenses data to highlight key insights.
Example
Cumulation: tracks data changes over time.
Example
Window functions: enable intricate calculations like rolling sum, ranking without altering the dataset's structure.
Example
Writing about Analytical Patterns, the two major ones covered in the course were Cumulation abstraction based Growth Accounting Analysis and Survivorship Analysis.
Growth Accounting Analysis
Growth accounting is a method used by Meta to track the inflows and outflows of active and inactive users. This pattern is not only applicable to user tracking but can be adapted for any state change transition tracking. It is closely related to cumulative table design concepts used in dimensional and fact data modeling (covered in earlier articles).
Key Concepts involve:
State Change Tracking: This involves keeping a log of every time a dimension changes, rather than storing every value of a dimension. It helps in understanding user behavior over time.
User States: Users can be categorized into states such as new, retained, churned, resurrected, and stale. Understanding these states helps in analyzing user growth and retention.
Application Beyond User Growth: Growth accounting can be applied to various domains, such as tracking fake accounts or monitoring the health of machine learning models.
Survivorship Analysis
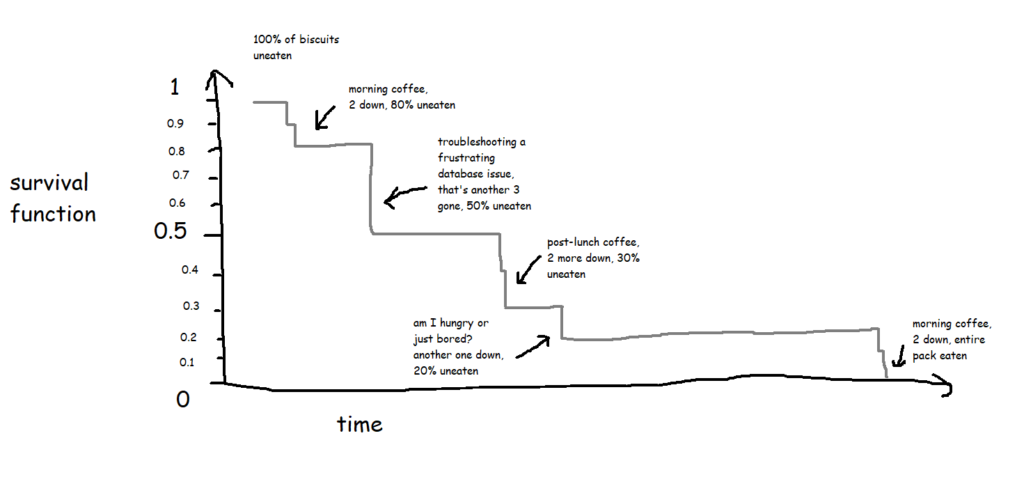
Survivorship analysis, also known as retention analysis/J curve analysis, examines the percentage of users who remain active over time. This pattern is crucial for understanding user engagement and the long-term success of a product.

Key Concepts involve:
Cohort Analysis: Users are grouped based on a reference date, such as the signup date, and their activity is tracked over time.
Retention Curves: These curves help visualize user retention over time, indicating the stickiness of an app or service.
Applications: Beyond user retention, survivorship analysis can be applied to various fields, such as healthcare (e.g., cancer survival rates) or behavioral studies (e.g., smokers remaining smoke-free).
Funnel Analysis
Funnel analysis is a method used to visualize and analyze the sequence of events leading to a desired outcome, typically focusing on user conversion through various stages of a process. This pattern is essential for understanding user behavior, identifying bottlenecks, and optimizing conversion rates in digital products and services.
Remind a funnel analysis image diagram
Key Concepts involve:
Conversion Rates: Measuring the percentage of users who successfully move from one step to the next in the funnel, highlighting areas of drop-off or success.
Step Segmentation: Breaking down the user journey into distinct, measurable stages to track progress and identify areas for improvement.
Cohort Analysis: Grouping users based on shared characteristics or behaviors to compare performance across different segments.
Applications: Funnel analysis is widely used in e-commerce (checkout processes), user onboarding, subscription services, and any multi-step process where user progression is critical. It can also be applied to analyze operational metrics, customer acquisition strategies, and product feature adoption.
Hence understanding analytical patterns will empower you to efficiently process data, derive insights, and make informed decisions. These patterns streamline workflows, enhance analytical capabilities, and are crucial for driving impactful outcomes across various domains and industries (part of the next article)
Questions to ask
Use the below questions as a reference, the next time you think for implementing analytical patterns:
What is the specific objective of the analysis?
How will the chosen pattern impact data quality and consistency?
Is the chosen pattern scalable and adaptable to future needs and what insights would it derive for decision making?
I appreciate your time reading through this. In the next article, I’ll share my learnings on Experimentation & Data Quality. Stay curious!
Subscribe to my newsletter
Read articles from Rutvik Joshi directly inside your inbox. Subscribe to the newsletter, and don't miss out.
Written by

Rutvik Joshi
Rutvik Joshi
I seek to create experiences. Currently doing it with, data, design and a blend of analytics.