Data Cleaning Explained
 Boluwatife Oludupin
Data cleaning, also known as data cleansing or data wrangling, refers to the process of identifying and correcting inaccurate, incomplete, irrelevant, or improperly formatted data within a dataset. It's a crucial step in data analysis as it ensures the quality and reliability of your results.
Think of it like building a house. You wouldn't use weak or poorly-sized bricks, would you? Similarly, using dirty data can lead to flawed or misleading conclusions in your analysis.
So what does data cleaning involve?
Identifying and removing duplicates: These are identical entries within your dataset that can skew results.
Handling missing values: These are missing entries for specific data points. You may choose to remove them, fill them with appropriate values, or impute them using statistical methods.
Correcting errors: This includes fixing typos, inconsistencies in formatting (e.g., dates, units), and outliers (extreme values that deviate significantly from the rest of the data).
Transforming data: This involves converting data into a format suitable for analysis. This might include scaling numerical data or converting categorical data into numerical codes.
Validating data: This involves checking if the data adheres to defined rules and expectations.
Things to Consider When Cleaning Data:
Data Source: Understand how the data was collected and by whom. This helps identify potential biases or inconsistencies.
Context and Purpose: What are you analyzing the data for? This determines the level of cleaning required and the specific issues you need to address.
Domain Knowledge: Having knowledge about the field from which the data originates can help you identify and address specific data quality issues.
Data integrity: Ensure the cleaning process doesn't introduce new errors or alter the meaning of the data unintentionally.
Documentation: Document the cleaning steps taken and the rationale behind them to ensure transparency and reproducibility.
How to handle missing values in your data.

Missing values—those pesky blank spots in your data—can be a real headache. But fear not, there are ways to deal with them! The best approach depends on the data type (numeric or categorical) and the reason for the missing values (more on that later). Here's a breakdown for each:
Numeric Data:
Deletion: This is the simplest method, but also the most aggressive. You can remove entire rows or columns with missing values. However, this can be problematic if you have a lot of missing data or it biases your results (more missing values in one group than another).
Imputation: This involves filling in the missing values with an estimate. Here are some common methods:
Mean/Median: Replace missing values with the average (mean) or middle value (median) of the column. Good for normally distributed data, but can be skewed by outliers for the mean.
Mode: Replace with the most frequent value in the column. Works well for categorical data that leaks into numeric (e.g., income brackets), but is not ideal for continuous numeric data.
Model-based techniques: Use statistical models to predict the missing values based on other features in the data. This is a powerful option but requires more expertise.
Categorical Data:
Deletion: Similar to numeric data, deletion might be necessary if you have a high percentage of missing values or they're randomly scattered.
Imputation: Here, the options are slightly different:
a. Mode: Same as numeric data, this replaces missing values with the most frequent category.
b. Add a "Missing" Category: Create a new category specifically for missing values. This can be useful if the reason for missing data is itself informative (e.g., "income not disclosed").
NB: The best approach also depends on the reason for missing data. There are three main categories:
Missing Completely at Random (MCAR): Missing values occur randomly and don't depend on any other variable. Deletion might be okay here.
Missing at Random (MAR): Missingness depends on observed variables. This is where imputation using other data points can be effective.
Missing Not at Random (MNAR): The reason for missing data is related to the missing value itself. This is the trickiest scenario, and deletion or specific imputation strategies might be needed.
The bottom line is to identify the type of data (numeric/categorical) and the reason for missingness before choosing an approach. You can consider deletion for simplicity, but imputation with mean/median/mode or model-based techniques can be more informative when appropriate. Remember, the goal is to minimize bias and create a more accurate representation of your data.
Handling outliers in your data.
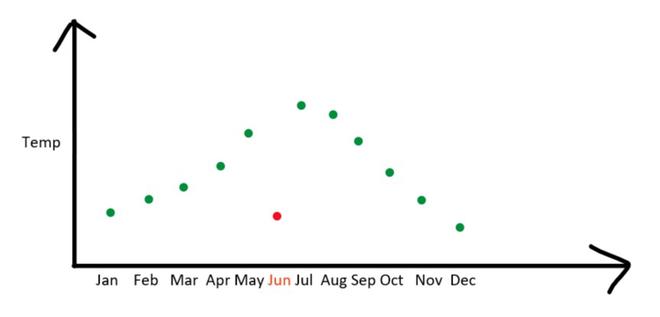
Outliers are data points way outside the main cluster in your data, like lone wolves in a pack. They can arise from errors, natural variations, or unexpected events. These outliers can mess up your analysis by skewing the average, hiding patterns, and messing with statistical tests. In short, they can make your results misleading.
But don't worry, there are ways to handle them! The best approach depends on several factors, including:
The severity of the outliers: Are they slightly off or way out there?
The distribution of your data: Is it normally distributed (bell-shaped) or skewed?
The number of outliers: A few might be manageable, but many could be signs of a problem.
The potential cause of the outliers: Are they errors or valid but unusual data points?
Here are some common strategies for handling outliers:
Investigate: Before taking action, try to understand why the outliers exist. Are they data entry errors, or genuine but rare occurrences? This can help you decide the best course of action.
Winsorization: This replaces extreme outliers with values closer to the main body of the data. It essentially caps the outliers at a certain percentile (e.g., 99th percentile) to reduce their influence
Trimming: This removes a specific percentage of data points from the distribution's tails, effectively eliminating the most extreme outliers.
Transformation: Sometimes, transforming your data (e.g., taking the log) can bring outliers closer to the rest. This can be useful if your data is skewed.
Robust statistical methods: Certain statistical methods are less sensitive to outliers. These can be used for analysis without needing to remove or adjust the outliers themselves.
Do Nothing (if justified): If the outliers are a small number and seem valid, you might decide to leave them be. Just be aware of their potential impact on your analysis.
Some additional tips:
Always visualize your data: Boxplots and scatterplots are great tools to identify outliers visually.
Document your decisions: Keep track of how you handle outliers, so you can explain your approach if needed
Consider the impact on your analysis: Choose a method that minimizes bias and accurately reflects the underlying patterns in your data.
Remember, data cleaning is an iterative process. As you explore and analyze your data, you may encounter new issues requiring further cleaning. The key is to be meticulous and ensure your data is in good shape before drawing any conclusions from it.
Subscribe to my newsletter
Read articles from Boluwatife Oludupin directly inside your inbox. Subscribe to the newsletter, and don't miss out.
Written by
Boluwatife Oludupin
Boluwatife Oludupin
Hi! Welcome to my blog. I am a Data Scientist who is addicted to solving real-world problems using data and this is where I pen my thoughts and share my knowledge. My journey into the amazing world of data started roughly 10 years ago as a mathematics undergrad where I developed a keen interest in data collection, operation research, python programming, and data analysis. I also worked on some personal porjects and data analysis gigs too. In 2019, I decided to dedicate my career to helping businesses make sense of their data for decision-making and driving growth. This decision spurred me into a lifelong journey of learning and personal development. I am also very keen on mentoring individuals who want to take up a career in data.