Exploring Polynomial Regression and Quantile Regression in Machine Learning
 Tushar Pant
Introduction
Linear Regression is a powerful tool, but its simplicity can be a limitation when dealing with non-linear relationships. To tackle this, we turn to Polynomial Regression, which can model more complex patterns by fitting a polynomial equation to the data.
On the other hand, Quantile Regression is useful when predicting specific percentiles rather than just the mean of the target variable, offering a more comprehensive view of the data distribution. This makes it invaluable in fields like finance and risk management.
1. Polynomial Regression
Polynomial Regression is an extension of Linear Regression, where the relationship between the independent variable (X) and the dependent variable (Y) is modeled as an nth degree polynomial. It can capture non-linear patterns by adding polynomial terms to the model.
1.1 When to Use Polynomial Regression?
When data shows a non-linear trend.
When a higher-order relationship exists between input and output.
When Linear Regression underfits the data.
1.2 Example Use Case:
Predicting house prices based on features like square footage, number of bedrooms, and location, where the relationship is non-linear.
1.3 Mathematical Formulation of Polynomial Regression
The equation for Polynomial Regression is:

Where:
Y = Predicted output (dependent variable)
X = Input feature (independent variable)
b0,b1,...,bn = Coefficients for each term
n = Degree of the polynomial
For example, a quadratic model (degree 2) would be:

1.4 Choosing the Degree of Polynomial
Underfitting: When the degree is too low, the model may not capture the complexity of the data.
Overfitting: When the degree is too high, the model becomes too flexible, fitting noise and leading to poor generalization.
Optimal Degree: Chosen using Cross-Validation.
1.5 Advantages and Limitations of Polynomial Regression
Advantages:
Captures non-linear relationships.
Flexible model that can fit a wide range of data patterns.
Limitations:
Prone to overfitting with high degrees.
Sensitive to outliers.
Computationally expensive with high-dimensional data.
1.6 Implementation of Polynomial Regression in Python
Let's implement Polynomial Regression using the popular Python library scikit-learn.
Importing Libraries:
import numpy as np
import pandas as pd
import matplotlib.pyplot as plt
from sklearn.model_selection import train_test_split
from sklearn.preprocessing import PolynomialFeatures
from sklearn.linear_model import LinearRegression
from sklearn.metrics import mean_squared_error, r2_score
Loading the Dataset:
Dataset download link: dataset
data = pd.read_csv('/path/to/the/dataset')
X = data[['Area of the house(excluding basement)']]
y = data['Price']
Splitting Data into Training and Testing Sets:
X_train, X_test, y_train, y_test = train_test_split(X, y, test_size=0.2, random_state=42)
Creating Polynomial Features:
poly = PolynomialFeatures(degree=2)
X_train_poly = poly.fit_transform(X_train)
X_test_poly = poly.transform(X_test)
Training the Model:
model = LinearRegression()
model.fit(X_train_poly, y_train)
Making Predictions and Evaluating the Model:
y_pred = model.predict(X_test_poly)
mse = mean_squared_error(y_test, y_pred)
r2 = r2_score(y_test, y_pred)
print("Mean Squared Error:", mse)
print("R-squared:", r2)

Visualizing the Results:
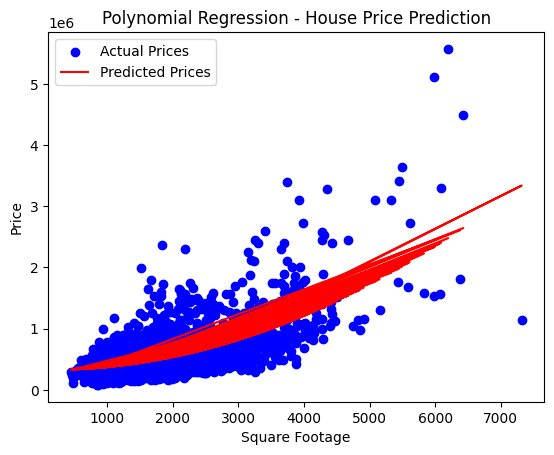
plt.scatter(X_test, y_test, color='blue', label='Actual Prices')
plt.plot(X_test, y_pred, color='red', label='Predicted Prices')
plt.xlabel('Square Footage')
plt.ylabel('Price')
plt.title('Polynomial Regression - House Price Prediction')
plt.legend()
plt.show()

2. Quantile Regression
Quantile Regression estimates the conditional quantiles (e.g., median, 25th percentile, 75th percentile) of the response variable, rather than the mean. It is particularly useful when the data has heterogeneous variance or outliers.
2.1 Why Use Quantile Regression?
When the relationship between the variables is not uniform across the distribution.
To understand the impact of predictors on different quantiles.
To predict the upper or lower bounds of a distribution (e.g., risk management).
2.2 Quantile Regression Equation:

Where:
Qy(τ∣X) = Conditional quantile function
τ = Quantile (e.g., 0.5 for median, 0.25 for 25th percentile)
b0,b1 = Coefficients
2.3 Implementation of Quantile Regression in Python
Importing Libraries:
import numpy as np
import pandas as pd
import matplotlib.pyplot as plt
from sklearn.model_selection import train_test_split
from sklearn.linear_model import QuantileRegressor
Loading the Dataset:
data = pd.read_csv('/path/to/the/dataset')
X = data[['Area of the house(excluding basement)']]
y = data['Price']
Splitting the data:
X_train, X_test, y_train, y_test = train_test_split(X, y, test_size=0.2, random_state=42)
Training the Model:
model = QuantileRegressor(quantile=0.5)
model.fit(X_train, y_train)
y_pred = model.predict(X_test)
Plotting the Result:
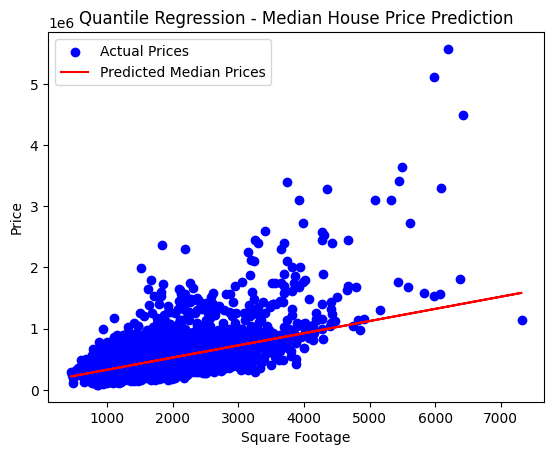
plt.scatter(X_test, y_test, color='blue', label='Actual Prices')
plt.plot(X_test, y_pred, color='red', label='Predicted Median Prices')
plt.xlabel('Square Footage')
plt.ylabel('Price')
plt.title('Quantile Regression - Median House Price Prediction')
plt.legend()
plt.show()

3. Real-world Applications
3.1 Polynomial Regression:
Modeling complex non-linear trends in sales forecasting.
Predicting disease progression in healthcare.
Estimating non-linear growth in population studies.
3.2 Quantile Regression:
Risk management in finance (predicting value at risk).
Predicting housing prices with upper and lower bounds.
Analyzing income distribution in economics.
4. Conclusion
Polynomial Regression is powerful for modeling non-linear relationships but requires careful selection of the degree to avoid overfitting.
Quantile Regression provides a more comprehensive view of the relationship between variables by predicting different quantiles.
Subscribe to my newsletter
Read articles from Tushar Pant directly inside your inbox. Subscribe to the newsletter, and don't miss out.
Written by

Tushar Pant
Tushar Pant
Cloud and DevOps Engineer with hands-on expertise in AWS, CI/CD pipelines, Docker, Kubernetes, and Monitoring tools. Adept at building and automating scalable, fault-tolerant cloud infrastructures, and consistently improving system performance, security, and reliability in dynamic environments.