Logistic Regression in Machine Learning
 Tushar Pant
Table of contents
- Introduction
- 1. What is Logistic Regression?
- 2. How Does Logistic Regression Work?
- 3. Mathematical Background
- 4. Types of Logistic Regression
- 5. Assumptions of Logistic Regression
- 6. Advantages and Disadvantages
- 7. Implementation in Python
- 8. Real-world Applications
- 9. Tips for Better Performance
- 10. Conclusion

Introduction
Logistic Regression is one of the most popular and fundamental algorithms used in Supervised Learning for classification tasks. Despite its name, it is a classification algorithm, not a regression one. It is widely used for binary classification problems like spam detection, cancer diagnosis, and customer churn prediction.
1. What is Logistic Regression?
Logistic regression is a supervised machine learning algorithm used for classification tasks where the goal is to predict the probability that an instance belongs to a given class or not.
It is a statistical model that uses a logistic function to model the probability of a binary outcome (0 or 1, Yes or No, True or False). It estimates the probability that a given input belongs to a certain category.
1.1 Why Use Logistic Regression?
Simple and easy to implement.
Efficient for binary and multiclass classification tasks.
Provides interpretable probabilities for class membership.
1.2 Example Use Cases:
Spam Detection: Classifying emails as spam or not spam.
Medical Diagnosis: Predicting whether a patient has a disease (Yes/No).
Customer Churn Prediction: Estimating the likelihood of a customer leaving a service.
2. How Does Logistic Regression Work?
Logistic Regression uses a Sigmoid Function to map predicted values to probabilities between 0 and 1. Based on a threshold (commonly 0.5), it assigns the data point to one of two classes.
2.1 Sigmoid Function:
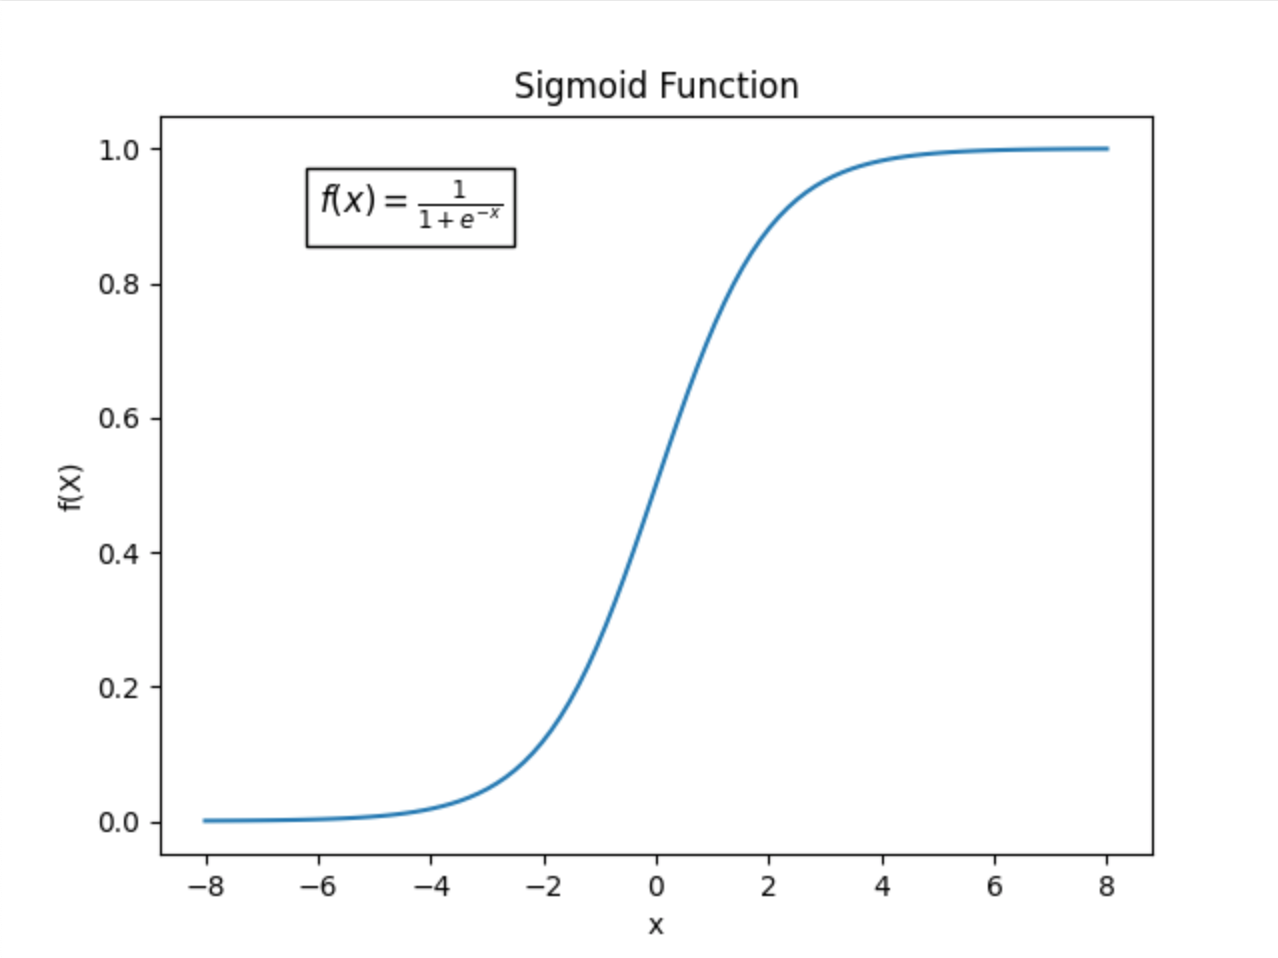
The sigmoid function is a mathematical function used to map the predicted values to probabilities.
It maps any real value into another value within a range of 0 and 1. The value of the logistic regression must be between 0 and 1, which cannot go beyond this limit, so it forms a curve like the “S” form.
The S-form curve is called the Sigmoid function or the logistic function. In logistic regression, we use the concept of the threshold value, which defines the probability of either 0 or 1.
Such as values above the threshold value tends to 1, and a value below the threshold values tends to 0.
The Sigmoid Function is given by:
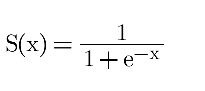
x is the input to the function (weighted sum of inputs).
e is the base of natural logarithms.
The output is a probability between 0 and 1.
2.2 Decision Boundary:
If S(x)≥0.5S(x) >= 0.5, classify as Class 1.
If S(x)<0.5S(x) < 0.5, classify as Class 0.
3. Mathematical Background
3.1 Hypothesis Function:
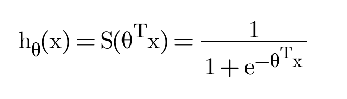
θ = Coefficients/Weights of the model
x = Input features
3.2 Cost Function:
Logistic Regression uses the Log Loss or Binary Cross-Entropy Loss function:
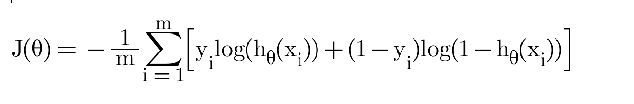
m = Number of training examples
yi = Actual label for the ith example
hθ(xi)= Predicted probability
3.3 Optimization (Gradient Descent):
To minimize the cost function, we use Gradient Descent:
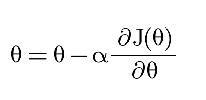
- α = Learning rate
4. Types of Logistic Regression
Binomial Logistic Regression: In Binomial Logistic regression, there can be only two possible types of the dependent variables, such as 0 or 1, Pass or Fail, etc.
Multinomial Logistic Regression: In multinomial Logistic regression, there can be 3 or more possible unordered types of the dependent variable, such as “cat”, “dogs”, or “sheep”
Ordinal Logistic Regression: In ordinal Logistic regression, there can be 3 or more possible ordered types of dependent variables, such as “low”, “Medium”, or “High”.
Multinomial regression is used when the dependent variable has multiple, unordered categories, while ordinal regression is used when the dependent variable has multiple, ordered categories
5. Assumptions of Logistic Regression
Binary Outcome Variable: For Binary Logistic Regression, the dependent variable should be binary.
No Multicollinearity: Input features should not be highly correlated.
Linearity of Predictors: The log odds of the dependent variable are linearly related to the independent variables.
Large Sample Size: Logistic Regression requires a large sample size for reliable results.
6. Advantages and Disadvantages
6.1 Advantages:
Easy to implement and interpret.
Outputs well-calibrated probabilities.
Efficient for binary classification problems.
Performs well when the relationship between the features and the target is linear.
6.2 Disadvantages:
Assumes a linear relationship between input features and the log odds.
Not suitable for non-linear decision boundaries.
Sensitive to outliers.
Requires a large sample size for stable results.
7. Implementation in Python
link to the dataset: dataset
Here’s how to implement Logistic Regression using Scikit-learn:
# Importing libraries
import numpy as np
import pandas as pd
from sklearn.model_selection import train_test_split
from sklearn.linear_model import LogisticRegression
from sklearn.metrics import accuracy_score, confusion_matrix, classification_report
# Load Dataset
data = pd.read_csv('/path/to/the/dataset') # Use any suitable dataset
data = pd.get_dummies(data, columns=['Gender'], drop_first=True)
X = data.iloc[:, :-1].values # Features
y = data.iloc[:, -1].values # Target Variable
# Split data into training and testing sets
X_train, X_test, y_train, y_test = train_test_split(X, y, test_size=0.2, random_state=42)
# Create Logistic Regression model
model = LogisticRegression()
model.fit(X_train, y_train)
# Make predictions
y_pred = model.predict(X_test)
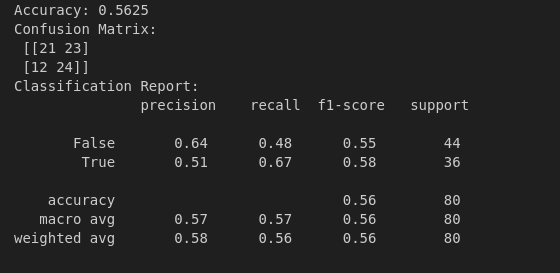
# Evaluate Model
print("Accuracy:", accuracy_score(y_test, y_pred))
print("Confusion Matrix:\n", confusion_matrix(y_test, y_pred))
print("Classification Report:\n", classification_report(y_test, y_pred))
8. Real-world Applications
Healthcare: Predicting the probability of a disease.
Finance: Loan default prediction.
Marketing: Customer churn prediction.
Social Media: Sentiment analysis.
9. Tips for Better Performance
Feature Scaling: Standardize or normalize input features for faster convergence.
Regularization: Use L1 or L2 regularization to avoid overfitting.
Feature Selection: Select relevant features to reduce dimensionality and improve accuracy.
Hyperparameter Tuning: Optimize hyperparameters using Grid Search or Random Search.
10. Conclusion
Logistic Regression is a powerful and straightforward classification algorithm suitable for binary and multiclass classification tasks. It is easy to interpret and performs well on linearly separable datasets. However, it struggles with complex non-linear decision boundaries.
10.1 When to Use Logistic Regression:
When the relationship between input features and the target is approximately linear.
For binary classification problems.
When you need a probabilistic interpretation of class membership.
10.2 Key Takeaways:
Logistic Regression is used for classification, not regression.
It uses a Sigmoid Function to map predictions to probabilities.
It is sensitive to outliers and multicollinearity.
Regularization techniques can improve performance and prevent overfitting.
Subscribe to my newsletter
Read articles from Tushar Pant directly inside your inbox. Subscribe to the newsletter, and don't miss out.
Written by