k-Nearest Neighbors (k-NN)
 Tushar Pant
Table of contents
- Introduction
- 1. What is k-Nearest Neighbors (k-NN)?
- 2. How Does k-NN Work?
- 3. Key Features and Characteristics
- 4. Distance Metrics in k-NN
- 5. Choosing the Right Value of k
- 6. Advantages and Disadvantages
- 7. Implementation of k-NN in Python
- 8. Real-world Applications
- 9. Tips for Better Performance
- 10. Conclusion

Introduction
The k-Nearest Neighbors (k-NN) algorithm is one of the simplest yet most effective supervised learning algorithms. It is widely used for both classification and regression tasks due to its simplicity, versatility, and effectiveness in capturing complex patterns without making strong assumptions about the data distribution.
1. What is k-Nearest Neighbors (k-NN)?
k-NN is a non-parametric and instance-based learning algorithm. It does not make any assumptions about the underlying data distribution, making it a versatile and powerful model.
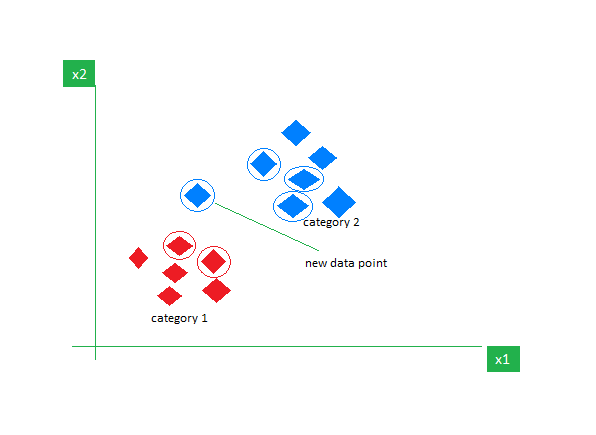
1.1 How Does k-NN Classify Data?
The algorithm stores the entire training dataset as reference points.
When a new data point is to be classified, it finds the k nearest neighbors from the training set based on a chosen distance metric (e.g., Euclidean distance).
The class label is assigned based on the majority class of the nearest neighbors.
In regression tasks, the predicted value is the average of the k-nearest neighbors' values.
1.2 Why Use k-NN?
Simplicity: Easy to implement and understand.
No Training Phase: k-NN is a lazy learner, meaning it doesn't explicitly train a model but makes predictions using the entire dataset.
Versatility: Works for both classification and regression tasks.
2. How Does k-NN Work?
Let's break down the working of k-NN into simple steps:
.png)
Step 1: Selecting the optimal value of K
- K represents the number of nearest neighbors that needs to be considered while making prediction.
Step 2: Calculate Distance
- For a new data point, the distance to each training point is calculated using a distance metric (e.g., Euclidean, Manhattan, or Minkowski distance).
Step 3: Find k Nearest Neighbors
- The k closest neighbors are selected based on the smallest distances.
Step 4: Voting Mechanism
Classification: The majority class among the k neighbors is assigned as the class label.
Regression: The mean or median value of the k neighbors is assigned as the predicted value.
When you want to classify a data point into a category (like spam or not spam), the K-NN algorithm looks at the K closest points in the dataset. These closest points are called neighbors. The algorithm then looks at which category the neighbors belong to and picks the one that appears the most. This is called majority voting.
In regression, the algorithm still looks for the K closest points. But instead of voting for a class in classification, it takes the average of the values of those K neighbors. This average is the predicted value for the new point for the algorithm.
It shows how a test point is classified based on its nearest neighbors. As the test point moves the algorithm identifies the closest ‘k’ data points i.e 5 in this case and assigns test point the majority class label that is grey label class here.
Step 5: Return Result
- The predicted label or value is returned as the output.
3. Key Features and Characteristics
Instance-based Learning: k-NN memorizes the training data rather than learning explicit decision boundaries.
Non-parametric: No assumptions are made about the underlying data distribution.
Lazy Learning: There is no explicit training phase, and computations are deferred to the prediction phase.
Distance-based Classification: The algorithm relies on distance metrics to classify data points.
4. Distance Metrics in k-NN
Choosing the right distance metric is crucial for the performance of k-NN. Some popular metrics are:
4.1 Euclidean Distance:
Most commonly used metric, representing the straight line distance between two points.

4.2 Manhattan Distance:
Sum of absolute differences between points. Suitable for grid-like data.

4.3 Minkowski Distance:
Generalized form of Euclidean and Manhattan distances.

p=2p = 2: Euclidean Distance
p=1p = 1: Manhattan Distance
4.4 Hamming Distance:
Used for categorical data, measuring the number of mismatched elements.
5. Choosing the Right Value of k
The choice of k has a significant impact on the performance of the k-NN algorithm:
Small k: High variance, low bias (overfitting risk).
Large k: High bias, low variance (underfitting risk).
Tips for Choosing k:
Square root heuristic:

where N is the number of data points.
Cross-Validation: A robust method for selecting the best k is to perform k-fold cross-validation. This involves splitting the data into k subsets training the model on some subsets and testing it on the remaining ones and repeating this for each subset. The value of k that results in the highest average validation accuracy is usually the best choice.
Elbow Method: In the elbow method we plot the model’s error rate or accuracy for different values of k. As we increase k the error usually decreases initially. However after a certain point the error rate starts to decrease more slowly. This point where the curve forms an “elbow” that point is considered as best k.
Odd Values for k: It’s also recommended to choose an odd value for k especially in classification tasks to avoid ties when deciding the majority class.
6. Advantages and Disadvantages
6.1 Advantages:
Simple and Easy to Implement: No explicit training required.
Versatility: Can be used for both classification and regression tasks.
No Assumptions: Non-parametric model, suitable for non-linear decision boundaries.
6.2 Disadvantages:
Computationally Expensive: High memory and time complexity for large datasets.
Sensitive to Noise: Outliers can affect predictions.
Feature Scaling Required: Sensitive to the magnitude of input features.
Curse of Dimensionality: Performance decreases with high-dimensional data.
7. Implementation of k-NN in Python
Let's implement a k-NN classifier using Scikit-learn:
# Import necessary libraries
import numpy as np
from sklearn import datasets
from sklearn.model_selection import train_test_split
from sklearn.preprocessing import StandardScaler
from sklearn.neighbors import KNeighborsClassifier
from sklearn.metrics import accuracy_score, classification_report, confusion_matrix
import seaborn as sns
import matplotlib.pyplot as plt

# Load the Iris dataset
iris = datasets.load_iris()
X = iris.data
y = iris.target

# Split the data into training and testing sets
X_train, X_test, y_train, y_test = train_test_split(X, y, test_size=0.3, random_state=42)

# Feature scaling
scaler = StandardScaler()
X_train = scaler.fit_transform(X_train)
X_test = scaler.transform(X_test)

# Instantiate the k-NN classifier with k=5
k = 5
model = KNeighborsClassifier(n_neighbors=k)
model.fit(X_train, y_train)

# Make predictions
y_pred = model.predict(X_test)

# Evaluate the model
print("Accuracy:", accuracy_score(y_test, y_pred))
print("Classification Report:\n", classification_report(y_test, y_pred))

# Confusion matrix visualization
conf_matrix = confusion_matrix(y_test, y_pred)
sns.heatmap(conf_matrix, annot=True, cmap='Blues')
plt.title('Confusion Matrix')
plt.xlabel('Predicted')
plt.ylabel('True')
plt.show()


8. Real-world Applications
Recommendation Systems: Product recommendations in e-commerce.
Medical Diagnosis: Disease prediction using patient symptoms.
Image Recognition: Object and facial recognition tasks.
Credit Scoring: Risk assessment for loan approvals.
Anomaly Detection: Identifying fraudulent transactions.
9. Tips for Better Performance
Feature Scaling: Standardize or normalize input features for distance calculation.
Dimensionality Reduction: Use PCA or LDA to reduce dimensions and improve efficiency.
Cross-validation: Use k-fold cross-validation to find the optimal value of k.
Weighted k-NN: Assign weights to neighbors based on distance to improve accuracy.
10. Conclusion
k-Nearest Neighbors is a simple yet effective algorithm that excels at pattern recognition by leveraging proximity-based learning. Its versatility and ease of implementation make it a valuable tool for both beginners and experienced data scientists.
Subscribe to my newsletter
Read articles from Tushar Pant directly inside your inbox. Subscribe to the newsletter, and don't miss out.
Written by
Tushar Pant
Tushar Pant
Cloud and DevOps Engineer with hands-on expertise in AWS, CI/CD pipelines, Docker, Kubernetes, and Monitoring tools. Adept at building and automating scalable, fault-tolerant cloud infrastructures, and consistently improving system performance, security, and reliability in dynamic environments.