Inventory Data Management Through Automation
 Jogleen Calipon
Table of contents

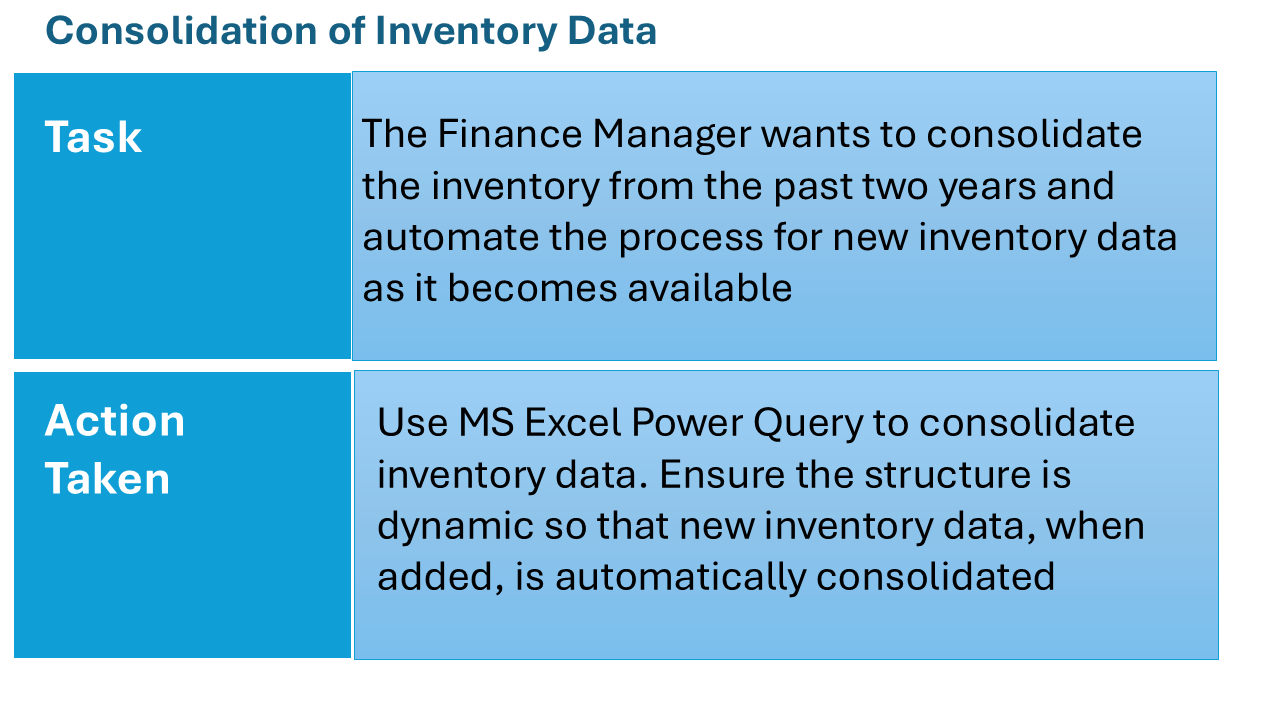
Preparation and Setup
Tools used for automation: Excel, Power Query, & M Code
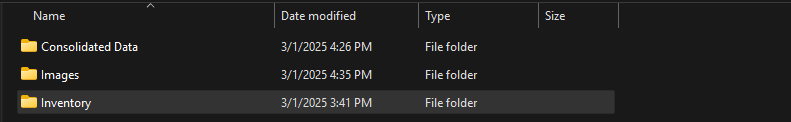
Created two folders, respectively for Inventory Data and the Consolidated Data
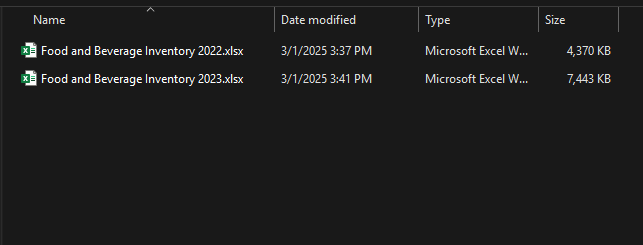
Contents of the Inventory Folder:
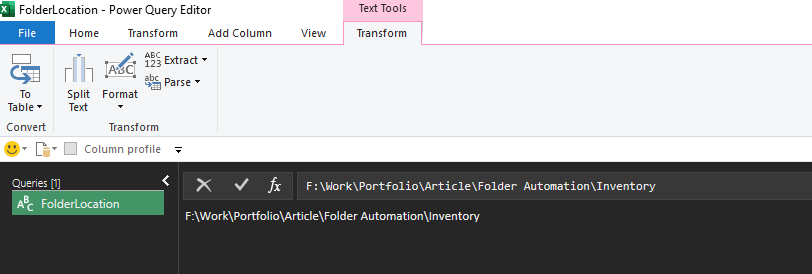
Loading the data
I created a new Excel workbook and saved it in the Consolidated Data folder. I then opened the Power Query to create a variable for the local path of the source data (Inventory Folder)
Consolidating Data
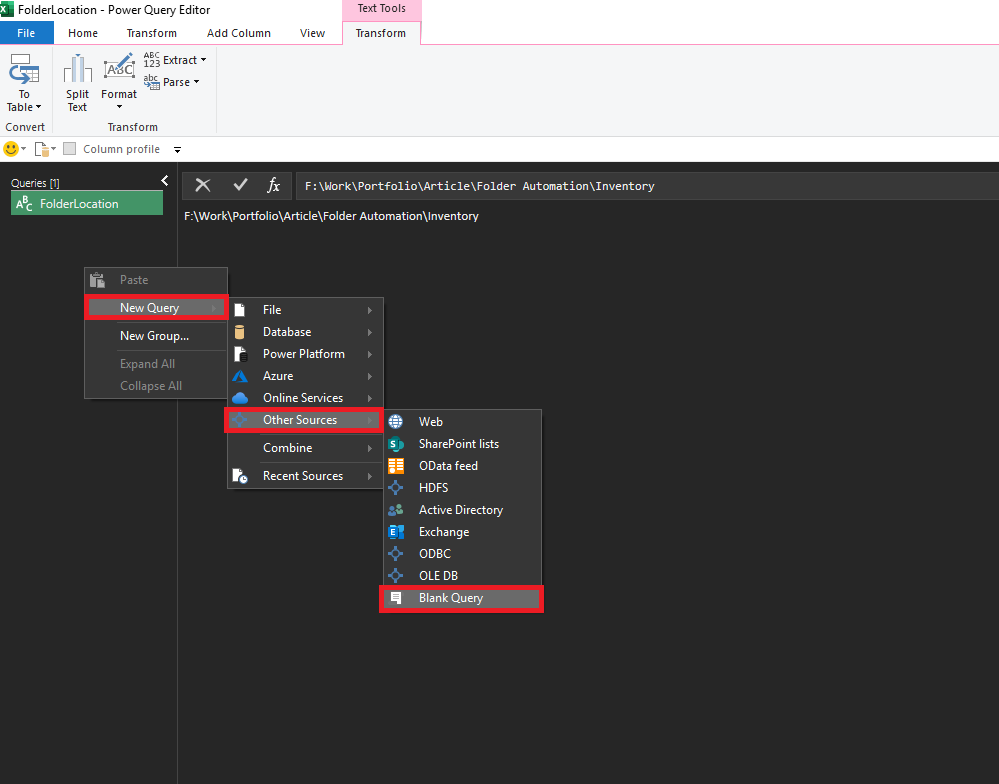
I then started to create a blank query to use the variable folder I created earlier
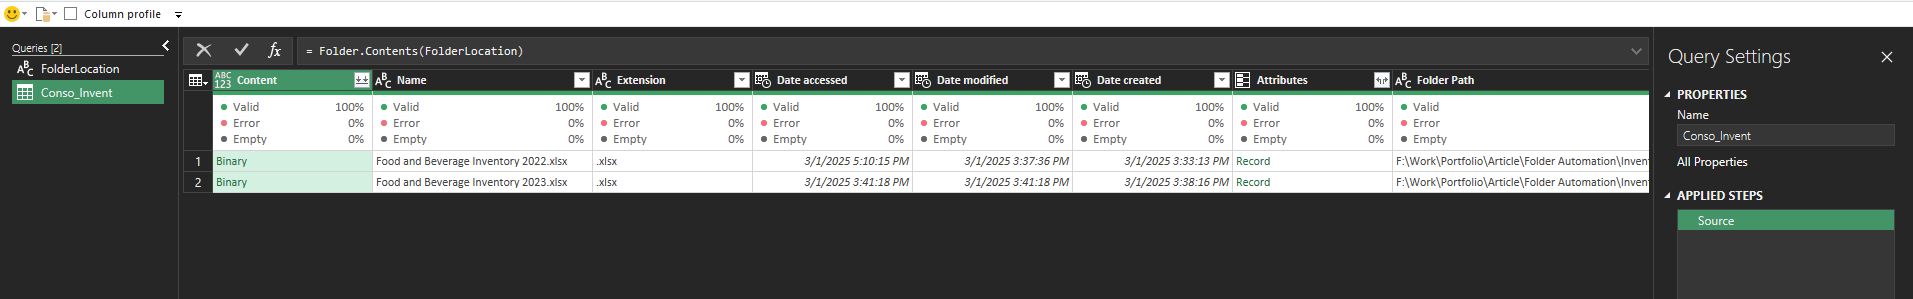
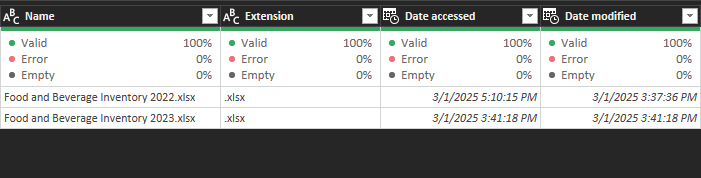
A closer snapshot of the workbooks has been fetched inside the folder. The next step is to have these workbooks stored in a table along with their contents
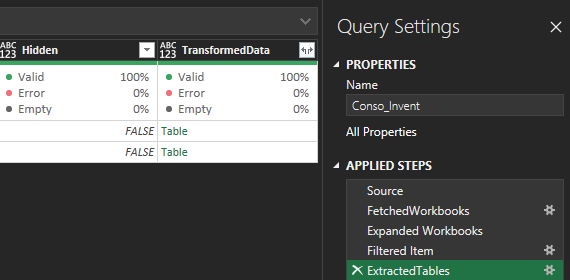
The next step is to transform the columns of the table, and we can do that by using the Table.TransformColumns function (M code)
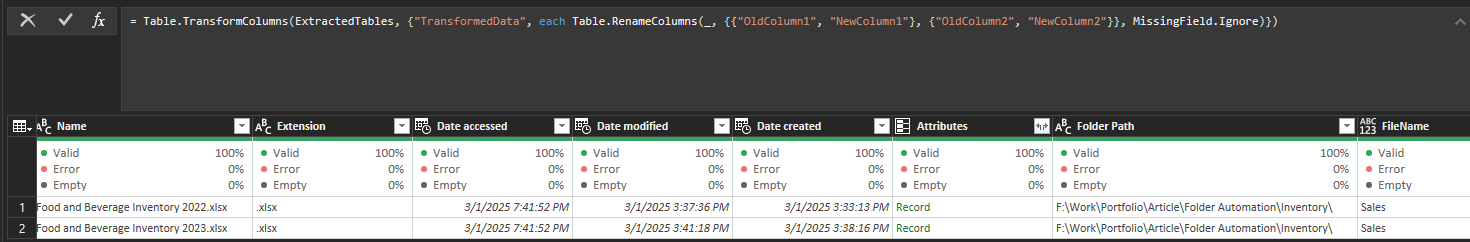
This is to ensure that columns are standardized before the appending process takes place
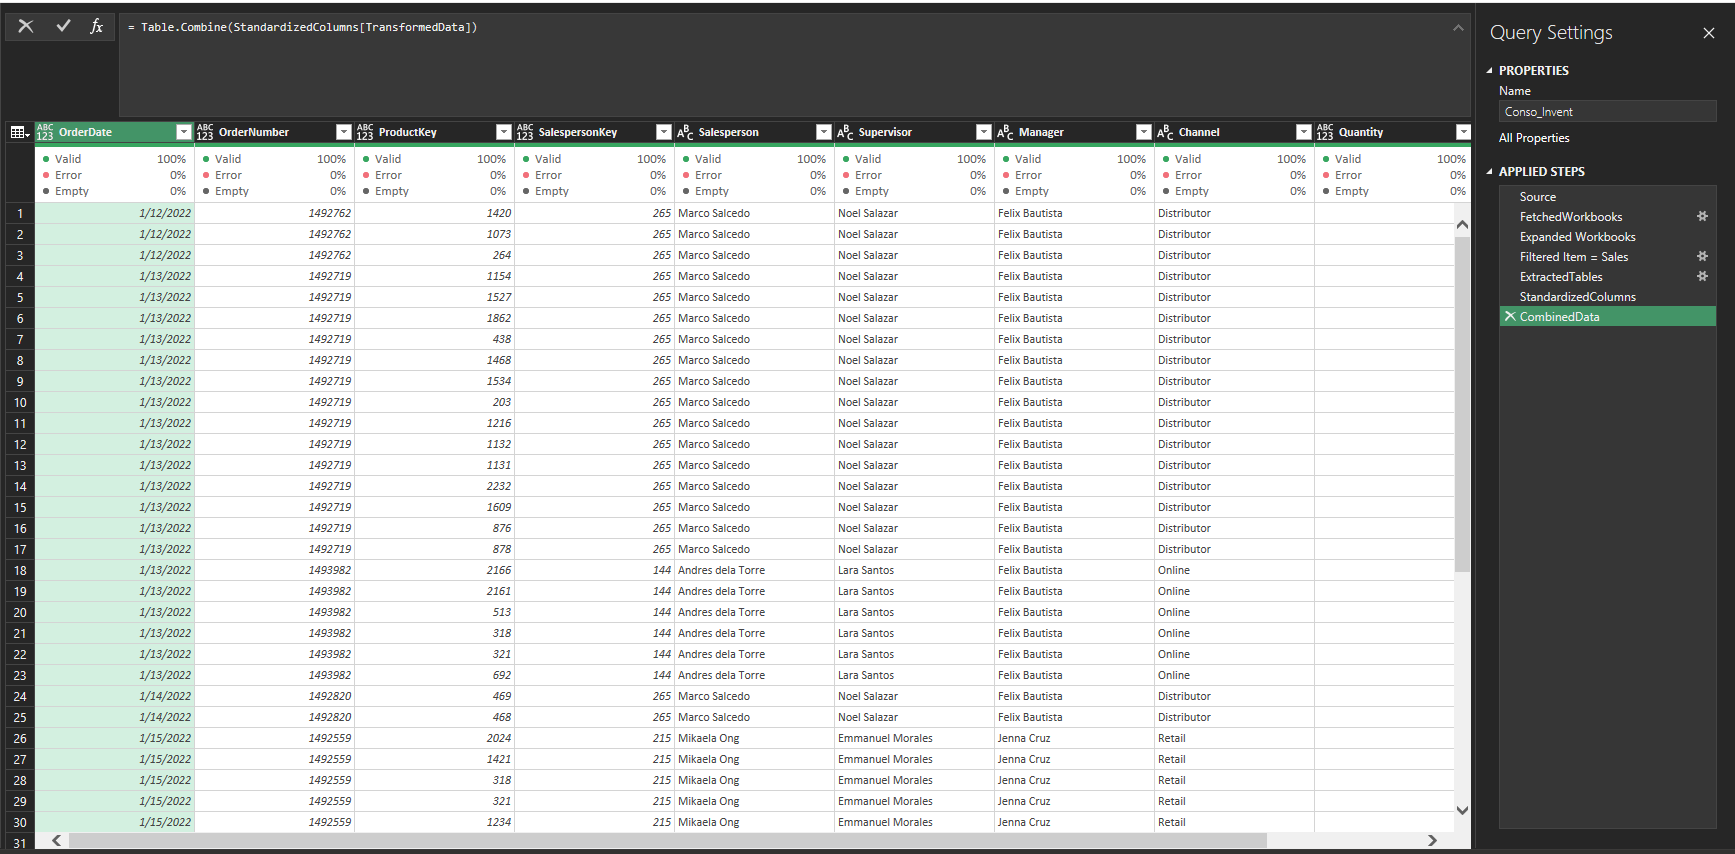
Now for the final query. We will need to combine all the data. We will be using the Table.Combine function
Let’s load the data as a table to finalize it
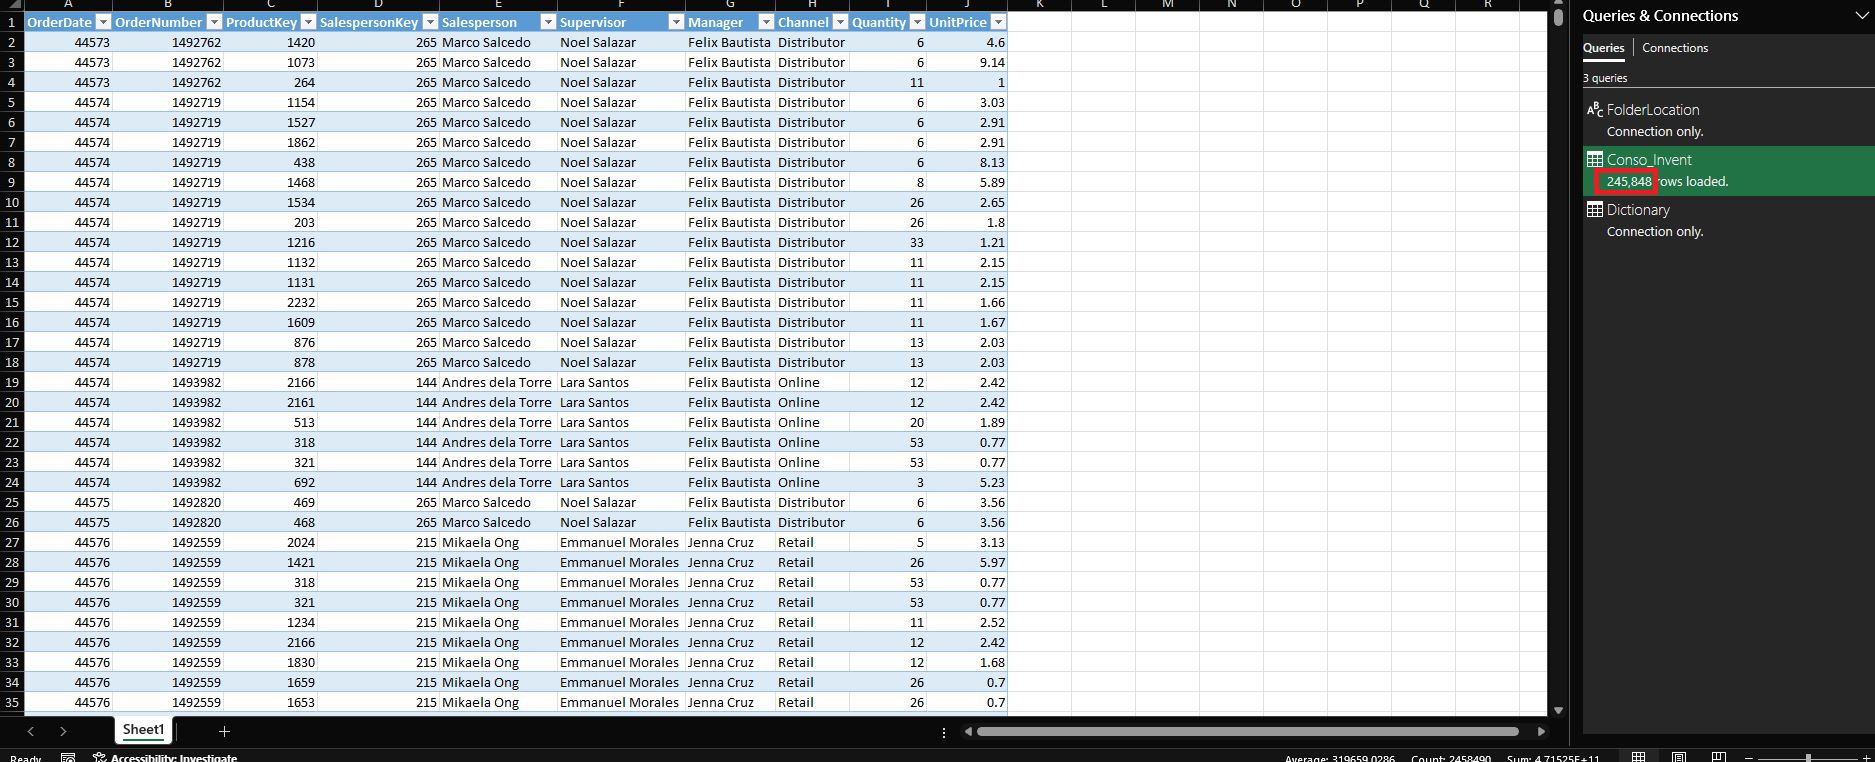
We consolidated a total of 245,848 rows. To verify this, I have taken a snapshot of each dataset
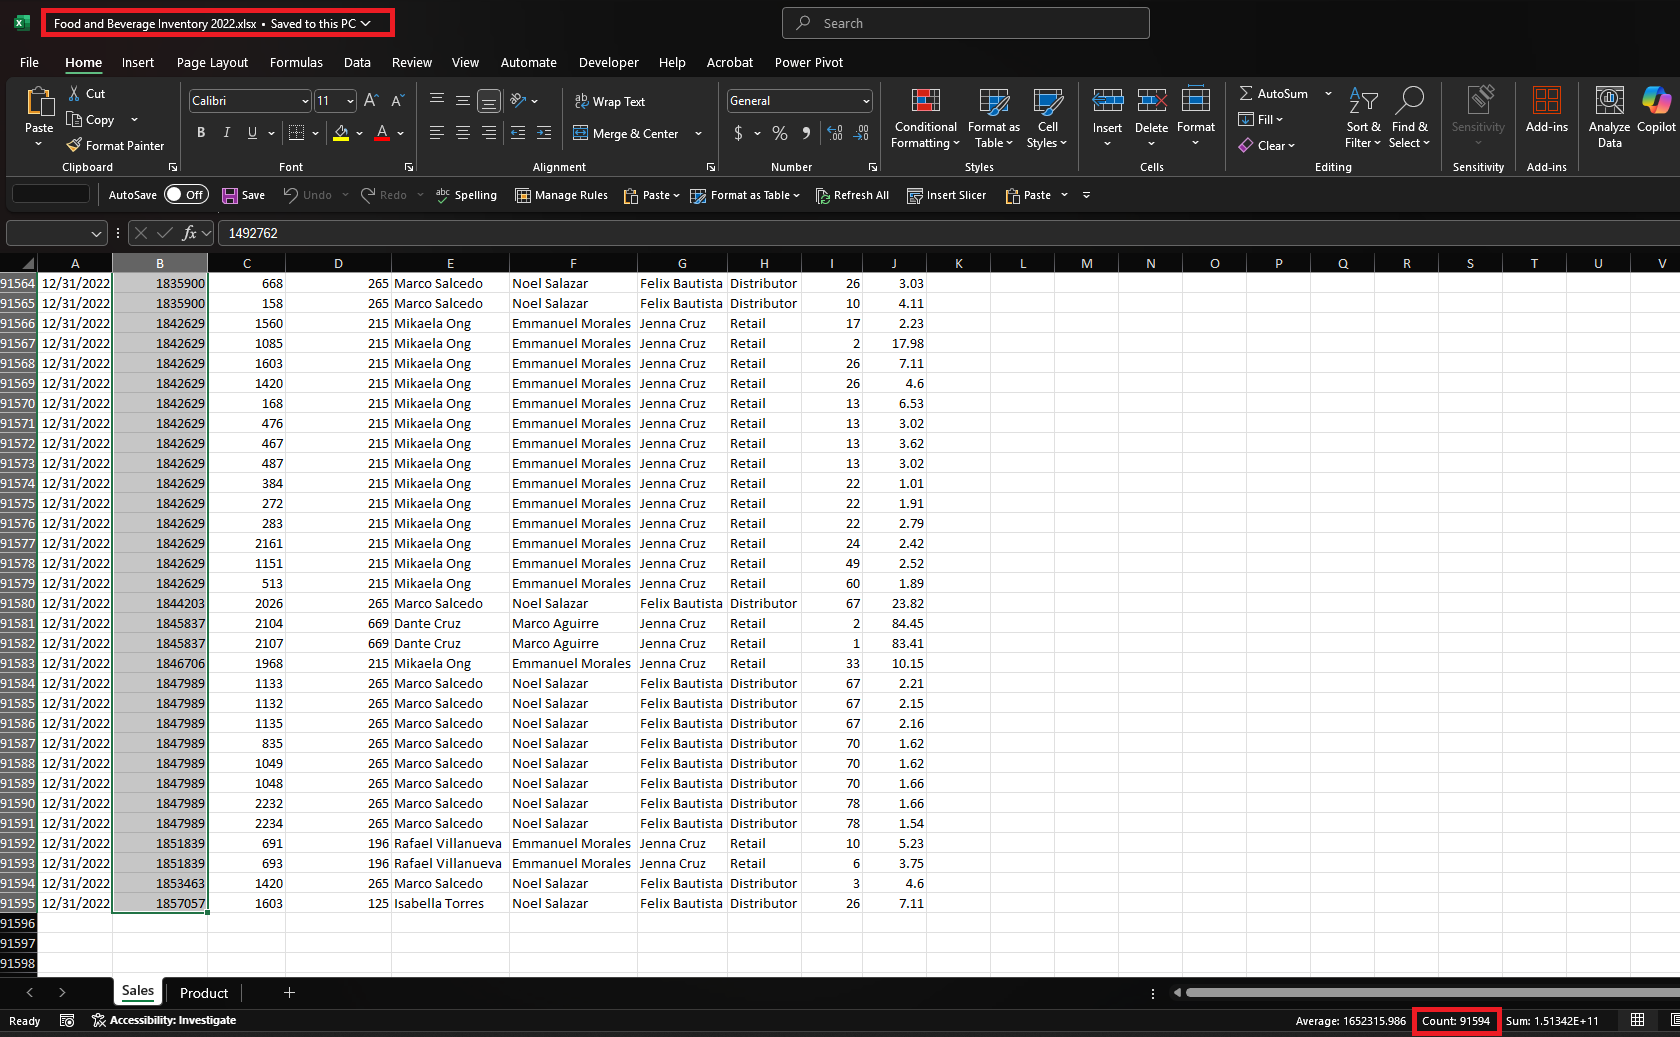
For Food and Beverage Inventory 2022, we have a total of = 91594,
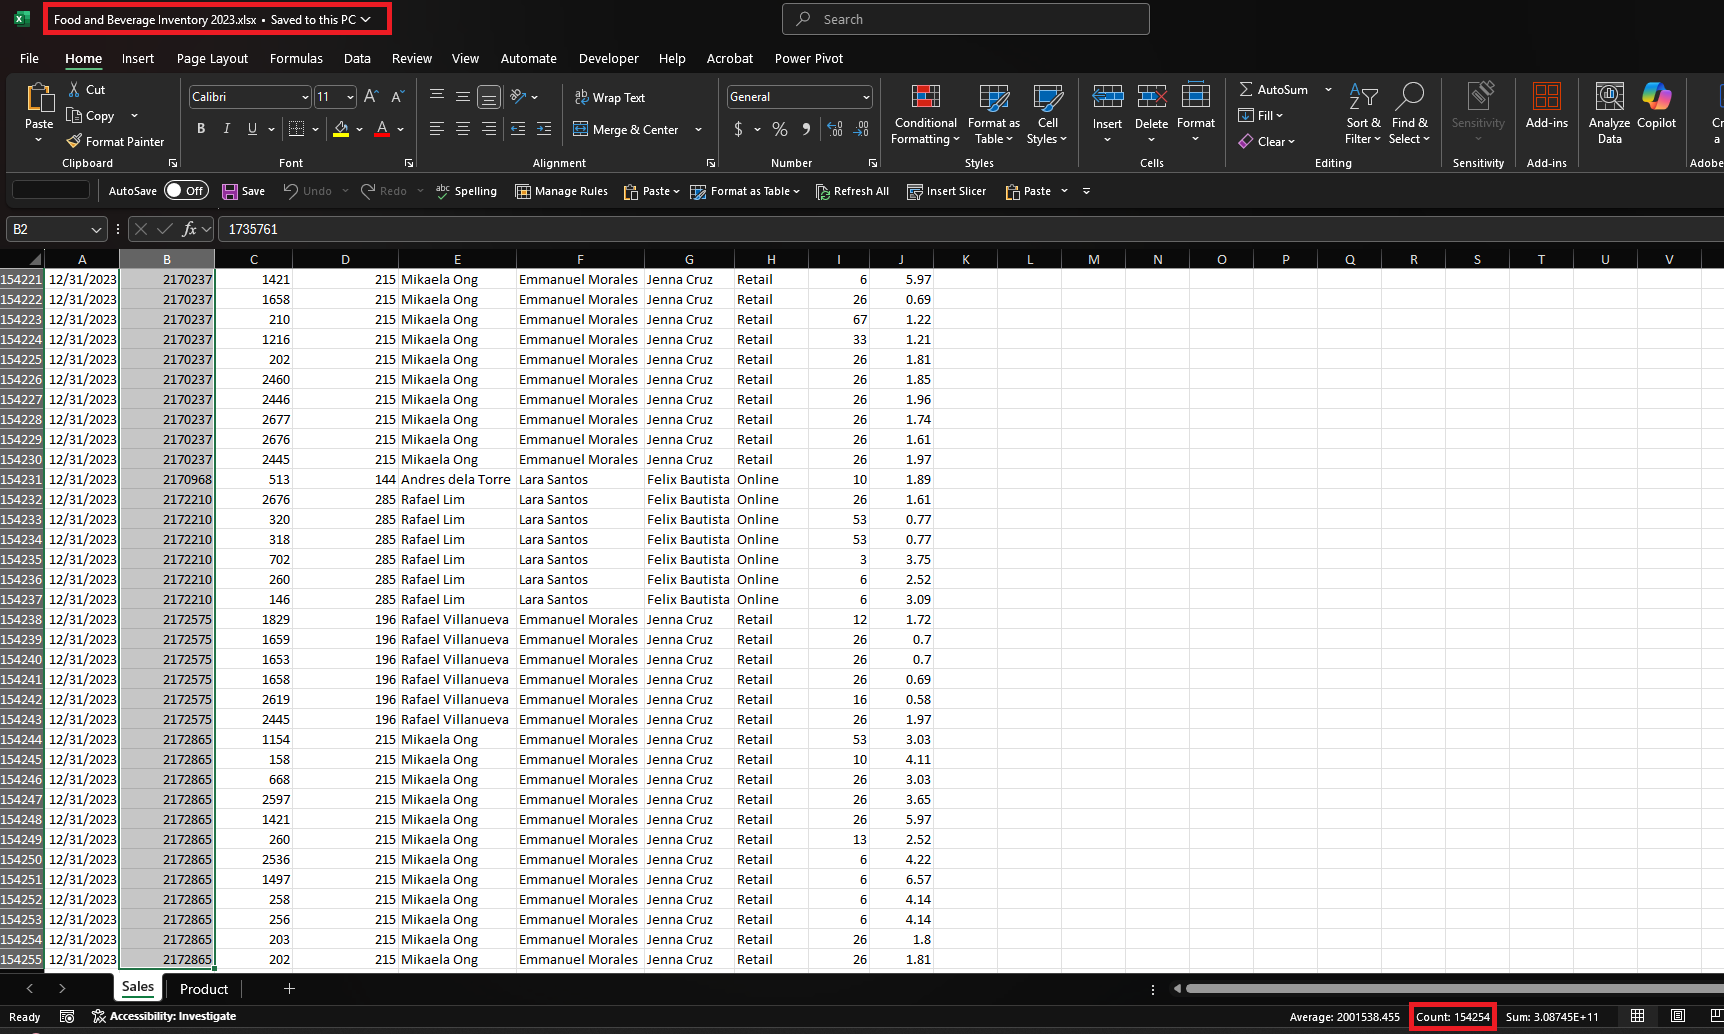
For Food and Beverage Inventory 2023, we have a total of = 154254
Total of 245,848
Once the new inventory data for 2024 is available, the end user can simply upload it to the folder to trigger the automation.
If you want to follow the same approach, I've included the code I used for this method.
let
Source = Folder.Contents(FolderLocation), FetchedWorkbooks = Table.AddColumn(Source, "Workbooks", each Excel.Workbook([Content])), #"Expanded Workbooks" = Table.ExpandTableColumn(FetchedWorkbooks, "Workbooks", {"Name", "Data", "Item", "Kind", "Hidden"}, {"FileName", "Data", "Item", "Kind", "Hidden"}), #"Filtered Item = Sales" = Table.SelectRows(#"Expanded Workbooks", each ([Item] = "Sales")), ExtractedTables = Table.AddColumn(#"Filtered Item = Sales", "TransformedData", each Table.PromoteHeaders([Data])), StandardizedColumns = Table.TransformColumns(ExtractedTables, {"TransformedData", each Table.RenameColumns(_, {{"OldColumn1", "NewColumn1"}, {"OldColumn2", "NewColumn2"}}, MissingField.Ignore)}), CombinedData = Table.Combine(StandardizedColumns[TransformedData])
inCombinedData
To fully utilize the code, please make sure to follow these instructions:
Make sure to create a folder for the inventory data
Make sure to have a uniform worksheet name in every workbook (Sales, Inventory, etc.)
Make sure to delete empty rows before the data in each workbook
Results
Once implemented, this solution will streamline data consolidation, reducing manual effort and minimizing human error. By ensuring accurate and timely data, it will empower data-driven decision-making, ultimately enhancing strategic planning and optimizing resource allocation within the organization
Subscribe to my newsletter
Read articles from Jogleen Calipon directly inside your inbox. Subscribe to the newsletter, and don't miss out.
Written by
Jogleen Calipon
Jogleen Calipon
👋 Welcome to My Profile! I'm a Data Analyst with over four years of experience turning data into meaningful insights that drive smart business decisions. Whether it's building automated reports, uncovering operational inefficiencies, or creating interactive dashboards that tell a clear story—I'm passionate about using data to solve real-world problems. 💡 What I Do Best Data Preparation: Cleaning, shaping, and enriching messy datasets Data Analysis: Extracting insights to inform decisions Automation: Streamlining recurring reports and building data entry forms Business Reporting: Creating reports tailored to decision-makers Visualization: Designing dashboards that make data easy to understand Collaboration: Translating technical findings for non-technical audiences 🛠️ Tools & Technologies Spreadsheets & Data Processing Microsoft Excel: Power Query, Power Pivot, DAX, advanced lookup functions, custom automation workflows Business Intelligence Power BI: Interactive dashboards and visual storytelling Databases & SQL Foundational knowledge of MS SQL Server, MySQL, BigQuery, and MS Access Experience writing basic to intermediate SQL queries Programming Python: Foundational experience with Pandas, NumPy, SciPy, Seaborn, and Matplotlib for data analysis and visualization R: Working knowledge of data wrangling, ggplot2, and statistical modeling 🚀 Let's Connect I'm currently open to short-term projects and part-time roles where I can contribute to: Optimizing processes Unlocking insights hidden in data Building scalable, automated solutions Thanks for visiting my profile! Feel free to explore my projects and reach out for collaboration or just to connect. 😊