How to Create Data Visualizations with Amazon QuickSight and S3
 VIKRANT SARADE
Introduction
In today's data-driven world, turning raw information into actionable insights is crucial. Data visualization is key to this transformation. In this guide, we explore the powerful combination of AWS QuickSight and Amazon S3, demonstrating how they can turn your data into engaging visual representations. Whether you're an entrepreneur, data analyst, or executive, this guide will help you fully utilize AWS QuickSight's data visualization features.
📊 What is AWS QuickSight?
AWS QuickSight is a cloud-based business intelligence (BI) and data visualization service offered by Amazon Web Services (AWS). It allows organizations to create and share interactive dashboards, visualizations, and reports using data stored in various AWS services, databases, or third-party sources.
QuickSight is fully managed, meaning AWS handles the infrastructure, scaling, and availability for you, so you can focus on analyzing your data.
📈 Use Cases
| Use Case | Example |
| Business Analytics | Sales, marketing, and operations performance dashboards |
| Operational Monitoring | Real-time monitoring of cloud infrastructure, serverless apps, etc. |
| Financial Reporting | Budget vs. actuals, financial KPIs |
| Customer Analytics | Customer behavior, segmentation, churn analysis |
| IoT Data Visualization | Real-time device performance and sensor data dashboards |
📦 What is AWS S3?
Amazon Simple Storage Service (Amazon S3) is a scalable, durable, and highly available object storage service provided by AWS. It allows you to store and retrieve any amount of data at any time, making it ideal for backups, data lakes, static website hosting, and much more.
Prerequisites
Before diving into the world of data visualization with AWS QuickSight and Amazon S3, make sure you meet the following prerequisites:
AWS Account: You should have an AWS account or sign up for a Free-Tier Account if you don't have one already.
Dataset Files: Download the provided dataset files:
listeners.csvandlisteners.json. (you can find these files in my git hub repository : repo link )
Key Steps
Data Source: Start by obtaining your dataset. For example, you can use Spotify data on artists and listeners, which is easily available on platforms like Kaggle.
Creating an S3 Bucket and Uploading Data: Set up an S3 bucket on AWS, upload your dataset files (
listeners.csvandlisteners.json), and configure the manifest file.Setting up AWS QuickSight: Sign up for AWS QuickSight, choose your preferred authentication methods, and grant access to your S3 bucket to enable seamless data integration.
Visualize Your Data on AWS QuickSight: Create a new dataset within AWS QuickSight, connect it to your S3 data source, and start visualizing your data. Explore various visualization options and apply filters to gain valuable insights.
Additional Practice: AWS QuickSight offers advanced features for data visualization and analysis. Explore data source connectivity, data preparation, interactive dashboards, custom calculations, and usage monitoring to enhance your data analysis skills.
Data Source
Let’s first get our data to work with. You can get your date from Kaggle. They offer Plenty of datasets that you can use. I chose a dataset that contains Spotify data showing artists and the number of listers they have. You can choose any of the datasets they provide. You can find the Spotify Dataset here.
Creating an S3 Bucket and Uploading the Data
Log into your AWS account
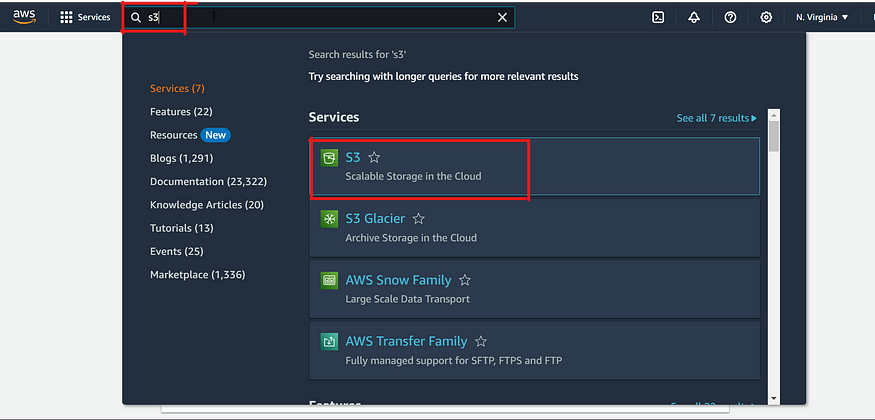
On the search box, search for “S3” and click on the first option that appears.
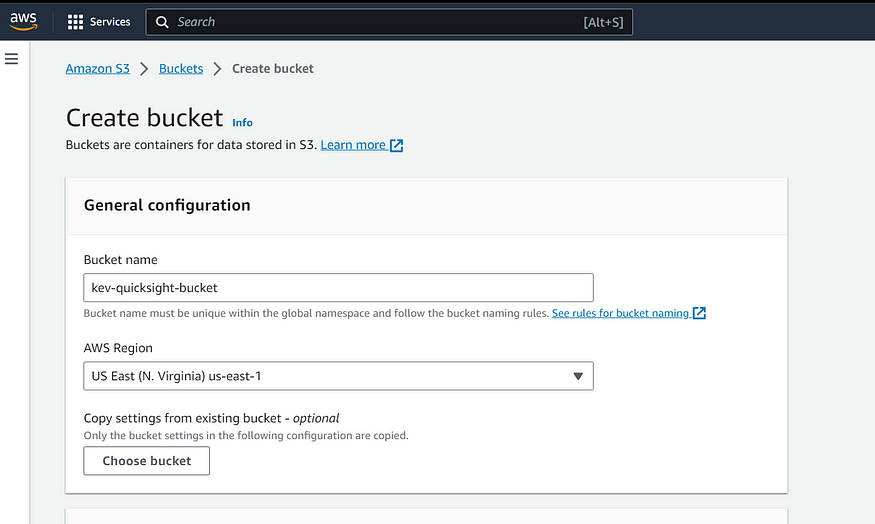
Give the bucket a name (the bucket name should be unique compared to all other active buckets within the region from all AWS users) and select the region to have your S3-bucket
4. Give the bucket a name and select the region to have your S3-bucket. All other settings can be left as default (Feel free to go through them and edit where you deem fit)
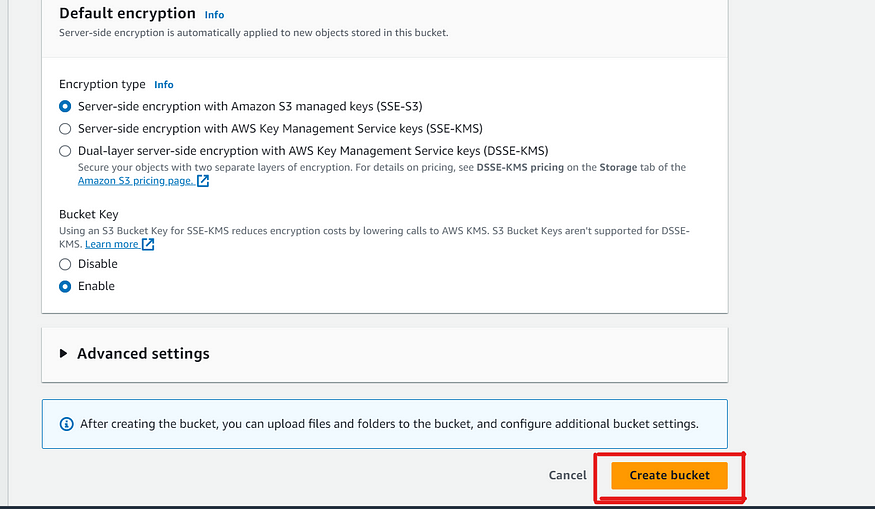
5. Click on “Create bucket” at the bottom of the page
6. The bucket should then appear in your “buckets” list
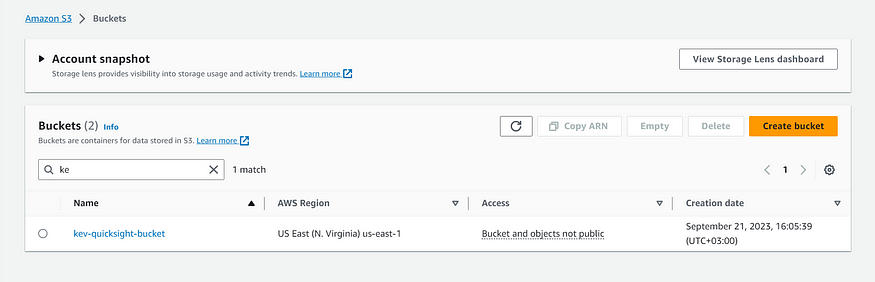
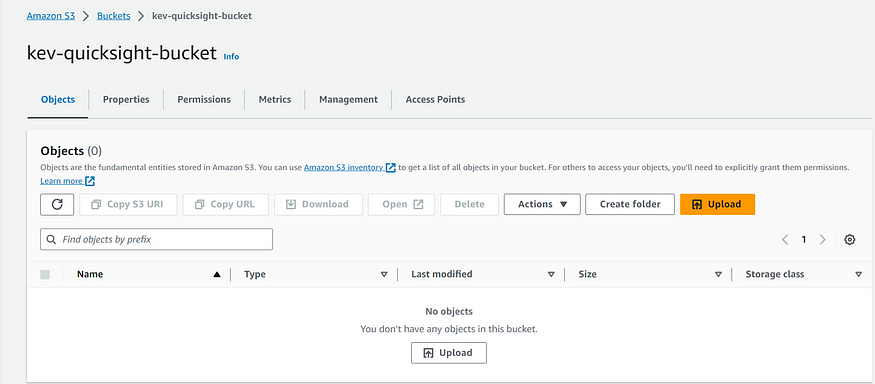
7. Click on the bucket name
8. Let’s have a look at the manifest file:
{
   "fileLocations": [
       {
           "URIs": [
               "s3://BUCKET-NAME/listeners.csv"
           ]
       }
   ],
   "globalUploadSettings": {
       "format": "CSV",
       "delimiter": ",",
       "textqualifier": "\"",
       "containsHeader": "true"
   }
}
The manifest file is used by AWS QuickSight to get the data source. You can have a look at the description and structure of the manifest file here. Move to the URIs and edit it by replacing ‘BUCKET-NAME’ with the name of your bucket. Save the file
In our case, it will be as follows:
{
   "fileLocations": [
       {
           "URIs": [
               "s3://kev-quicksight-bucket/listeners.csv"
           ]
       }
   ],
   "globalUploadSettings": {
       "format": "CSV",
       "delimiter": ",",
       "textqualifier": "\"",
       "containsHeader": "true"
   }
}
8. Click on “Upload” (They are 2, any can do)
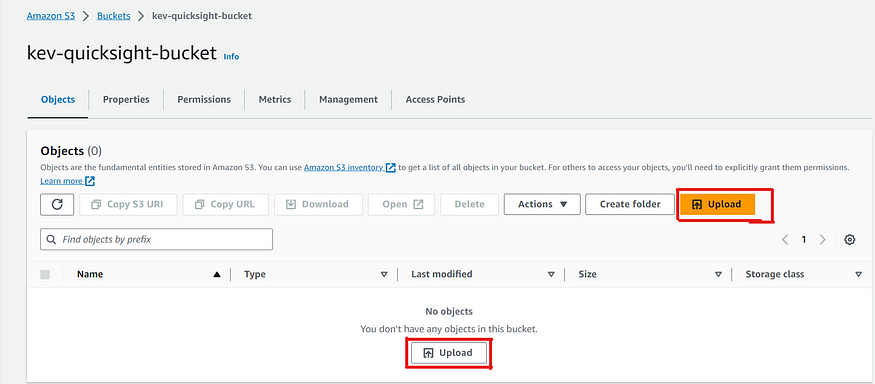
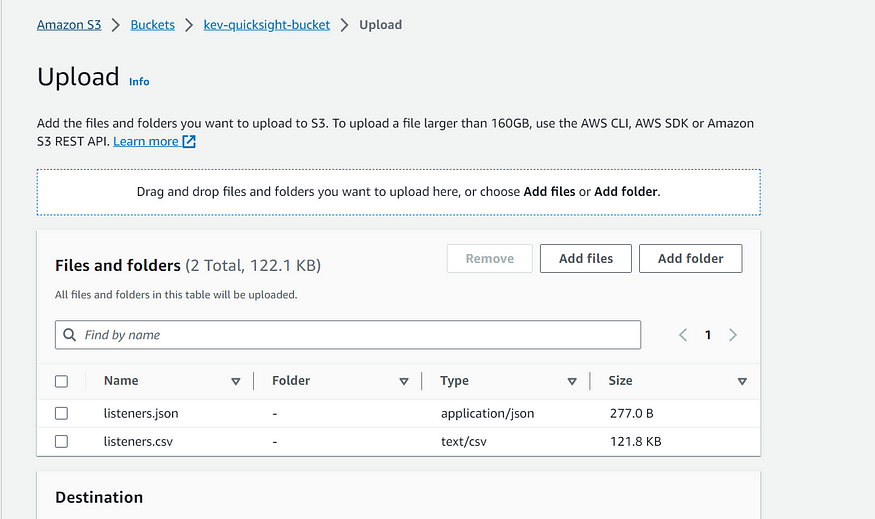
9. On the upload page, Click on “Add files” then navigate your local storage to the listeners.csv and listeners.json files that we downloaded. You may also drag and drop them onto the page.
10. Click on Upload at the bottom of the page
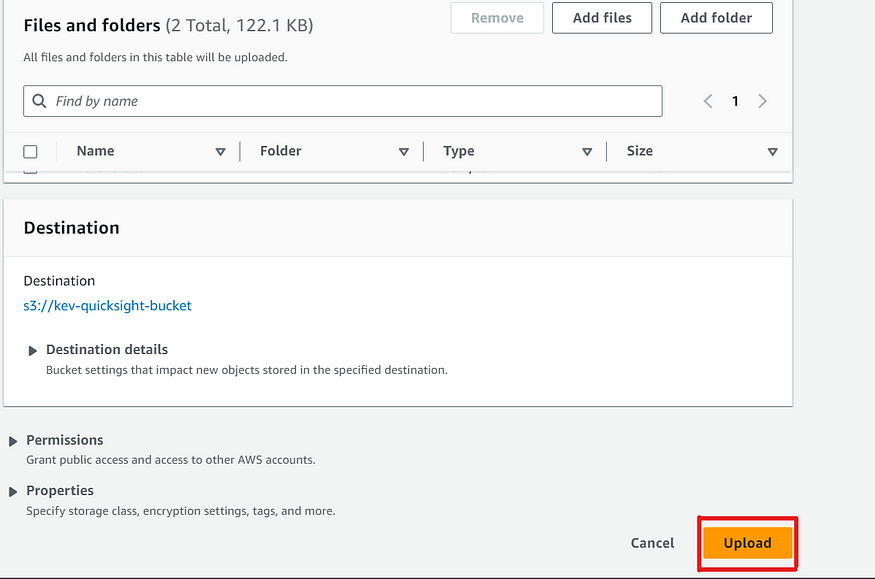
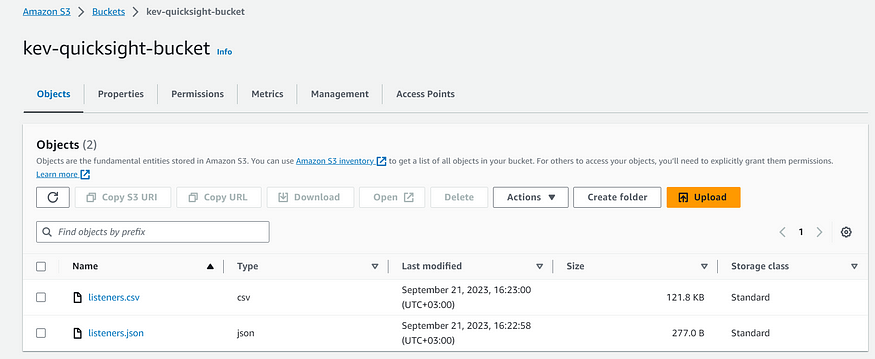
11. The files are uploaded and are now visible on S3
Setting up AWS QuickSight
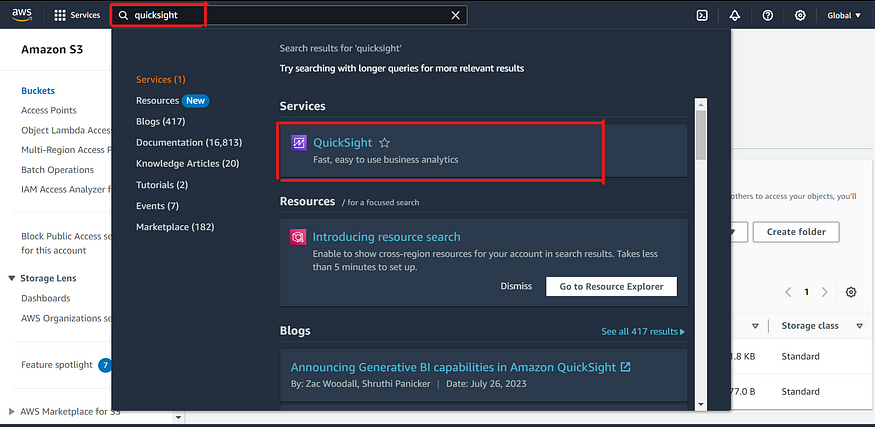
- On the Services search bar at the top, searck for ‘quicksight’ and select the first option that appears
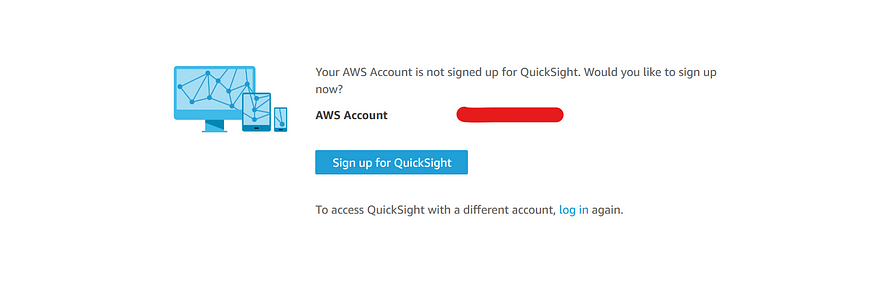
2. In the event you have not signed up for AWS QuickSight on your account, Click on ‘Sign up for QuickSight”
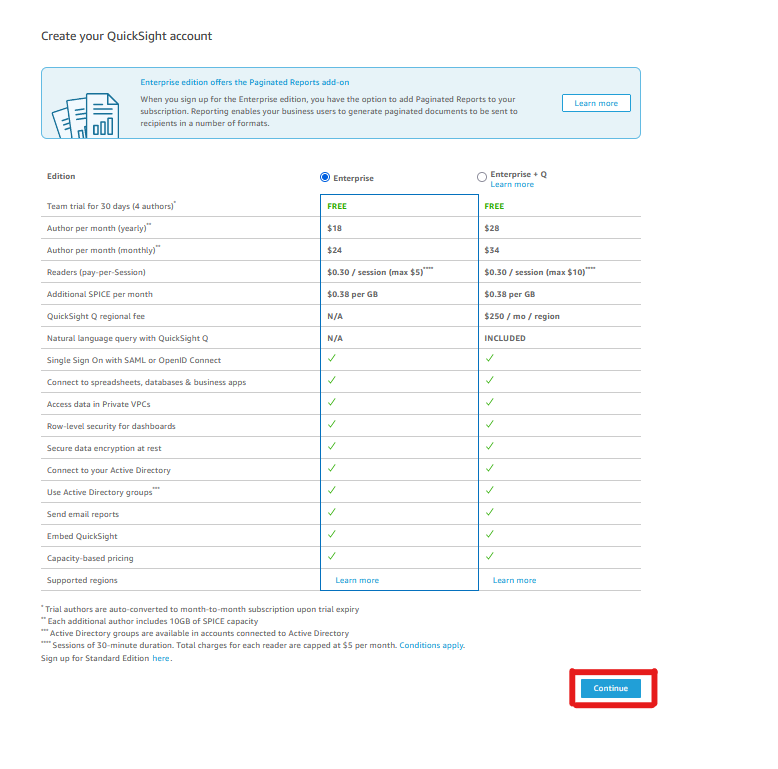
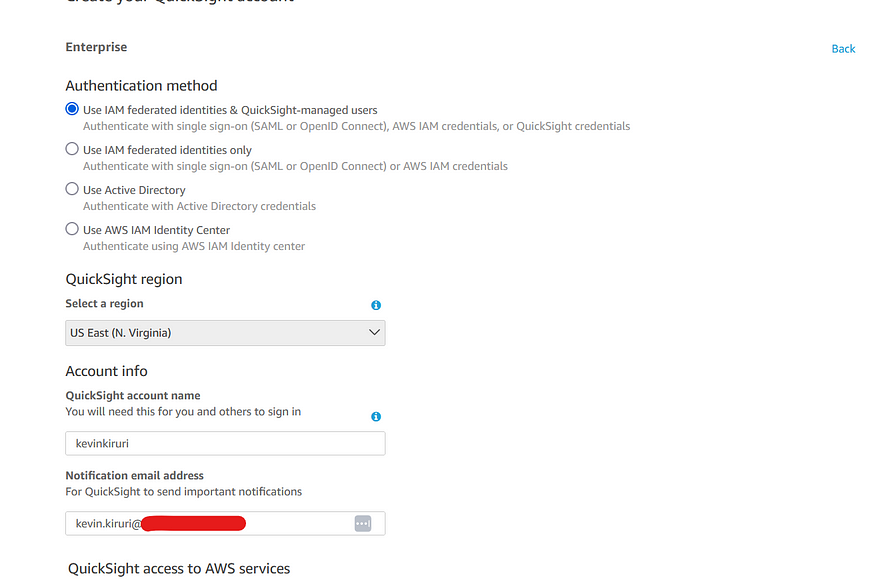
3. Select the Enterprise edition to get a Trial period for 30 days (You can cancel the subscription before the 30 days are over to avoid unnecessary charges) Click Continue
4. Select your Authentication method. Select the region to host AWS QuickSight, select a username and an email address that you can use for notifications
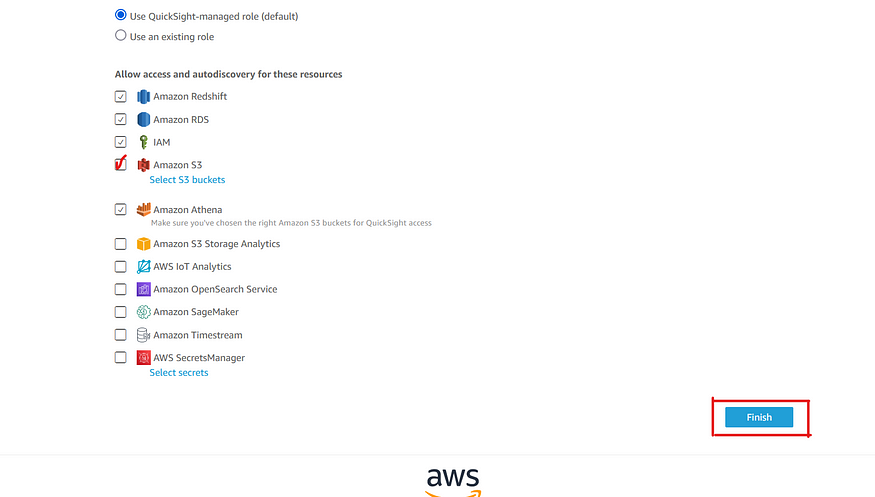
5. Under “Allow access and autodiscovery for these resources”, Select Amazon S3 to allow access and select the bucket that you created with our data and manifest files. Then Click “Finish” at the bottom
6. Give QuickSight some time to create your account (Takes less than a minute).
Visualize your Data on AWS QuickSight
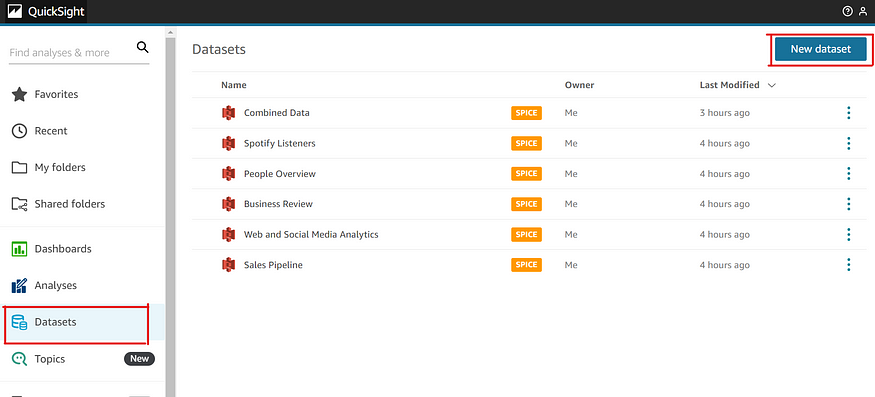
- Once AWS QuickSight loads, it presents a dashboard. Click on datasets, the “New dataset”
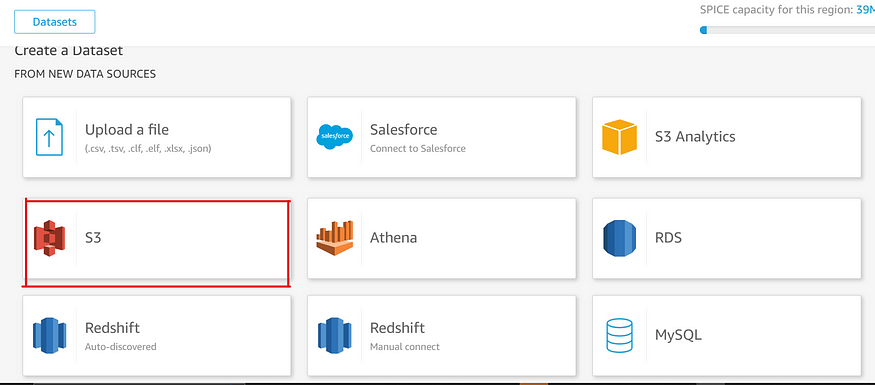
2. On the Data sources, Select S3
3. Give the Data source name (You can choose any name you wish)
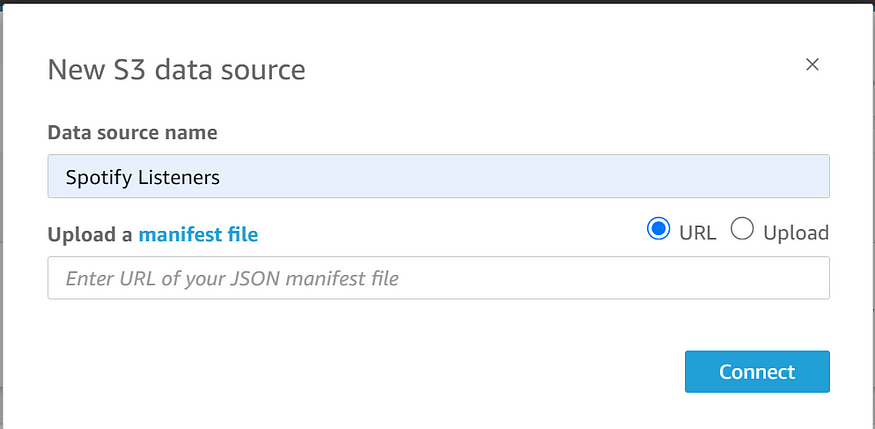
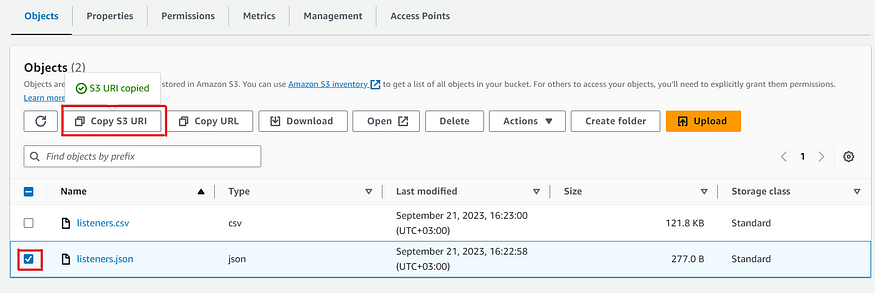
4. Give the url of the manifest file. To get the url of the manifest file, select “listeners.json” from your uploaded files on S3 and copy the S3 URI.
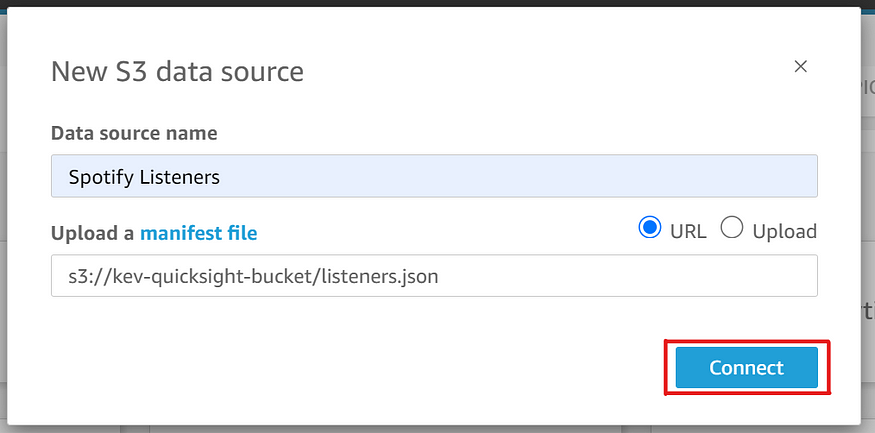
5. Paste the S3 URI of the manifest file then click ‘Connect’
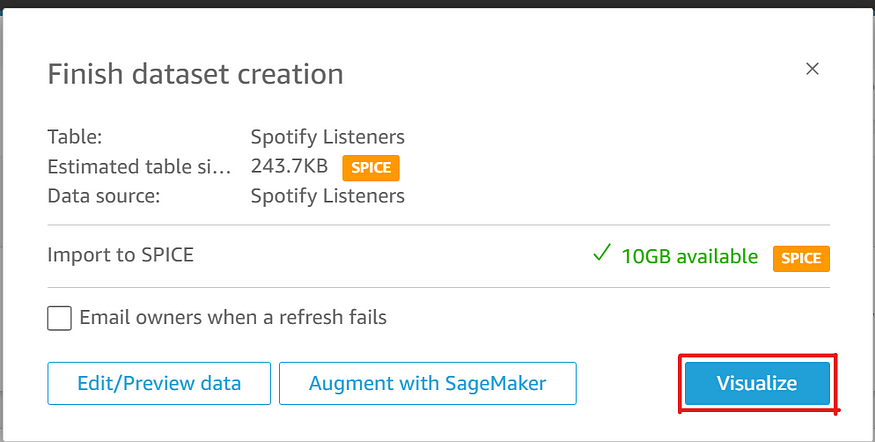
6. Click on “Visualize”.
7. In some cases, AWS QuickSight may not access S3, if it fails, follow this guidelines on granting QuickSight access to S3
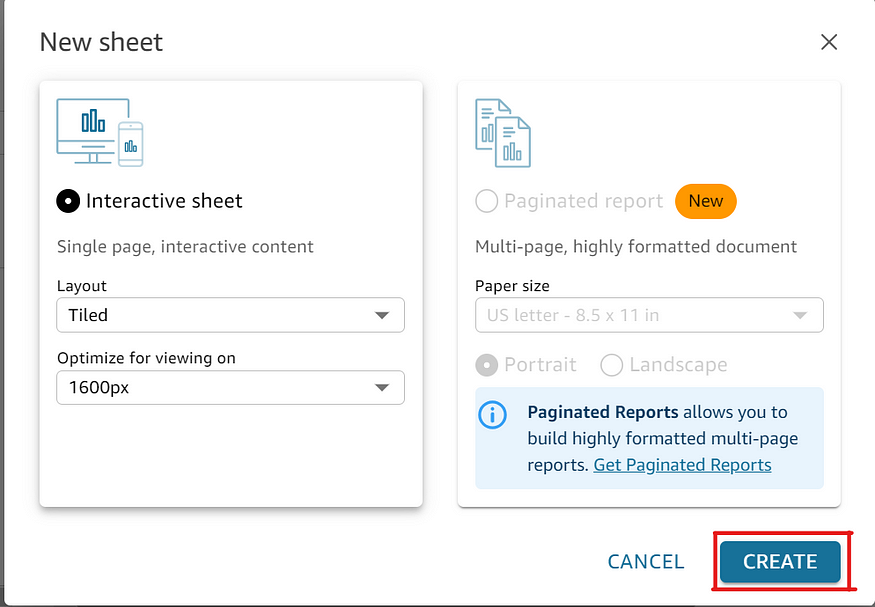
8. select a Tiled Layout then click on ‘Create’
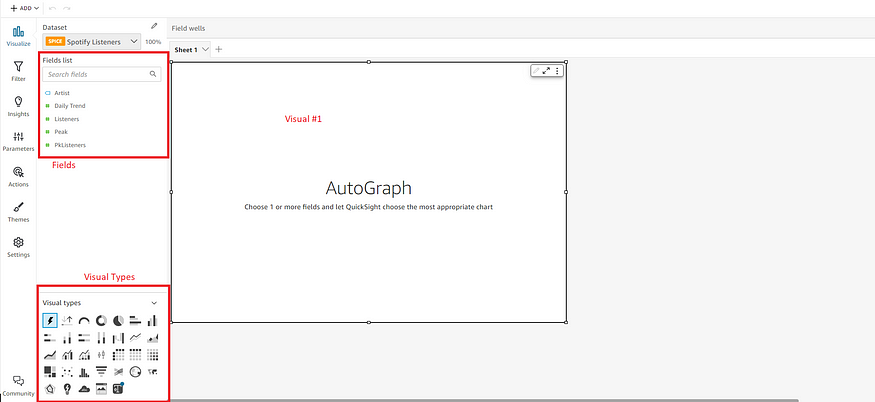
9. AWS QuickSight presents its workarea showing the Fields (Data Columns), 1 visual (You may choose to add more visuals) and the Visual Types for the data
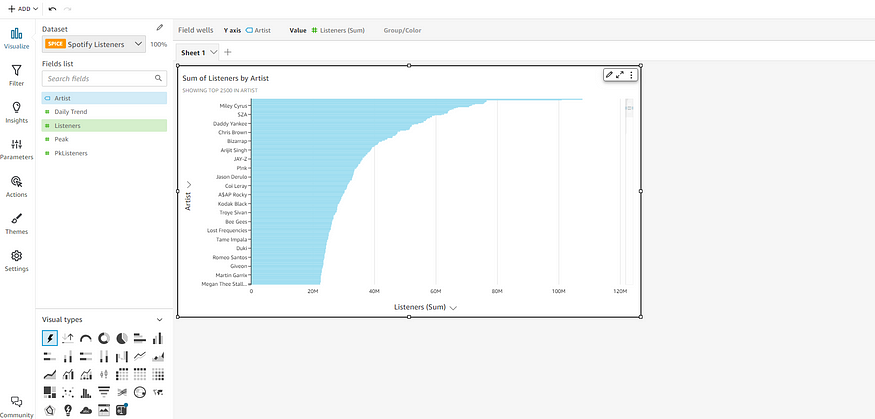
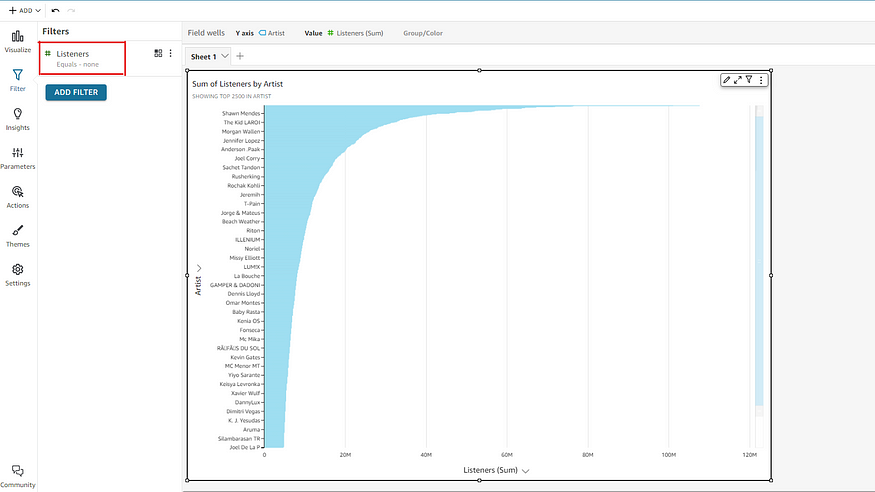
10. Let’s do a sample data visualization. We will create a visual of Artists against Listeners. Click on ‘Artists’ on the Fields list then click on Listeners. A visual of the data appears on the Visual space
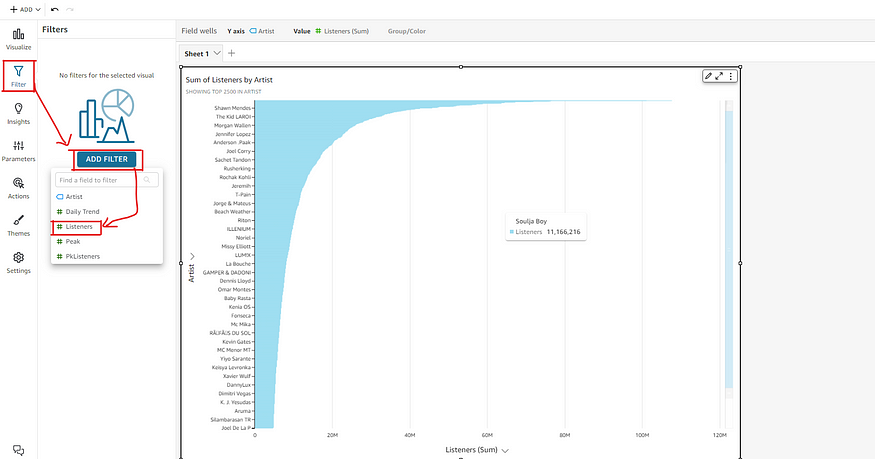
11. The data was too much, let’s do a filter, say we want to view the Artists with more than 75,000,000 listeners.
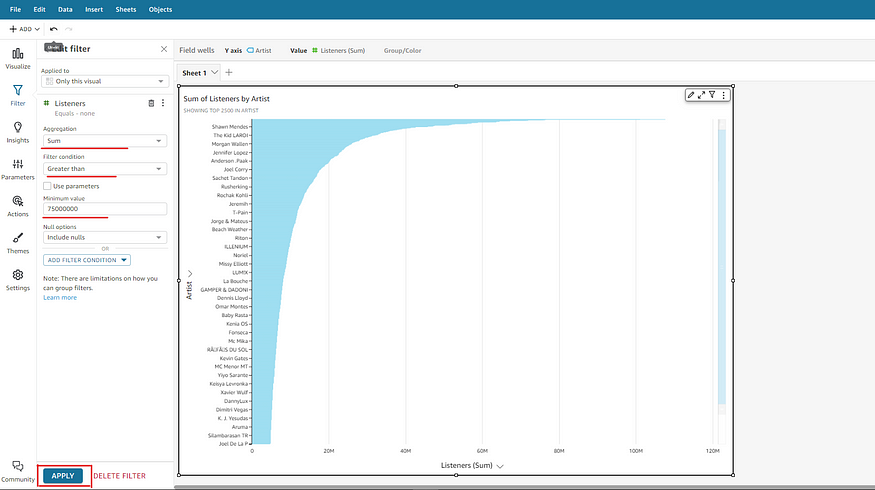
12. Click on Filter, then ‘ADD FILTER’ then select ‘Listeners’ as this is the Field we want to filter by
13. Select Listeners
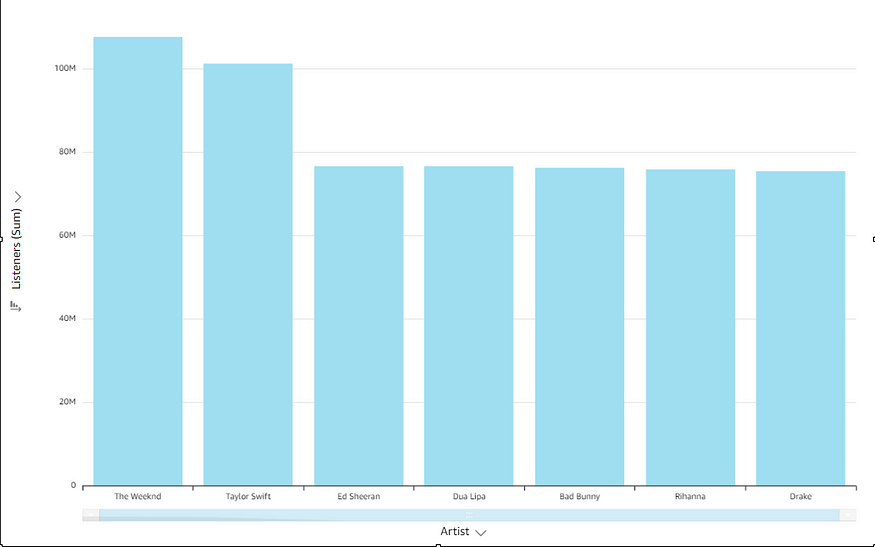
14. Set Aggregation to Sum, Filter condition to ‘Greater than’ and the Minimum value to ‘75000000’ (There are many more options that you can explore). Then click ‘APPLY’ at the bottom
15. The visual changes to show you the data that meets the criteria
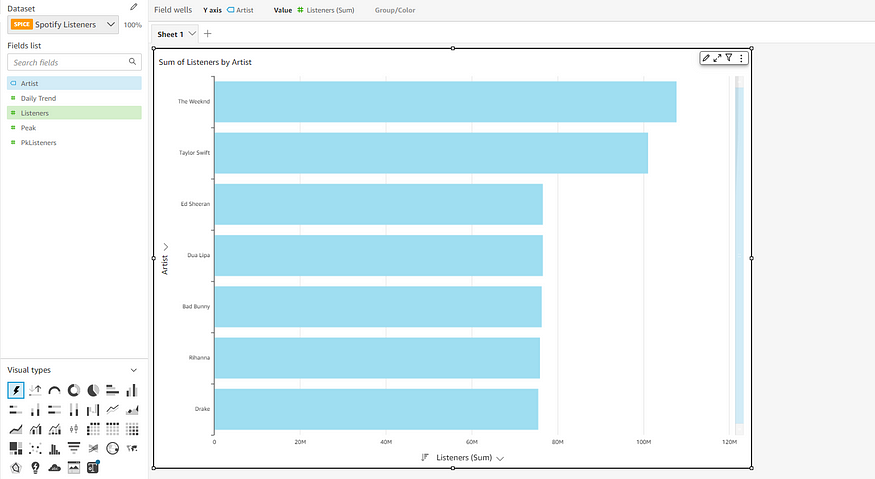
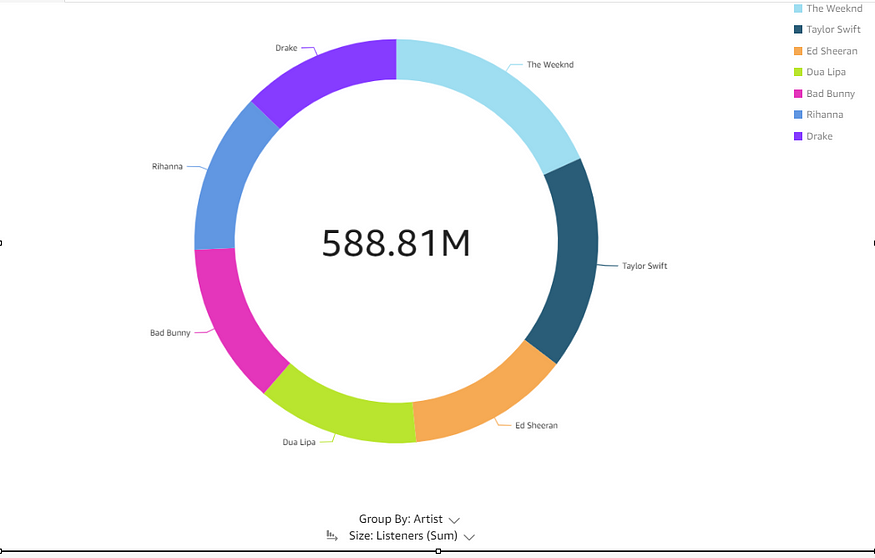
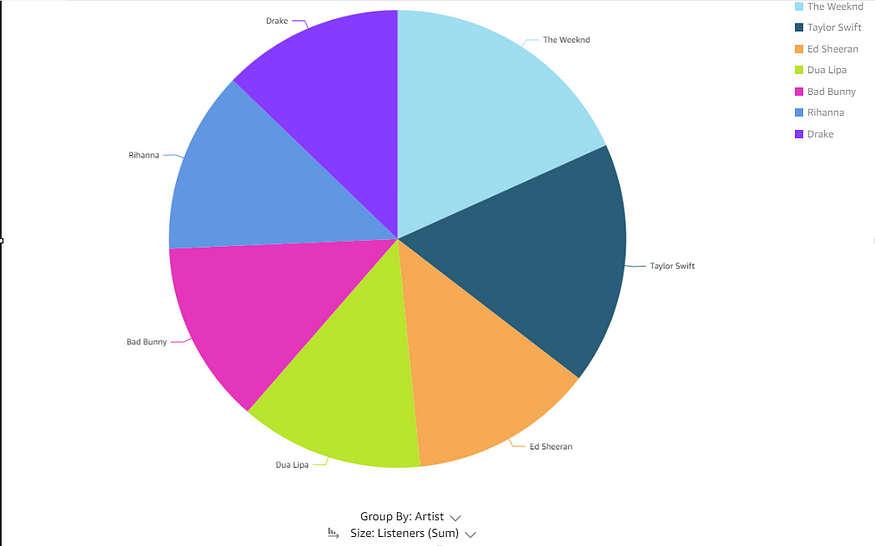
16. You may also change the Visual type to show the data in different formats. The following are some examples.
Conclusion
AWS QuickSight easily connects with Amazon S3, making data analysis and visualization in the cloud simple. As you explore more AWS tools and services, you'll find endless ways to improve your data projects. This collaborative journey highlights the innovative and learning spirit of the AWS community. Together, we can achieve great things in cloud computing.
Subscribe to my newsletter
Read articles from VIKRANT SARADE directly inside your inbox. Subscribe to the newsletter, and don't miss out.
Written by
VIKRANT SARADE
VIKRANT SARADE
I am a passionate and motivated Full Stack Developer with experience in Python, Django, Flask , AI/ML, React, and PHP frameworks like CodeIgniter. With a strong foundation in web development, databases, and cloud computing, I am eager to transition into an AWS DevOps role. I have hands-on experience with CI/CD pipelines, infrastructure automation, and deployment strategies. As a quick learner and problem solver, I am committed to building scalable and efficient cloud-based solutions. I am always open to new challenges and opportunities to expand my skills in cloud and DevOps technologies.