Proactive, Resilient Database Monitoring with Parseable
 Adheip Singh
Introduction
In recent years, the reliability and resiliency of cloud-based communication platforms has become increasingly crucial for businesses worldwide. However, even the most robust systems can face unexpected disruptions.
A recent example is the Slack outage that occurred due to a combination of database overload and caching inefficiencies. The issue was resolved with swift response and excellent incident management by the Slack Site Reliability Engineering (SRE) team. They deserve commendation for their transparency during the incident, particularly in their rapid response and detailed Root Cause Analysis (RCA).
However, this incident highlighted the importance of database monitoring and intelligent caching strategies in preventing such outages.
In this blog post we’ll explore how Parseable Observability Platform leverages AI for database monitoring and intelligent caching capabilities, to help organizations avoid or mitigate such outages, ensuring continuous service availability even under high load conditions.
Understanding the Slack Outage
Database Overload
On February 26, 2025, Slack suffered a major outage due to a database overload triggered by a maintenance action and compounded by caching latency issues. As cache failures led to a surge of direct database queries, nearly 50% of instances became overwhelmed, causing cascading failures. Parseable database monitoring helps prevent such issues by tracking query latency, throughput, and connection spikes in real time.
Caching Challenges
A defect in Slack’s caching system increased latency and cache misses, forcing excessive database queries and creating an unsustainable feedback loop. This led to widespread service disruptions, highlighting the need for resilient caching strategies that prevent backend overloads.
How Parseable Can Help
Agentic Database Monitoring
Parseable Agentic database monitoring solution offers an autonomous agent that continuously analyzes and monitors database’s telemetry to detect performance bottlenecks before they escalate into service disruptions.
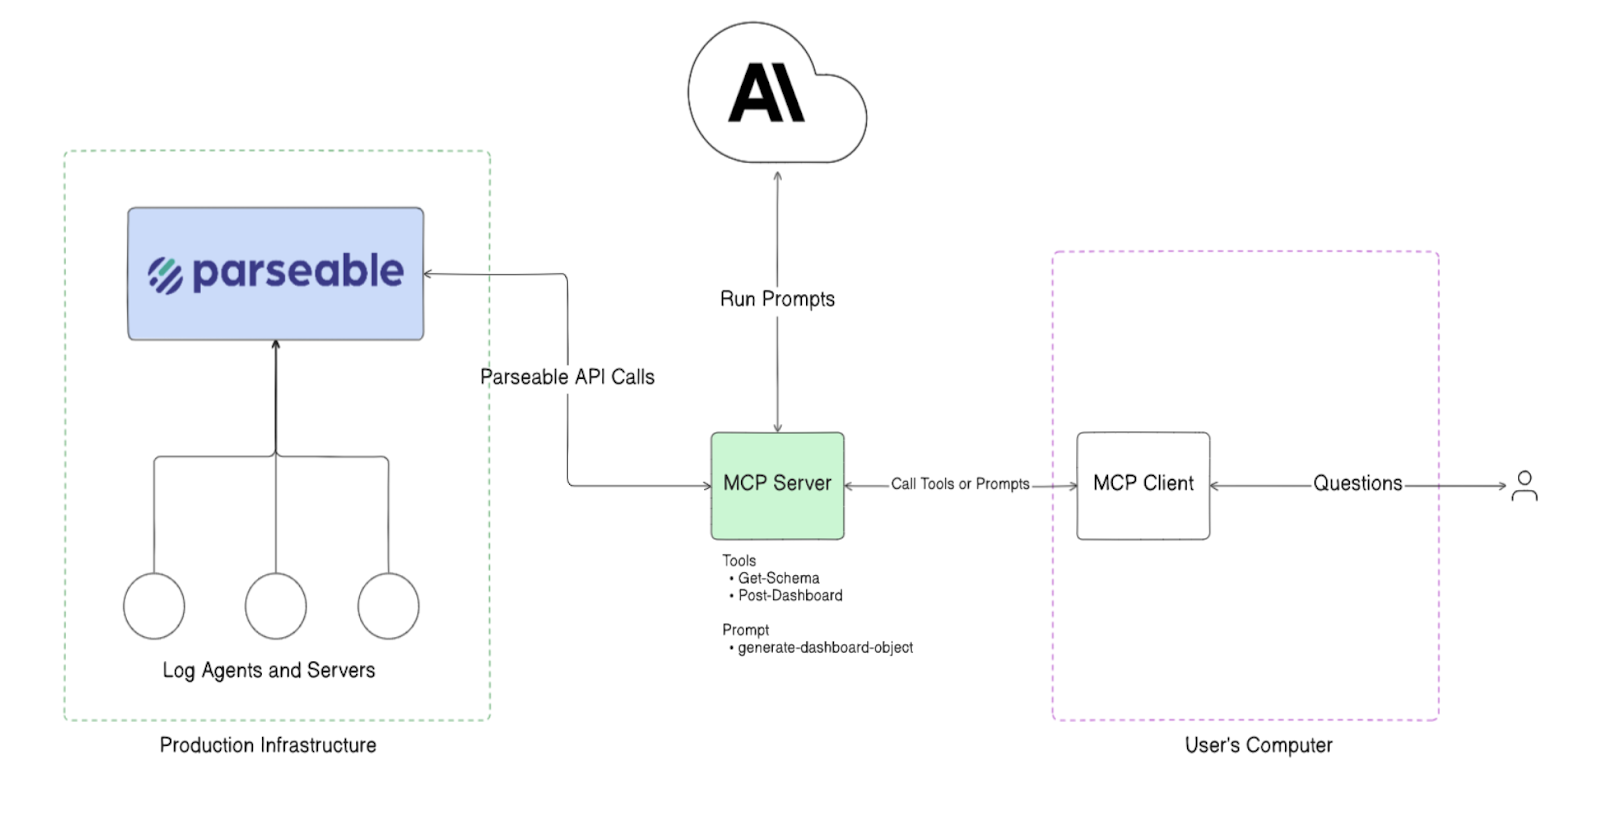
The system leverages the Model Context Protocol (MCP) to establish intelligent monitoring workflows. Traditionally, real time database monitoring is tracked by metrics like:
Query latency (read/write)
Transaction throughput
Connection spikes
Disk utilization
A DBA, DevOps, or SRE person would then monitor these metrics for anomalies, setup alerts and then act if an alert gets triggered. This workflow however is reactive by design. You’d react to something that has happened already.
With Parseable Agentic database monitoring, we are looking to empower teams to act in a proactive manner. Imagine the Agent as someone well aware of database’s performance characteristics, active load and behavior patterns - always monitoring the real time signals. Once the agent establishes that certain data point is moving in the wrong direction, it will notify the team to act.
How does this work
The first step is to collect the database telemetry using OpenTelemetry Collector, and standard agents like FluentBit or Vector. Once all this data is captured, Parseable stores this data efficiently, with up to 90% compression on S3, while also ensuring lightening fast search and query. This forms the base of our Agentic workflow.
The MCP based Agent then uses the telemetry data to actively monitor the database. This is done by querying the Parseable server with some pre-defined and some dynamic queries generated on the fly (based on results from pre-defined queries). This enables a more contextual and real-time analysis of system performance - all autonomously.

Instead of relying solely on traditional threshold-based alerts, which often lead to false positives or missed anomalies, the MCP server processes incoming telemetry and detects subtle deviations indicative of emerging issues.
By continuously analyzing structured and unstructured data, this approach ensures early detection of performance degradation, reducing operational risk and allowing for proactive remediation before problems escalate.
Accelerated Recovery Process
Another core AI enabled workflow is autonomous root cause analysis. As a part of pb (Parseable CLI), the analysis feature significantly speeds up incident resolution:
Automatically analyzes structured logs to pinpoint exact failure points
Integrates directly with incident management tools(eg: OpsGenie, PagerDuty, Rootly etc. ) to generate comprehensive postmortem reports
Provides clear mitigation steps based on identified root causes
Generates incident summaries suitable for stakeholder communication
Here’s a comprehensive demo:
Conclusion
Slack’s outage underscores the critical need for proactive database monitoring, resilient caching, and intelligent RCA to maintain service reliability.
Parseable AI-driven database monitoring detects performance issues in real time, while intelligent caching strategies optimize query performance under high load. Its distributed architecture ensures high availability, preventing downtime even when ingestion scales dynamically.
With advanced log parsing and automated RCA, Parseable accelerates incident resolution, minimizing disruptions. By integrating these capabilities, organizations can safeguard their infrastructure against cascading failures and ensure seamless service continuity.
Subscribe to my newsletter
Read articles from Adheip Singh directly inside your inbox. Subscribe to the newsletter, and don't miss out.
Written by