Streamlining Monitoring: A Step-by-Step Guide to Deploying Prometheus and Grafana with Helm on Amazon EKS
 Mahira Technology Private Limited

Introduction :-
Prometheus is a popular open-source monitoring solution that provides metrics storage, querying, and alerting capabilities. Grafana, on the other hand, is a widely used visualization and analytics platform for monitoring data.
In this blog, we will discuss how to deploy Prometheus and Grafana using Helm in an EKS (Elastic Kubernetes Service) cluster.
Prerequisites
Before we get started, you will need the following:
An AWS account
An EKS cluster
A running Kubernetes cluster
The Helm package manager installed on your system
Step 1: Install Helm
Helm is a package manager for Kubernetes that simplifies the installation and management of Kubernetes applications. To install Helm, follow the instructions provided in the official Helm documentation.
Step 2: Add the Prometheus and Grafana repositories to Helm
To add the Prometheus and Grafana repositories to Helm, use the following commands:
helm repo add prometheus-community https://prometheus-community.github.io/helm-charts
helm repo add grafana https://grafana.github.io/helm-charts
Step 3: Create a new namespace
The following command will create a new namespace named monitoring:
$ kubectl create namespace monitoring
Step 4: Install Prometheus
To install Prometheus, use the following command:
$ helm install prometheus prometheus-community/kube-prometheus-stack --namespace monitoring
This command will install the kube-prometheus-stack chart from the prometheus-community repository and create the necessary Kubernetes resources.
Step 5: Accessing the Prometheus GUI
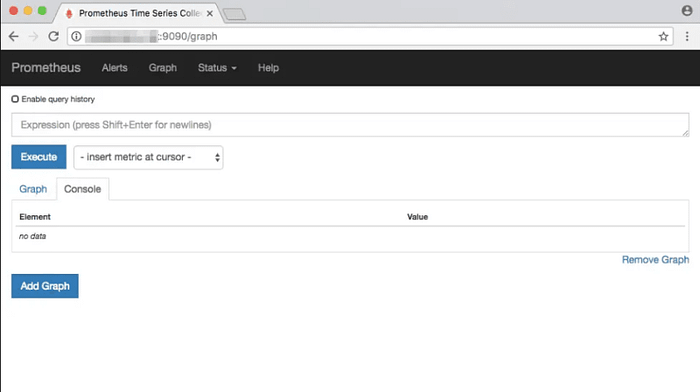
To access the Prometheus GUI, we will use a port-forward command to connect to the Prometheus pod running in your EKS cluster. The following command will create a port-forward connection to the Prometheus pod:
$ kubectl port-forward prometheus-kube-prometheus-stack-prometheus-0 9090
Step 6: Install Grafana
To install Grafana, use the following command:
$ helm install grafana grafana/grafana --namespace monitoring
This command will install the Grafana chart from the Grafana repository and create the necessary Kubernetes resources.
Step 7: Accessing Grafana

kubectl port-forward svc/grafana 3000:80
This command will forward the Grafana service port to your local machine’s port 3000. Now, you can access Grafana by opening a web browser and navigating to http://localhost:3000.
Conclusion :-
In this blog post, we have discussed how to deploy Prometheus and Grafana using Helm in an EKS cluster. We have also covered the steps required to configure Prometheus as a data source in Grafana. With these tools in place, you can monitor your Kubernetes cluster and applications easily and efficiently.
Subscribe to my newsletter
Read articles from Mahira Technology Private Limited directly inside your inbox. Subscribe to the newsletter, and don't miss out.
Written by
Mahira Technology Private Limited
Mahira Technology Private Limited
A leading tech consulting firm specializing in innovative solutions. Experts in cloud, DevOps, automation, data analytics & more. Trusted technology partner.