Power Query UI vs M Code - How to Unlock Advanced Data Transformations
 Ahamad Tawsif Chowdhury
Most Power BI users rely on the Power Query UI for data transformations, this is the window that opens up when you click "Transform data" in the Home tab.
Clicking and adding different steps in the Transform window actually generates M code. opening and editing the M code gives you more control over data transformations that might not be available in the UI.
M code can be accessed by clicking "Advanced Editor" in the Home tab in the Power Query transform window.

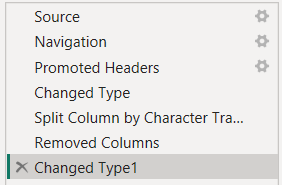
Transformations steps shown in right-hand side panel
let
    Source = Excel.Workbook(File.Contents("---"), null, true),
    Sheet1_Sheet = Source{[Item="Sheet1",Kind="Sheet"]}[Data],
    #"Promoted Headers" = Table.PromoteHeaders(Sheet1_Sheet, [PromoteAllScalars=true]),
    #"Changed Type" = Table.TransformColumnTypes(#"Promoted Headers",{{"Call Id", type text}, {"Agent", type text}, {"Date", type date}, {"Time", type datetime}, {"Topic", type text}, {"Answered (Y/N)", type text}, {"Resolved", type text}, {"Speed of answer in seconds", Int64.Type}, {"AvgTalkDuration", type datetime}, {"Satisfaction rating", Int64.Type}}),
    #"Split Column by Character Transition" = Table.SplitColumn(#"Changed Type", "Call Id", Splitter.SplitTextByCharacterTransition((c) => not List.Contains({"0".."9"}, c), {"0".."9"}), {"Call Id.1", "Call Id.2"}),
    #"Removed Columns" = Table.RemoveColumns(#"Split Column by Character Transition",{"Call Id.1"}),
    #"Changed Type1" = Table.TransformColumnTypes(#"Removed Columns",{{"Call Id.2", Int64.Type}, {"Time", type time}, {"AvgTalkDuration", type time}})
in
    #"Changed Type1"
M code for transformations steps
What is M Code?
Functional programming language used in Power Query
Build around data transformation and extraction rather than calculations and visualisations like DAX
Every transformation made using the Power Query UI generates M code automatically
How the Power Query UI Generates M Code (Example)
Let's say that you run an online book store and you have a dataset of daily sales. You want to filter the table to find out on what days you sold more than 1000 items.
In the Power Query UI, you can click on the drop-down next to the sales column, select a number filter and apply a greater than 1000 filter.
When you complete this step, Power Query creates a line of code representing this step and adds it to the overall transformation's M code.
#"Filtered Rows" = Table.SelectRows(Source, each [Sales] > 1000)
For something like this, using the Power Query UI is much easier but for more complex transformations, writing the M code yourself gives you more control over what can be done to the data compared to just using the click and select UI.
A More Complex Example
You run a grocery store and you have a dataset of all the items that you sell, each item is categorised. Some items have blank categories but you know that the missing values should just be the same as the last non-empty category in the list.
| Product | Category before | Category after |
| Apple | Fruit | Fruit |
| Orange | Fruit | Fruit |
| Banana | Blank | Fruit |
| Carrot | Vegetable | Vegetable |
| Broccoli | Blank | Vegetable |
| Potato | Blank | Vegetable |
| In the UI you might consider sorting the products and manually filling in the missing values. |
With M code, you can use the following line to quickly transform the data.
#"Filled Down" = Table.FillDown(Source, {"Category"})
Not only is this quicker compared to a manual method, it will work dynamically when new data is added.
Subscribe to my newsletter
Read articles from Ahamad Tawsif Chowdhury directly inside your inbox. Subscribe to the newsletter, and don't miss out.
Written by
