My First Steps with Pandas
 Sruti Mishra
Welcome back! In my last blog, I shared some cool things I learned about NumPy. Today, I’m excited to talk about some important operations in Pandas!
You might be wondering, why should we bother with Pandas? Well, in the world of machine learning, data really is king! We often work with large datasets—like Excel spreadsheets or CSV files—that can have issues like missing values, duplicates, or they just need a bit of cleaning up. This is where Pandas shines! It helps us clean the data, handle those missing values, filter out what we don’t need, group and aggregate information, and even merge different datasets together.
Think about it: trying to build a machine learning model with messy data is like trying to drive a super fast car while wearing a blindfold—it’s just not going to work! So having clean data is crucial.
Alright, enough chit-chat! Let’s dive into some handy Pandas operations that we’ll be using in our future projects. Let’s get started!
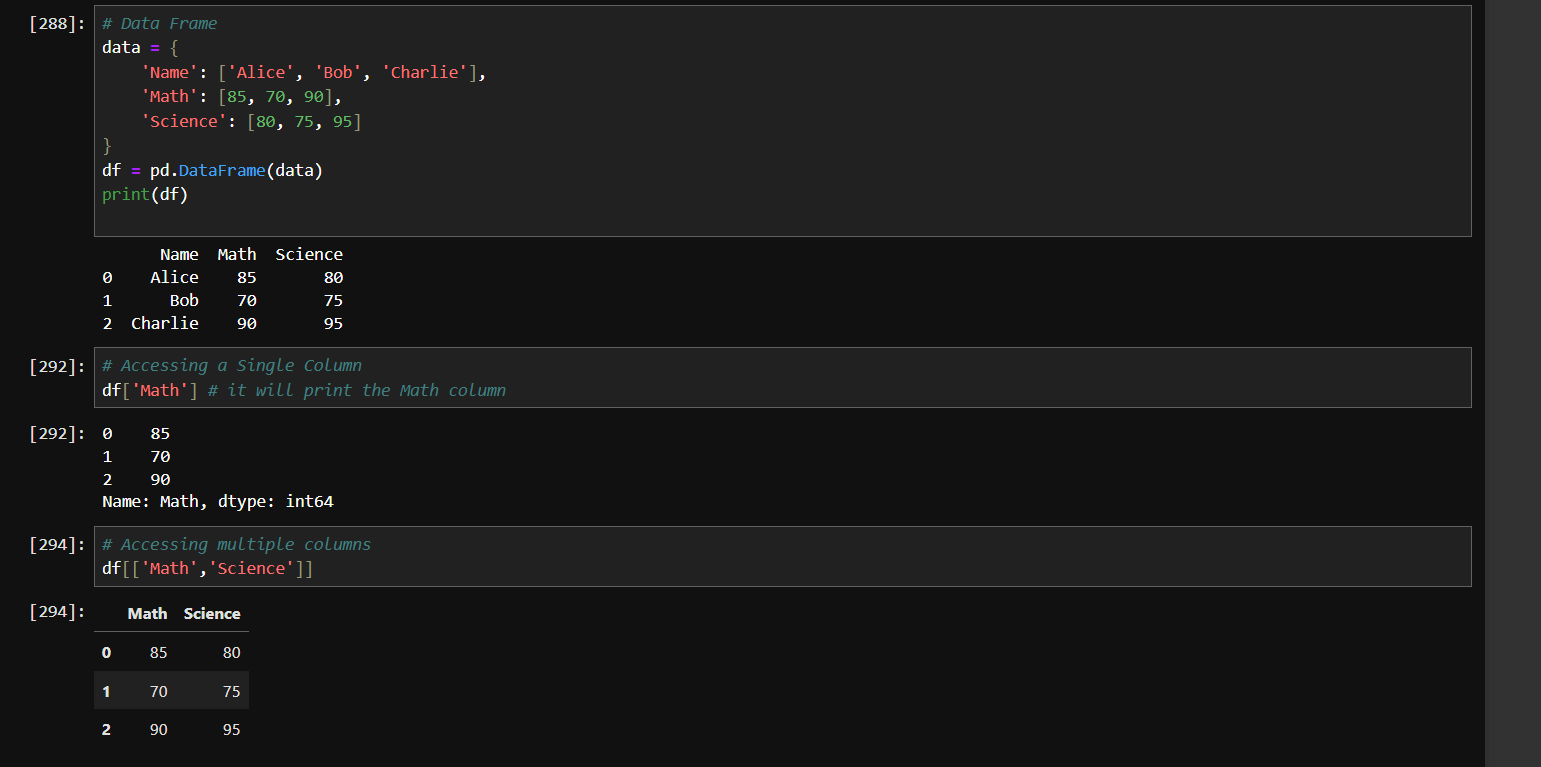
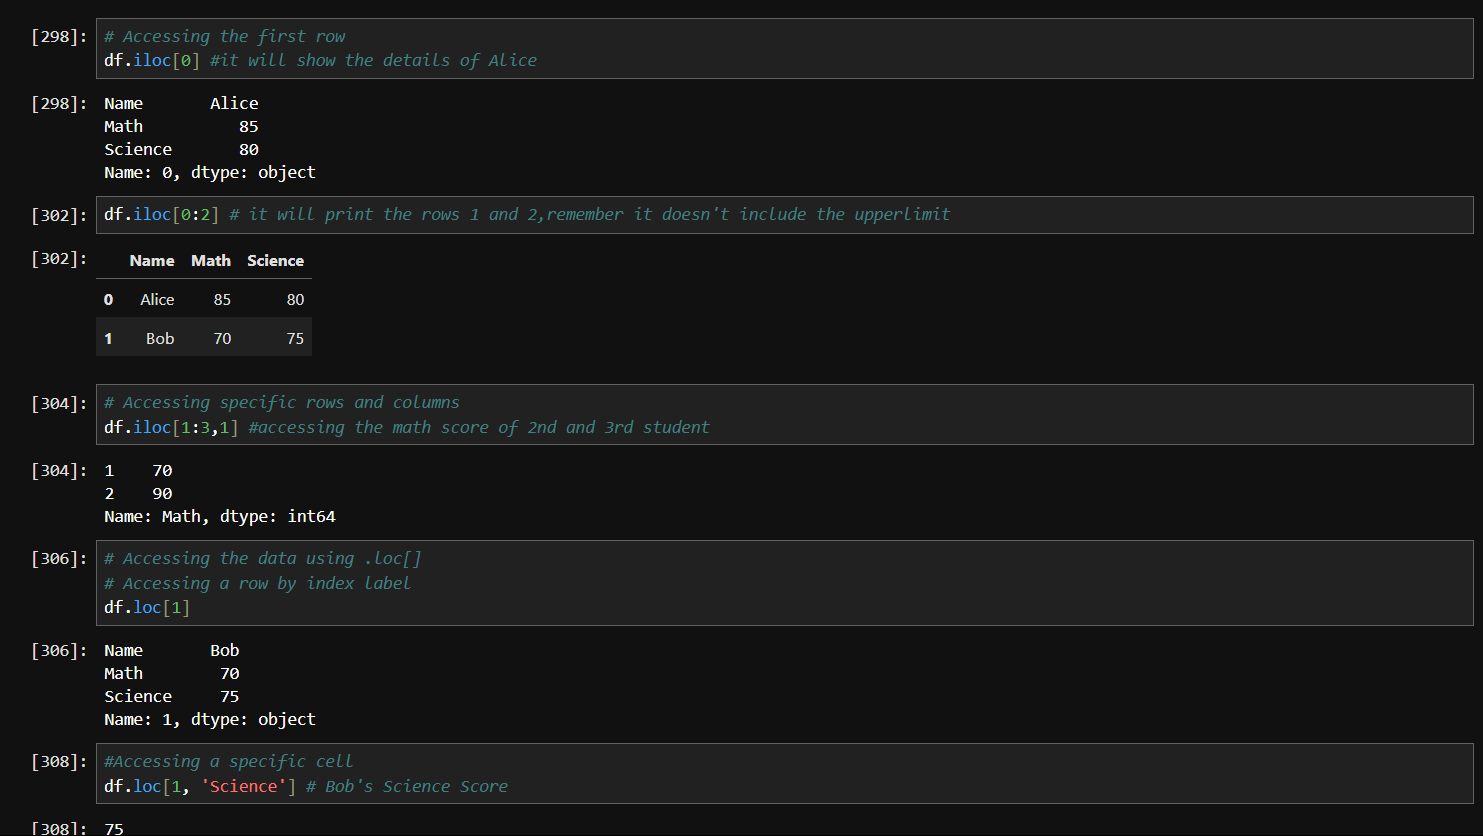
Series :
It is like a single column of data with labels(index). It is like a to-do list where each task(data point) has a priority number (index).

Data Frame :
It is like a full Excel table with rows and columns.
Loading and Exploring the Dataset :
There are many ways to load a dataset :
# Loading a CSV file from a local file:
df = pd.read_csv('dataset.csv')

#loading from a URL
url ='go_to_github_click_raw_copy_the_url_'
df = pd.read_csv(url) # for csv files

#loading an excel file
df = pd.read_excel('data.xlsx')
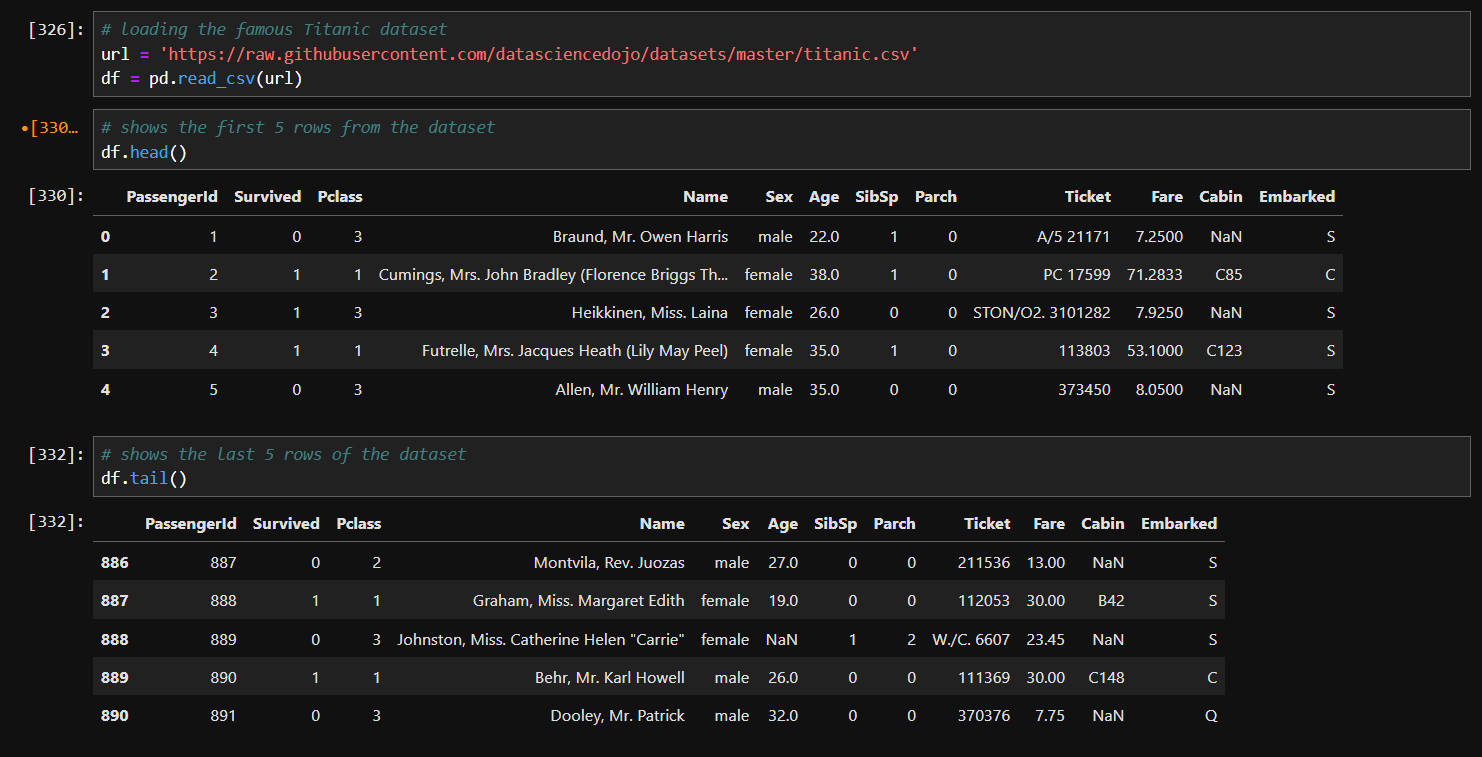
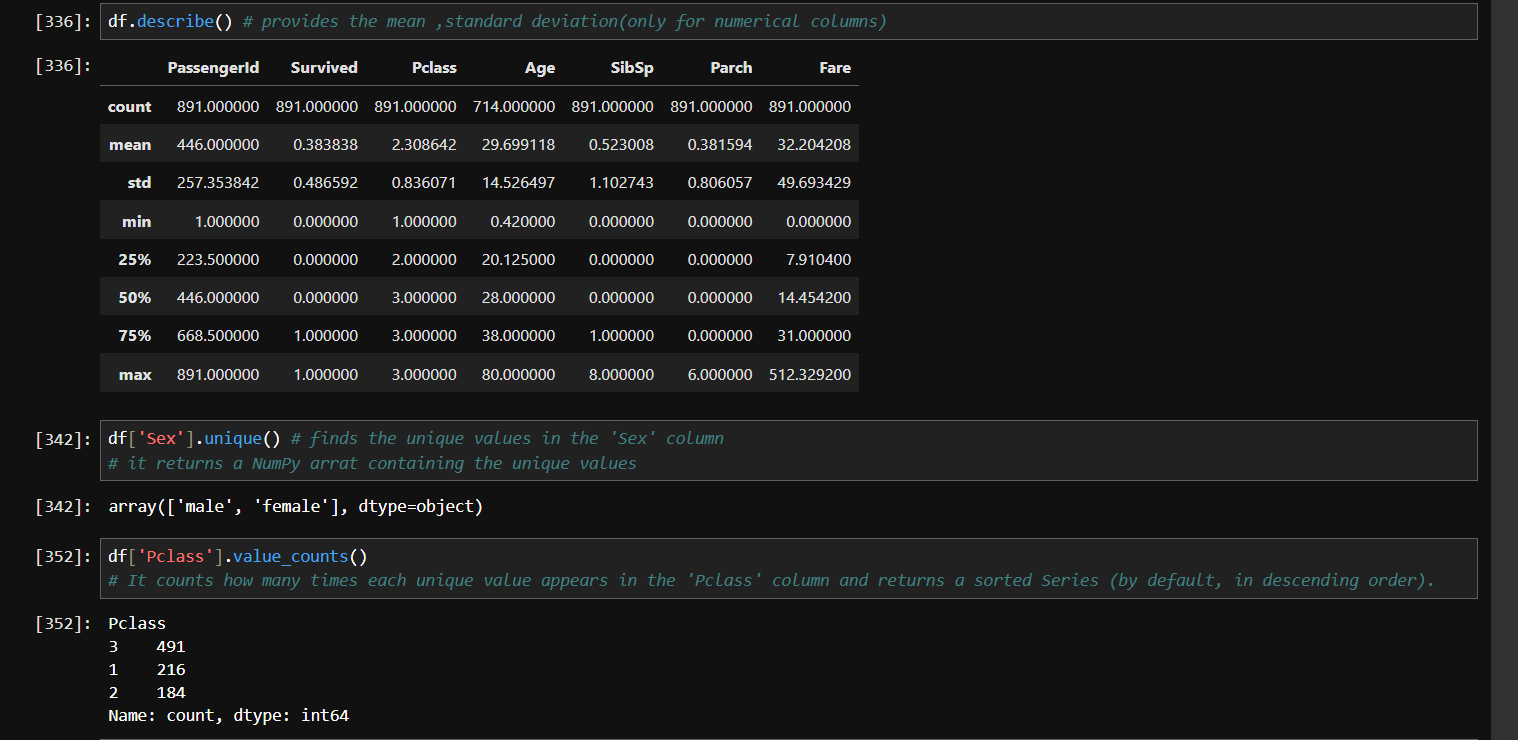
I am going to use the following Titanic Dataset:
https://raw.githubusercontent.com/datasciencedojo/datasets/master/titanic.csv
Pivot Table :
Pivot table is like the “boss lady“ of data summarization - super powerful and elegant! It is used to summarize, aggregate and analyze data in a flexible way.
General syntax : pd.pivot_table(dataframe,values,index,columns,aggfun)
values - columns you want to calculate
index - rows to group by
columns - columns to group by
aggfunc - what functions to apply (like mean ,sum,etc.)

The above pivot table groups the data by Passenger Class (1st, 2nd, 3rd class) as rows and Gender (Male/Female) as columns, then calculates the average survival rate from the 'survived' column using the mean function.
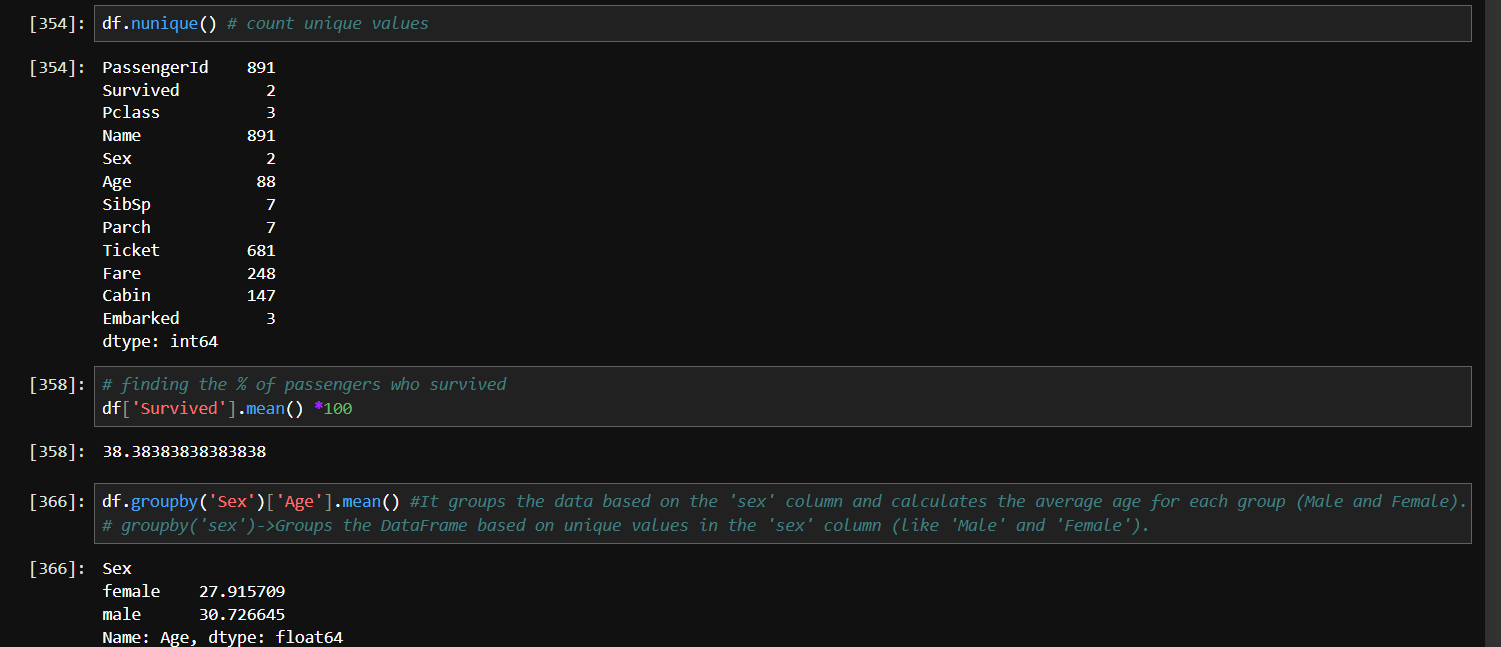
Handling Missing Values in the Titanic Dataset :
Handling missing values in the Titanic dataset is super important because, you know, when data is incomplete, it can mess up the whole analysis. Imagine trying to guess someone's age without knowing
their birth year — kinda confusing, right?
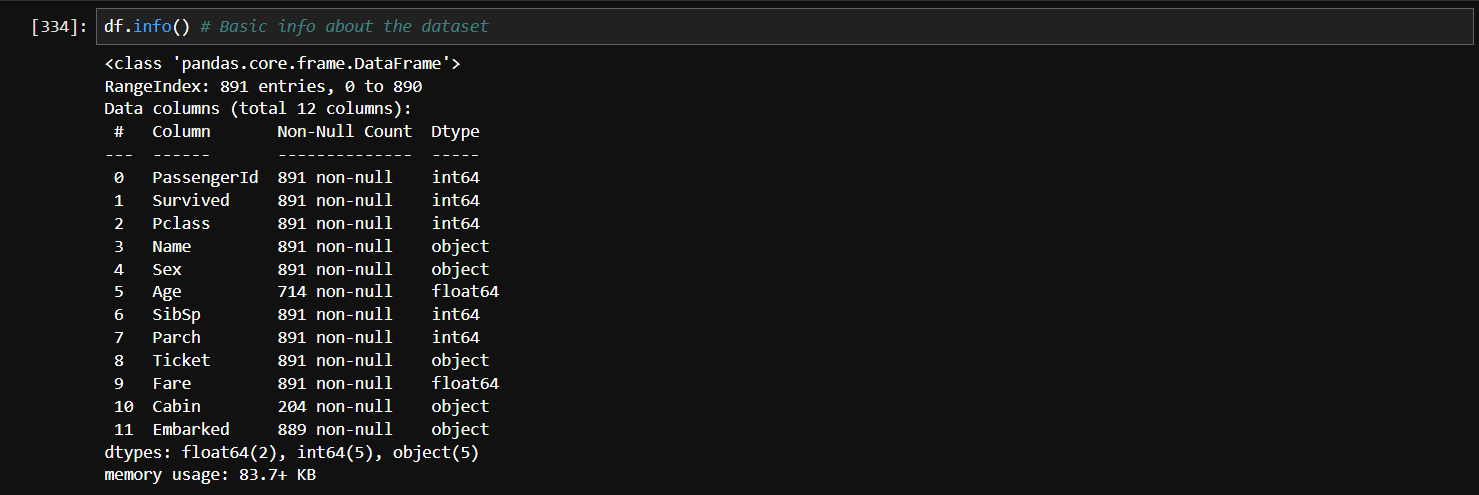
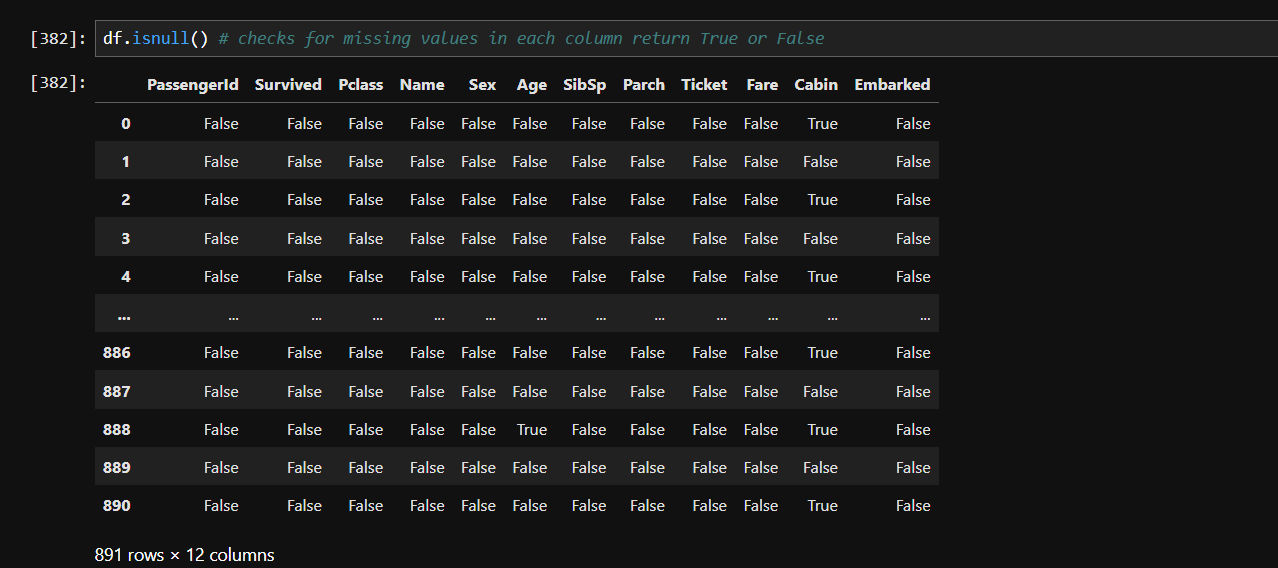
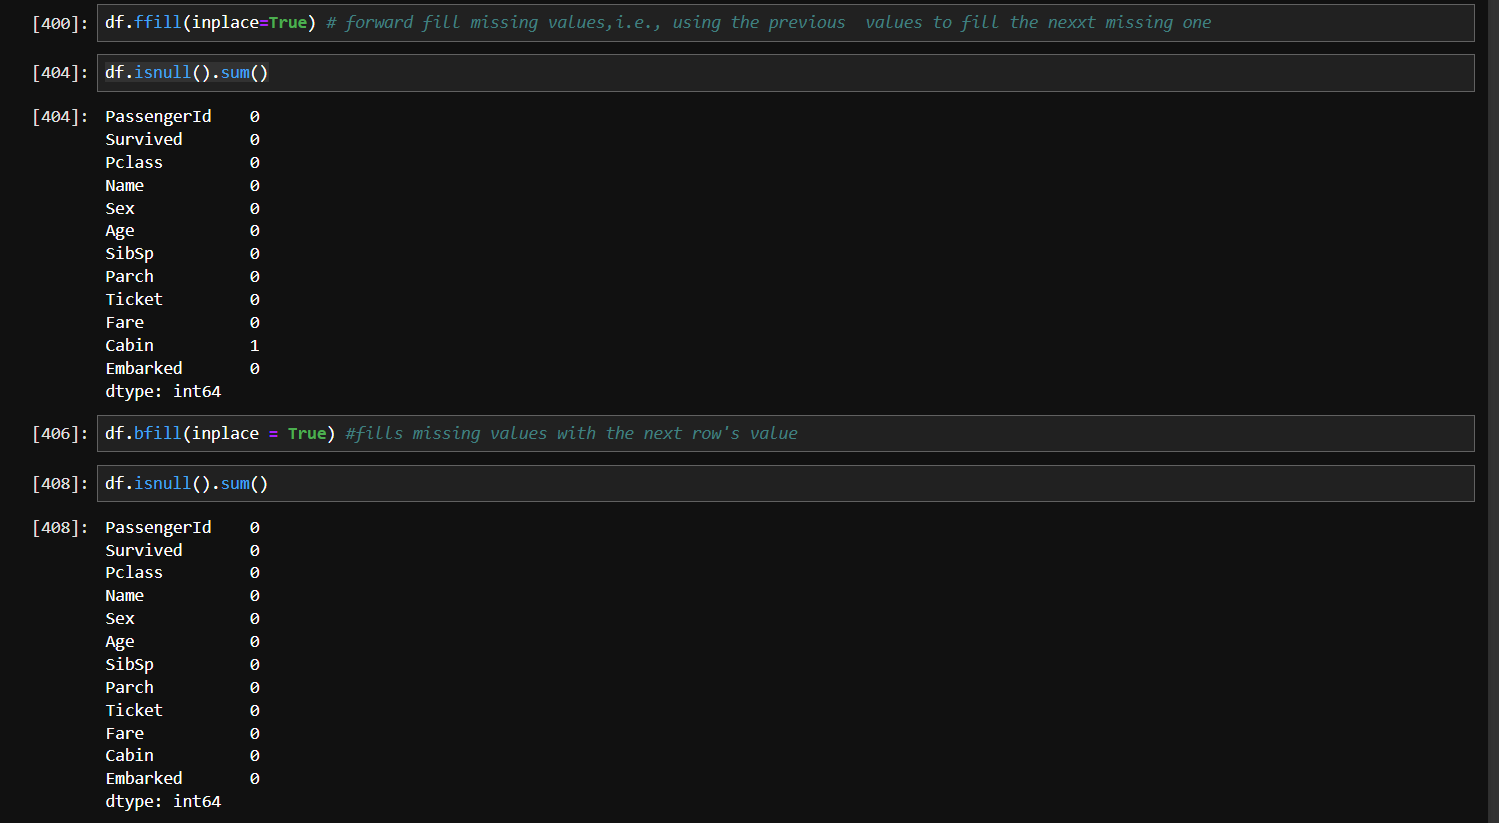
So, in this dataset, columns like 'Age', 'Cabin', and 'Embarked' have missing values, and if we just ignore them, it'll lead to incorrect results and poor model performance. We need to handle these gaps smartly to keep the data accurate and meaningful.
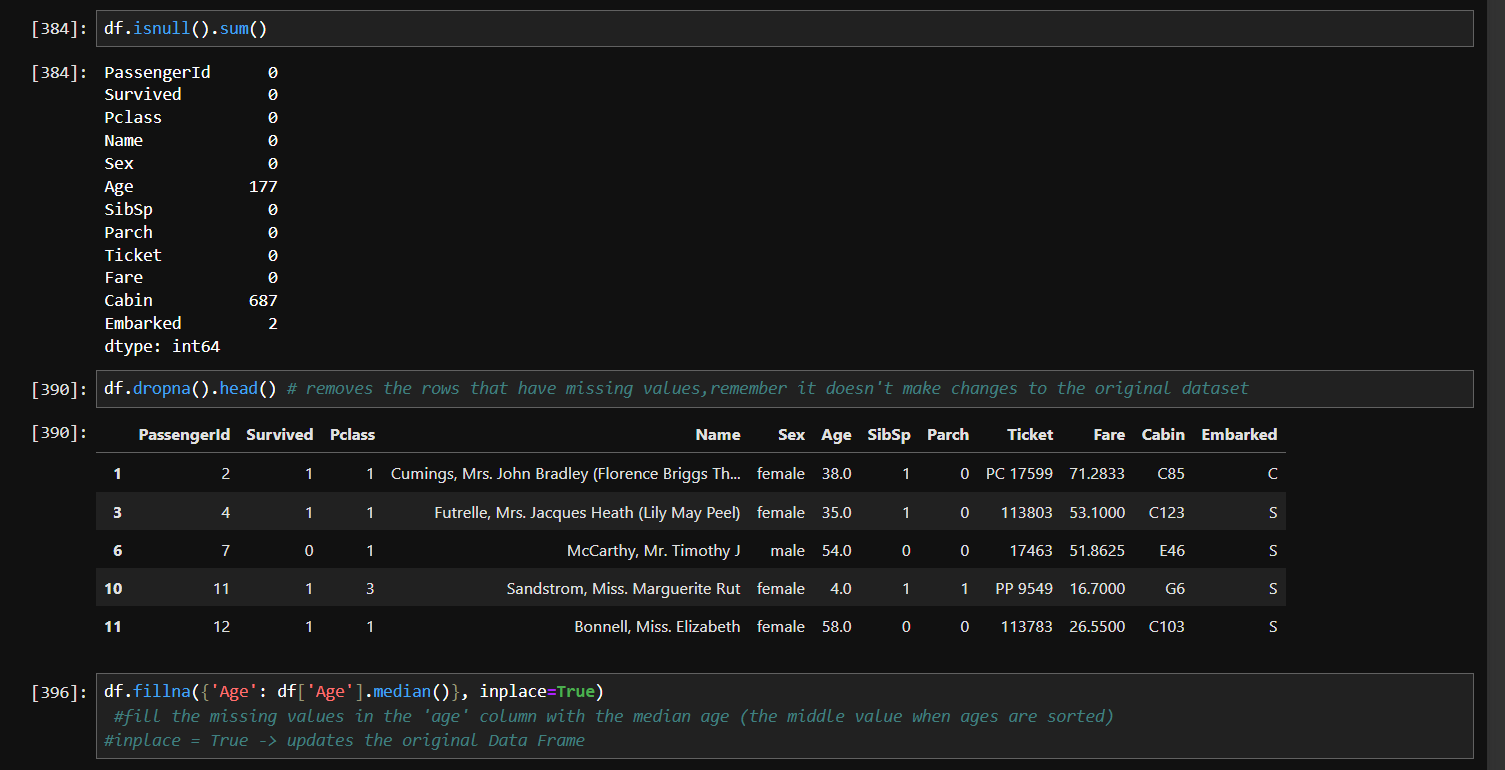
There are a few ways to deal with this. We can either remove the rows or columns with too many missing values or fill them with something meaningful, like the average age or the most common value. Sometimes, we can even use machine learning models to predict the missing data.
Let’s dive into the actual process of handling these missing values step by step :
Data Filtering and Selection :
Filtering and selecting data is like picking out your favorite outfits from a massive wardrobe — you only want what fits your vibe, right?
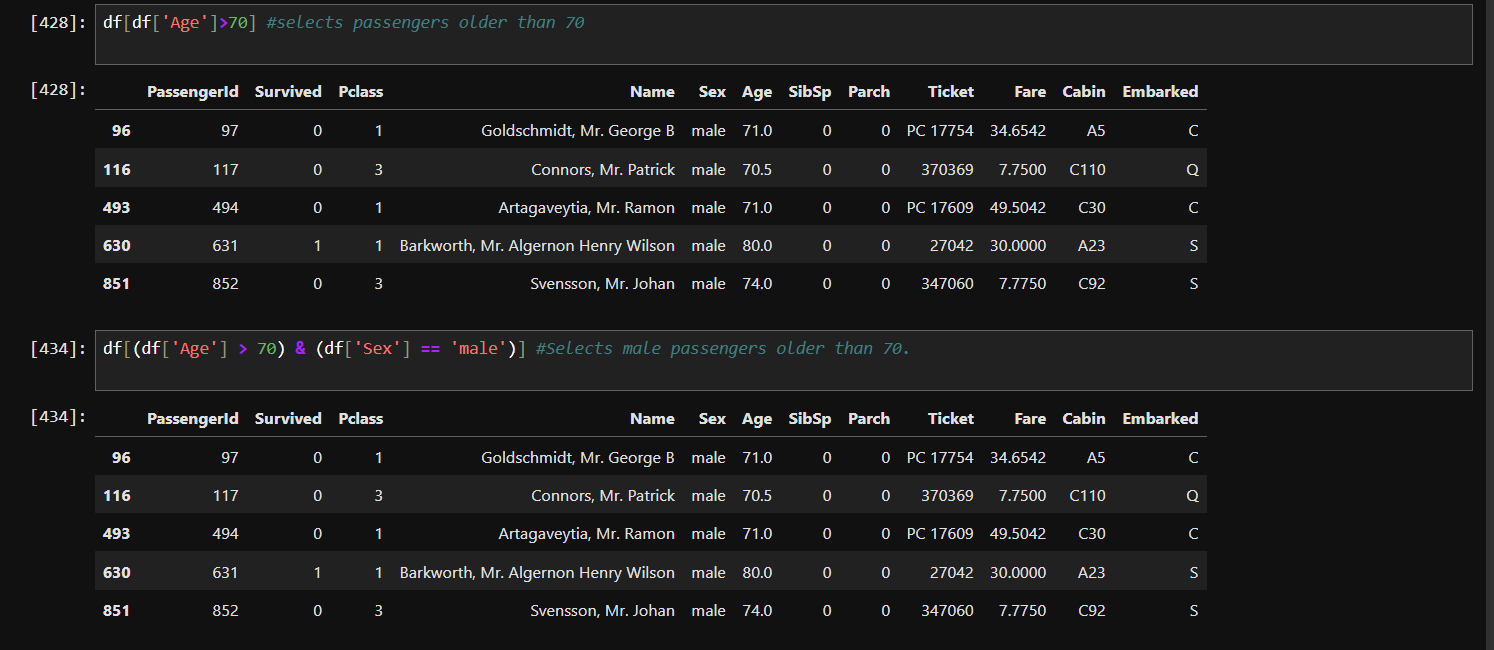
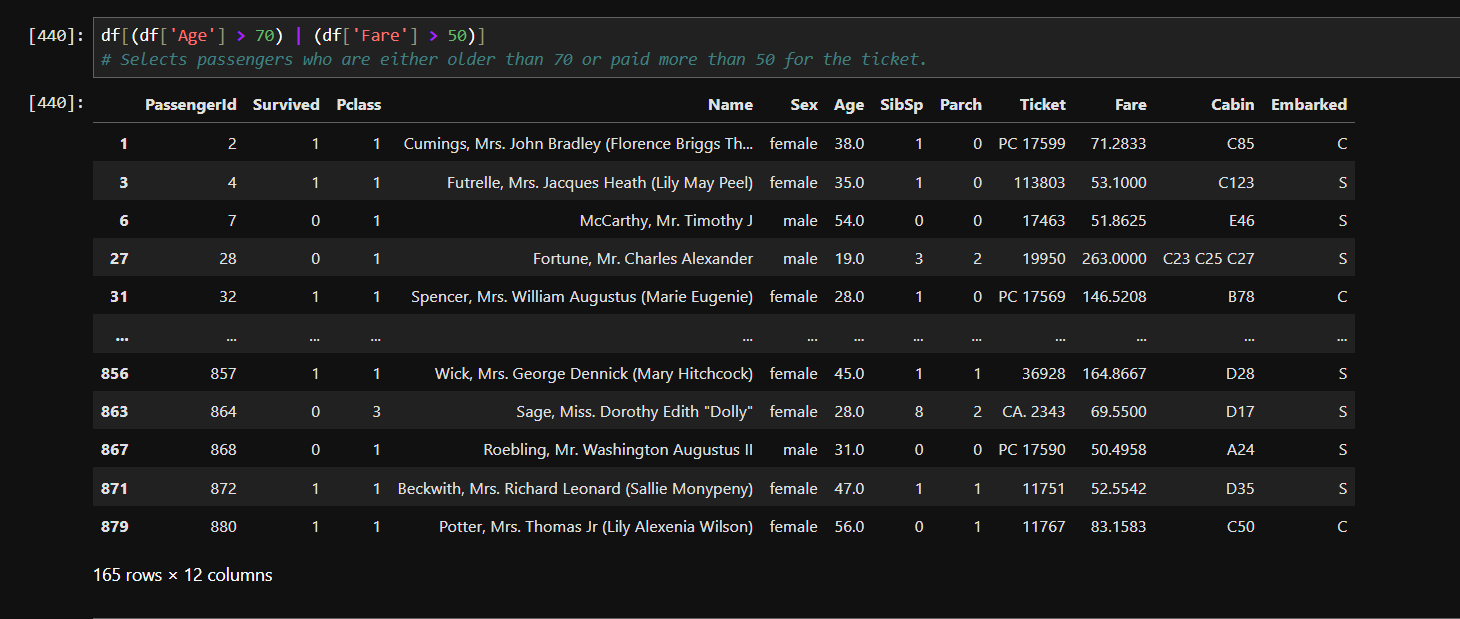
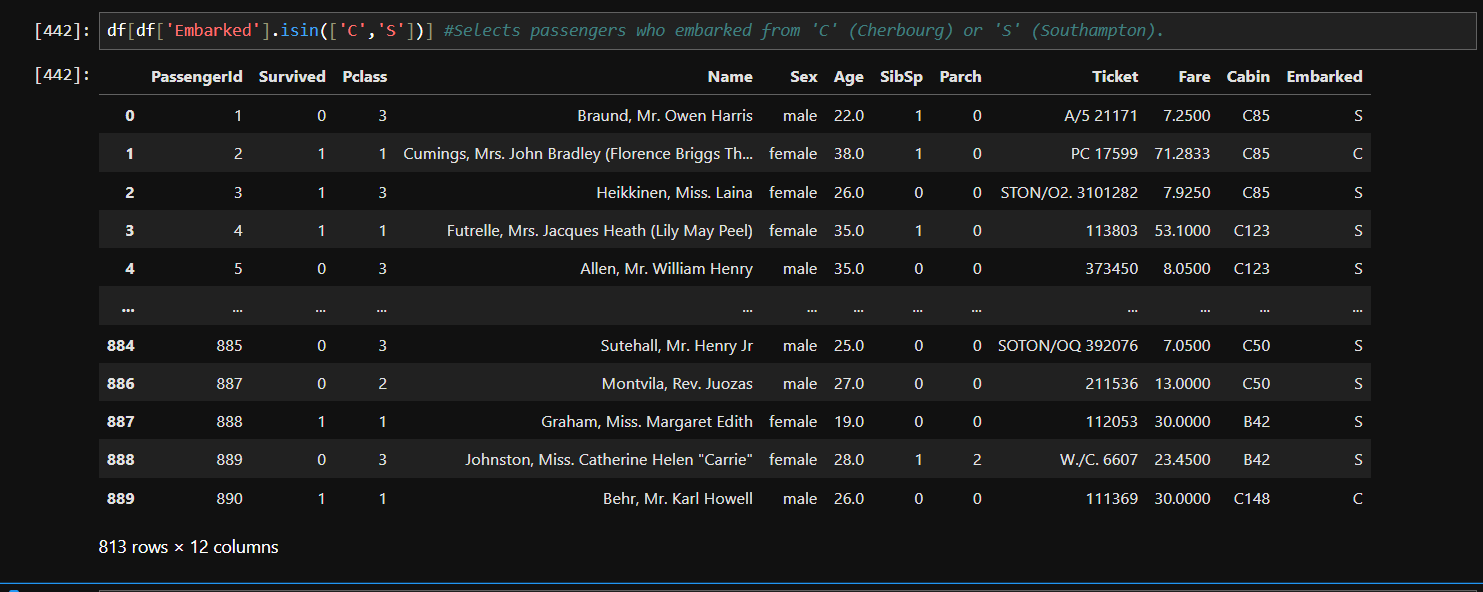
In this dataset, we often need to work with specific rows or columns based on certain conditions. For instance, filtering out only female passengers or selecting data for those who survived. If we don’t do this properly, we’ll end up with irrelevant information that could mess up our analysis.
There are multiple ways to do this. We can use conditional filtering, where we select rows based on conditions like age or class. Or we can go for column selection, where we pick only the columns that matter to us, like 'Survived' or 'Fare'.
Let’s dive in and explore these methods step by step :
Grouping and Aggregation :
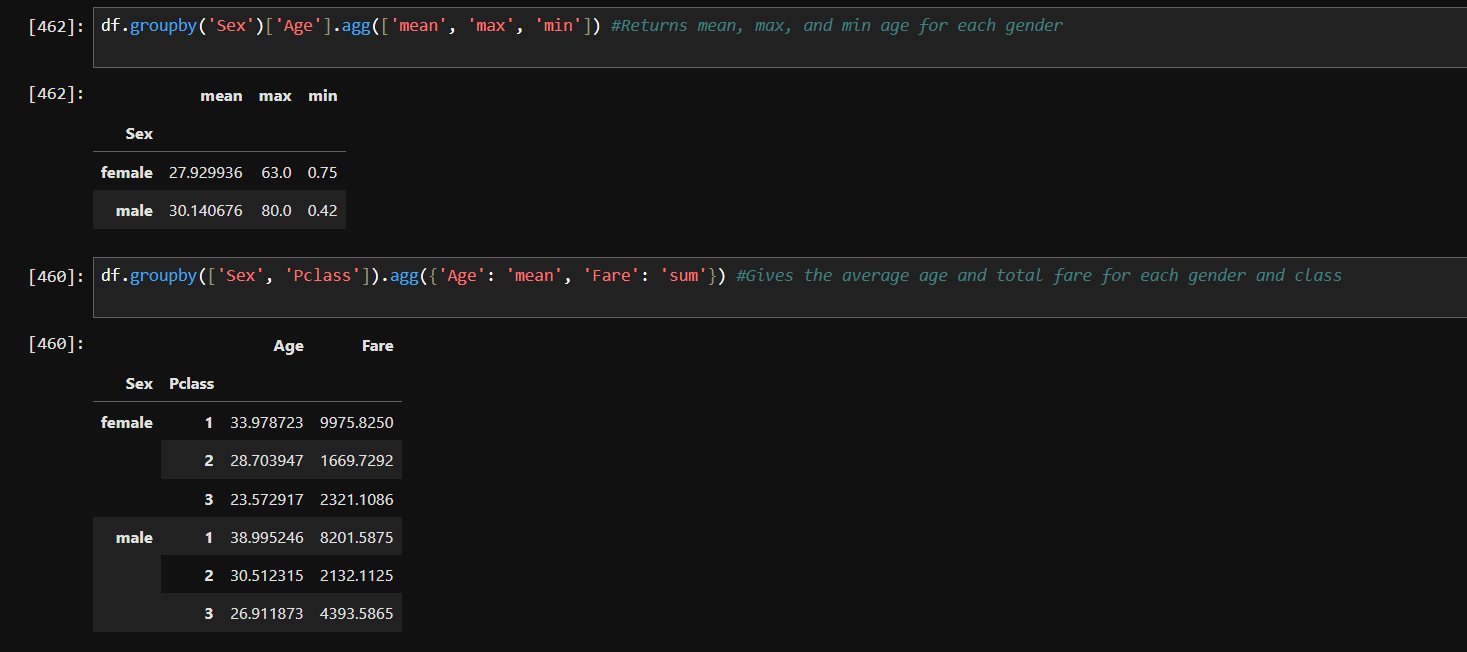
Grouping and aggregation in data analysis is like organizing your playlist by artist or genre — it helps you spot trends and patterns effortlessly.
Grouping involves splitting data into categories based on shared characteristics.
Aggregation comes in when you want to perform calculations on these groups, like finding the average sales, total revenue, or the number of products sold.
Let’s dive in and explore how grouping and aggregation can make data analysis more powerful.
groupby() - Groups data based on one or more columns.
General syntax - df.groupby('column_name')['target_column'].operation()

agg()-Performs multiple aggregation functions at once.
General Syntax - df.agg({'column1': 'func1', 'column2': 'func2'})
sort_values()-Sorts the DataFrame based on values in a specific column.
General Syntax - df.sort_values('column_name', ascending=True/False)

cumsum()- Calculates the cumulative sum.
General Syntax - df['column_name'].cumsum()

And that’s it! This blog was just me sharing what I’ve learned about Pandas so far, and I hope it helped you in some way. I’m definitely not a pro, just someone exploring and trying to understand things better.
If you have any feedback or suggestions, or if I got something wrong, I’d love to hear from you! Learning is always more fun when it’s a two-way conversation. So feel free to share your thoughts!
Let’s keep learning together.
Subscribe to my newsletter
Read articles from Sruti Mishra directly inside your inbox. Subscribe to the newsletter, and don't miss out.
Written by

Sruti Mishra
Sruti Mishra
Tech enthusiast on a journey to master AI/ML|MCA student| Documenting my learnings, challenges, and breakthroughs—one line of code at a time!