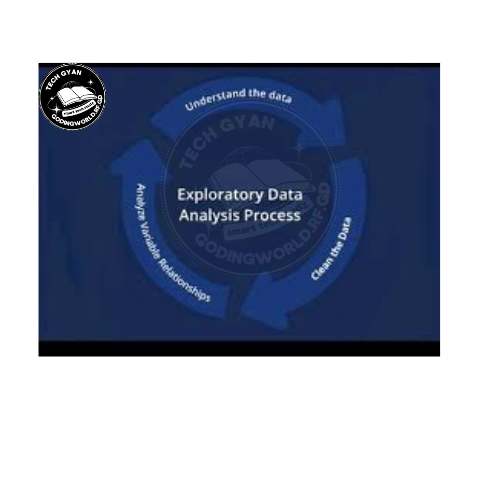
Exploratory Data Analysis and the Data Science Process
 techGyan : smart tech study
Introduction
Exploratory Data Analysis (EDA)?Exploratory Data Analysis (EDA) is a critical step in data science, allowing data professionals to understand the underlying patterns, trends, and structures in data. In this blog, we will discuss the fundamental concepts of EDA, its philosophy, the tools used, and its role in the data science process.
What is Exploratory Data Analysis (EDA)?
EDA is a statistical approach used to analyze datasets, summarize their key characteristics, and visualize them using various graphical techniques. The goal is to uncover insights that may not be apparent at first glance and prepare the data for further analysis and modeling.
Key Objectives of EDA:
Detect missing or incorrect data
Identify patterns, relationships, and correlations
Spot anomalies or outliers
Gain insights into feature distributions
Prepare data for machine learning models
Basic Tools of EDA
EDA employs various techniques to summarize and visualize data effectively. Here are some fundamental tools used in EDA:
1. Summary Statistics
Mean, Median, Mode: Measures of central tendency
Standard Deviation, Variance: Measures of data dispersion
Correlation Coefficient: Indicates relationships between variables
Skewness and Kurtosis: Measures of data distribution shape
2. Data Visualization Techniques
Histograms: Show the frequency distribution of numerical data
Box Plots: Highlight median, quartiles, and outliers
Scatter Plots: Display relationships between two numerical variables
Bar Charts: Compare categorical data
Heatmaps: Show correlations in a visually appealing manner
Philosophy of Exploratory Data Analysis (EDA)
The philosophy of EDA is simple: let the data tell its own story before applying complex models or assumptions. Instead of forcing the data into predefined statistical methods right away, EDA encourages a more open and flexible approach to understanding data.
Here are the key ideas behind EDA:
Open-minded exploration – Instead of making early assumptions, we explore the data freely to see what insights naturally emerge.
Visual representation for better understanding – Graphs, charts, and plots make it easier to spot trends, patterns, and unusual values (outliers).
Iterative data investigation – EDA is not a one-time process; we refine our analysis step by step as we learn more from the data.
Question-driven analysis – Rather than blindly applying formulas, we ask meaningful questions like:
What does the data look like?
Are there missing values?
Do different variables affect each other?
By following this philosophy, EDA helps us gain deep insights before diving into complex models, making our analysis more effective and accurate.
The Data Science Process
EDA is an integral part of the broader data science process, which consists of several key stages:
1. Problem Definition
Understanding the business problem and defining the objectives of the data analysis.
2. Data Collection
Gathering relevant data from different sources such as databases, APIs, and web scraping.
3. Data Cleaning
Handling missing values, removing duplicates, and correcting inconsistencies to prepare clean data.
4. Exploratory Data Analysis (EDA)
Performing summary statistics, visualizations, and anomaly detection to understand the dataset better.
5. Feature Engineering
Creating new features or transforming existing ones to improve predictive modeling.
6. Model Building
Applying machine learning algorithms to build predictive models.
7. Model Evaluation
Assessing model performance using metrics such as accuracy, precision, recall, and F1-score.
8. Deployment and Monitoring
Deploying the model into production and continuously monitoring its performance.
Conclusion
Exploratory Data Analysis plays a crucial role in the data science workflow by helping analysts uncover hidden insights and prepare data effectively for modeling. By leveraging statistical summaries and visualization techniques, data professionals can make informed decisions and enhance the overall data science process.
For more insights and practical examples, subscribe to TechGyan YouTube Channel where we explore data science concepts in an easy-to-understand manner!
#DataScience #EDA #TechGyan #MachineLearning #BigData #DataVisualization #AI #Python #DataAnalytics #DeepLearning
Subscribe to my newsletter
Read articles from techGyan : smart tech study directly inside your inbox. Subscribe to the newsletter, and don't miss out.
Written by

techGyan : smart tech study
techGyan : smart tech study
TechGyan is a YouTube channel dedicated to providing high-quality technical and coding-related content. The channel mainly focuses on Android development, along with other programming tutorials and tech insights to help learners enhance their skills. What TechGyan Offers? ✅ Android Development Tutorials 📱 ✅ Programming & Coding Lessons 💻 ✅ Tech Guides & Tips 🛠️ ✅ Problem-Solving & Debugging Help 🔍 ✅ Latest Trends in Technology 🚀 TechGyan aims to educate and inspire developers by delivering clear, well-structured, and practical coding knowledge for beginners and advanced learners.