Machine Learning Algorithms: A Beginner's Guide
 techGyan : smart tech study
Table of contents
- What is Machine Learning? 🤖🚀
- TYPES OF MACHINE LEARNING ALGORITHMS
- Supervised Learning Algorithms
- Mini Example:
- Popular Supervised Learning Algorithms
- a) Linear Regression
- How Does It Work?
- Mini Example:
- b) Logistic Regression
- How Does It Work?
- Mini Example:
- c) Decision Tree :
- d) k-Nearest Neighbors (k-NN):
- How Does It Work?
- Mini Example: Classifying Fruits 🍎🍌🍉
- Why Use k-NN?
- e) Support Vector Machines (SVM) :
- How Does It Work?
- Mini Example: Email Spam Detection 📩
- 2. Unsupervised Learning Algorithms
- Dimensionality Reduction – Explained Simply! 🤖📉
- Inroduction to Neutral Networks:
- Reinforcement Learning Algorithms:
- Conclusion
Ever wondered how Netflix knows exactly what to recommend? Or how Instagram shows you ads for products you just searched on Amazon? No, your phone isn’t hacked—it’s Machine Learning at work!
Machine Learning is the driving force behind AI, automation, and smart recommendations, helping businesses analyze data, predict outcomes, and make decisions automatically. If you’re into AI, Data Science, or ML, mastering key machine learning algorithms is essential for success.
In this guide, we’ll explore the Top 10+ Must-Know Machine Learning Algorithms to help you build a strong foundation in ML. Whether you're a beginner or an expert, understanding these algorithms will supercharge your ML skills.
What is Machine Learning? 🤖🚀
Machine Learning is like teaching computers to think and learn on their own—just like humans learn from experience! Instead of following fixed rules, ML algorithms analyze data, find patterns, and improve over time.
These smart algorithms can handle huge amounts of data and make accurate predictions. That’s why they are used in things like Netflix recommendations, self-driving cars, and even stock market predictions! 📊
For example, if you want to predict stock prices, an ML algorithm like K-Nearest Neighbors (KNN) can analyze past data and make predictions. The more data it gets, the smarter it becomes!.
In this blog by TechGyan, we’ll explore key machine learning algorithms, their applications, and why they matter.
TYPES OF MACHINE LEARNING ALGORITHMS
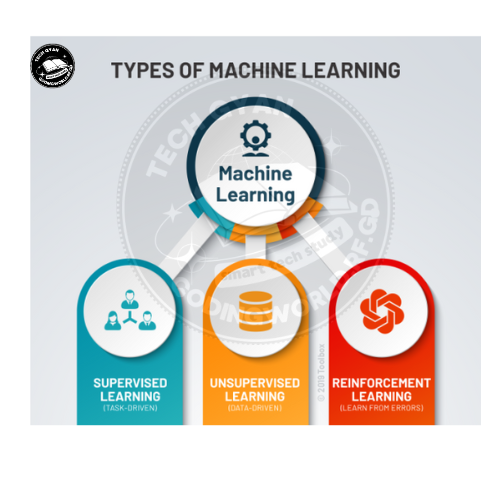
Machine learning algorithms are broadly categorized into three types:
Supervised Learning Algorithms
Unsupervised Learning Algorithms
Reinforcement Learning Algorithms
Supervised Learning Algorithms
Supervised Learning is like learning with a teacher! 📚 The computer is trained using labeled data, which means it already knows the correct answers while learning.
👉 How does it work?
Imagine you're learning to identify fruits 🍎🍌. If I show you pictures of apples and bananas with labels, you will quickly learn to recognize them. Later, when I show you a new fruit, you can guess whether it's an apple or a banana based on what you learned.In the same way, Supervised Learning algorithms use past data with correct answers to make predictions for new data.
Mini Example:
📩 Spam Email Detection
We train an ML model using thousands of emails labeled as “Spam” or “Not Spam.”
The model learns patterns (like suspicious words or links).
When a new email arrives, it predicts whether it’s spam or not.
Popular Supervised Learning Algorithms
✅ Linear Regression – Predicts values (e.g., house prices based on size).
✅ Logistic Regression – Used for classification (e.g., whether an email is spam or not).
✅ Decision Trees – Works like a flowchart for decision-making.
✅ k-Nearest Neighbors (k-NN) – Classifies data based on the closest similar examples.
✅ Support Vector Machines (SVM) – Helps classify things into two groups.
💡 In short: Supervised Learning is all about learning from examples to make smart predictions in the future! 🚀
a) Linear Regression
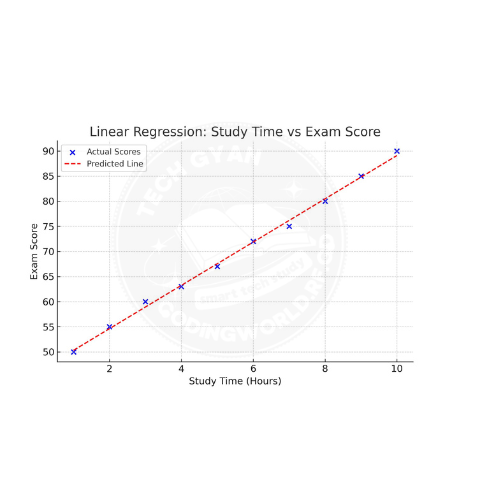
Linear Regression is like drawing a straight line 📏 through data points to predict future values. It helps us understand the relationship between two things (like study time and exam scores).
How Does It Work?
Imagine you own a fruit shop 🍎🍌 and want to predict how much you’ll earn based on the number of fruits you sell.
You collect past sales data (e.g., when you sold more fruits, you made more money).
A straight line is drawn through this data to show the trend.
Now, if you sell more fruits tomorrow, you can use this line to predict your earnings!
Mini Example:
📚 Study Time vs. Exam Score
More study time ⏳ usually leads to higher scores 📊.
If we plot study time on the X-axis and exam scores on the Y-axis, we can draw a straight line to predict future scores.
b) Logistic Regression
Logistic Regression is a smart way to make decisions between two options—like YES or NO, Spam or Not Spam, Pass or Fail.
How Does It Work?
Think of a self-driving car 🚗. It needs to decide whether to stop or go at a traffic signal.
The car looks at traffic light colors (🔴, 🟡, 🟢).
It analyzes past data and learns that red means STOP and green means GO.
Next time, when it sees a red light, it confidently predicts “STOP”.
Mini Example:
📧 Spam Email Detection
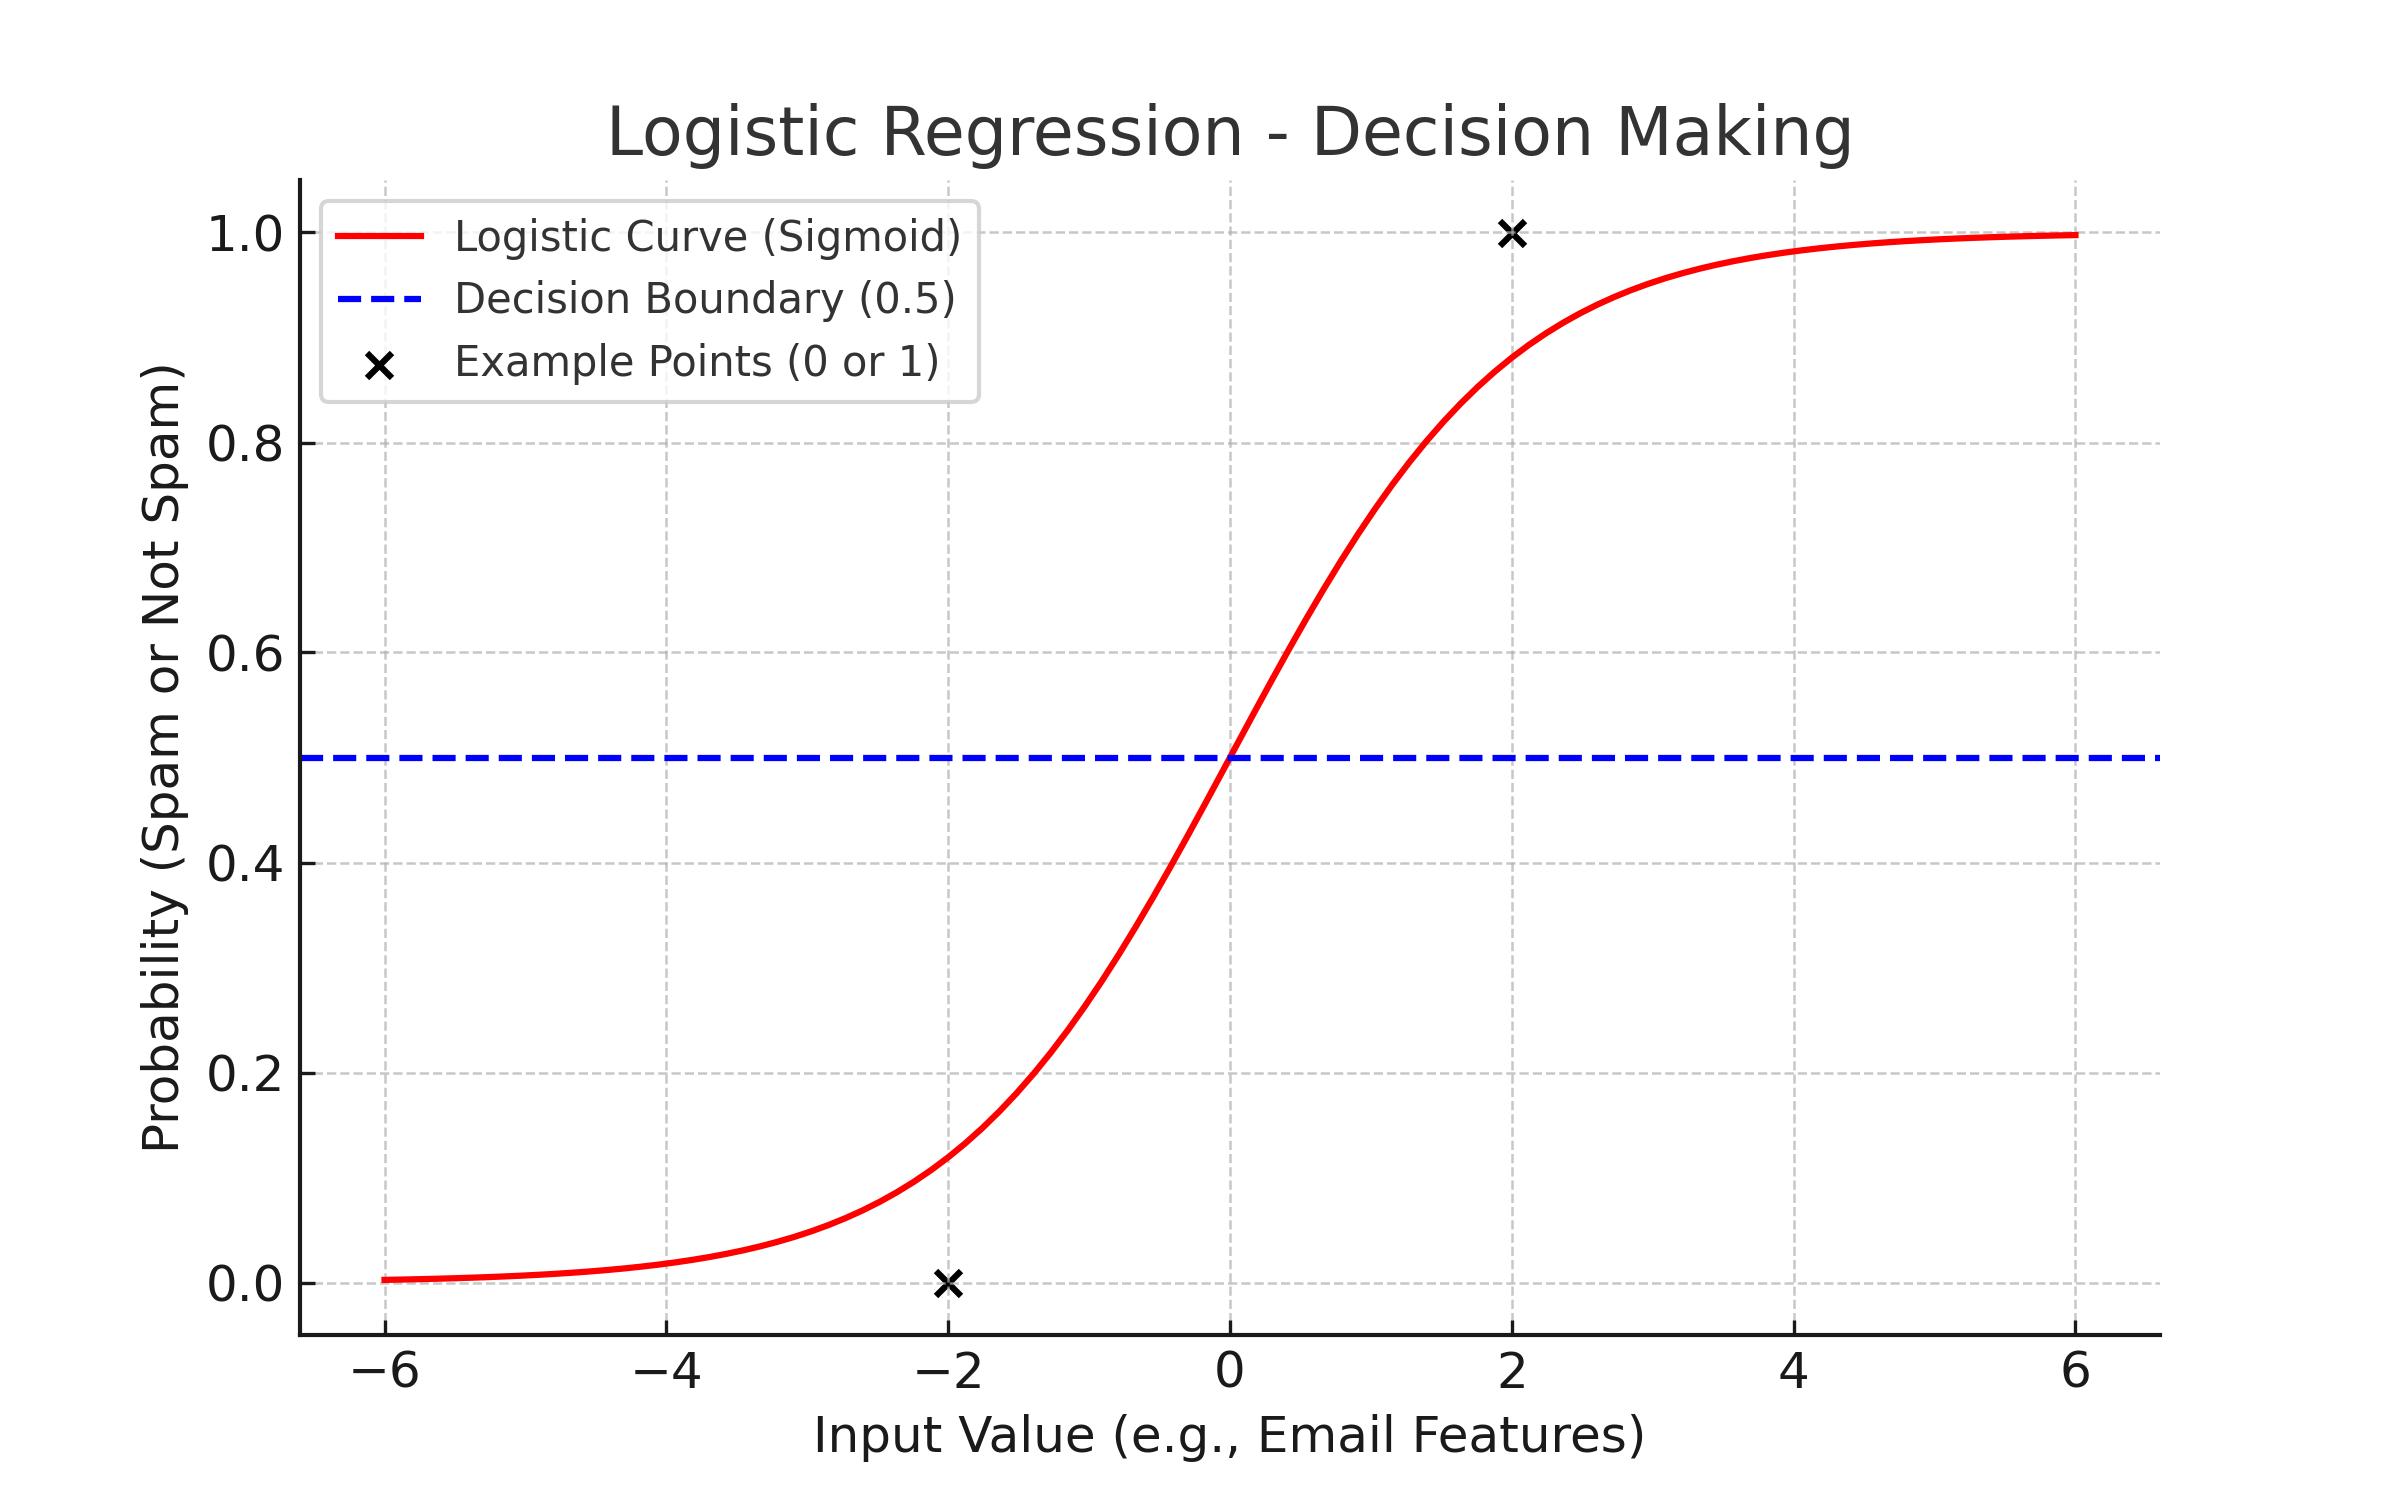
If an email has suspicious words, Logistic Regression can classify it as Spam (1) or Not Spam (0).
Instead of drawing a straight line (like in Linear Regression), it uses a curved S-shaped line (called the Sigmoid function) to make decisions between two categories.
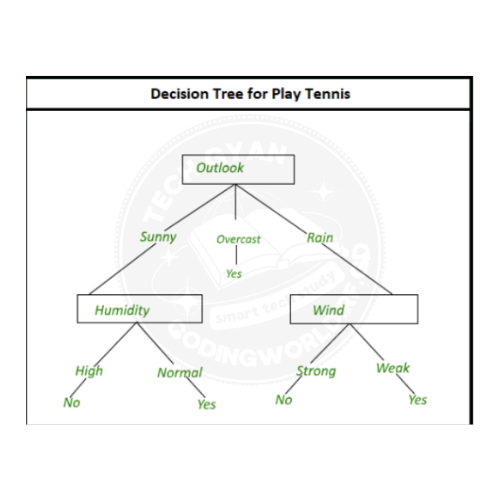
c) Decision Tree :
A Decision Tree is a simple way for computers to make decisions step by step, just like how we answer questions to solve a problem.
It is mostly used for classifying things (like spam vs. not spam).
The tree-like structure has:
Nodes → Ask questions about the data
Branches → Show possible answers (Yes/No)
Leaves → Give the final decision
A popular method called CART (Classification and Regression Trees) helps computers start from the top (root) and move step by step to get answers.
💡 In short: Decision Trees split data into smaller parts and keep asking questions until they find the right answer! 🚀
d) k-Nearest Neighbors (k-NN):
k-NN is like asking your neighbors for advice before making a decision!
KNN is a simple algorithm that predicts the output for a new data point by comparing it with nearby points in the training data. It is used for both classification and regression.
How Does It Work?
Imagine you move to a new city 🏙️ and want to find a good restaurant 🍽️. You ask your nearest 3 neighbors (k=3):
🍕 2 people suggest an Italian restaurant
🍣 1 person suggests a Sushi place
Since the majority (2 out of 3) picked Italian, you decide to try Italian food! 🇮🇹✨
This is exactly how k-NN works! It looks at nearby examples and picks the most common category.
Mini Example: Classifying Fruits 🍎🍌🍉
You have new fruit and want to know if it’s an apple or banana.
The algorithm looks at the closest known fruits (neighbors).
If most nearby fruits are apples, it labels the new fruit as an apple! 🍎✅
Why Use k-NN?
✅ Simple & Easy to Understand
✅ Great for Classification (e.g., Spam vs. Not Spam emails)
✅ No Need for Training – Just Stores Data & Finds Neighbors
💡 In short: k-NN makes decisions by looking at the closest examples and picking the most common one! 🚀.
e) Support Vector Machines (SVM) :
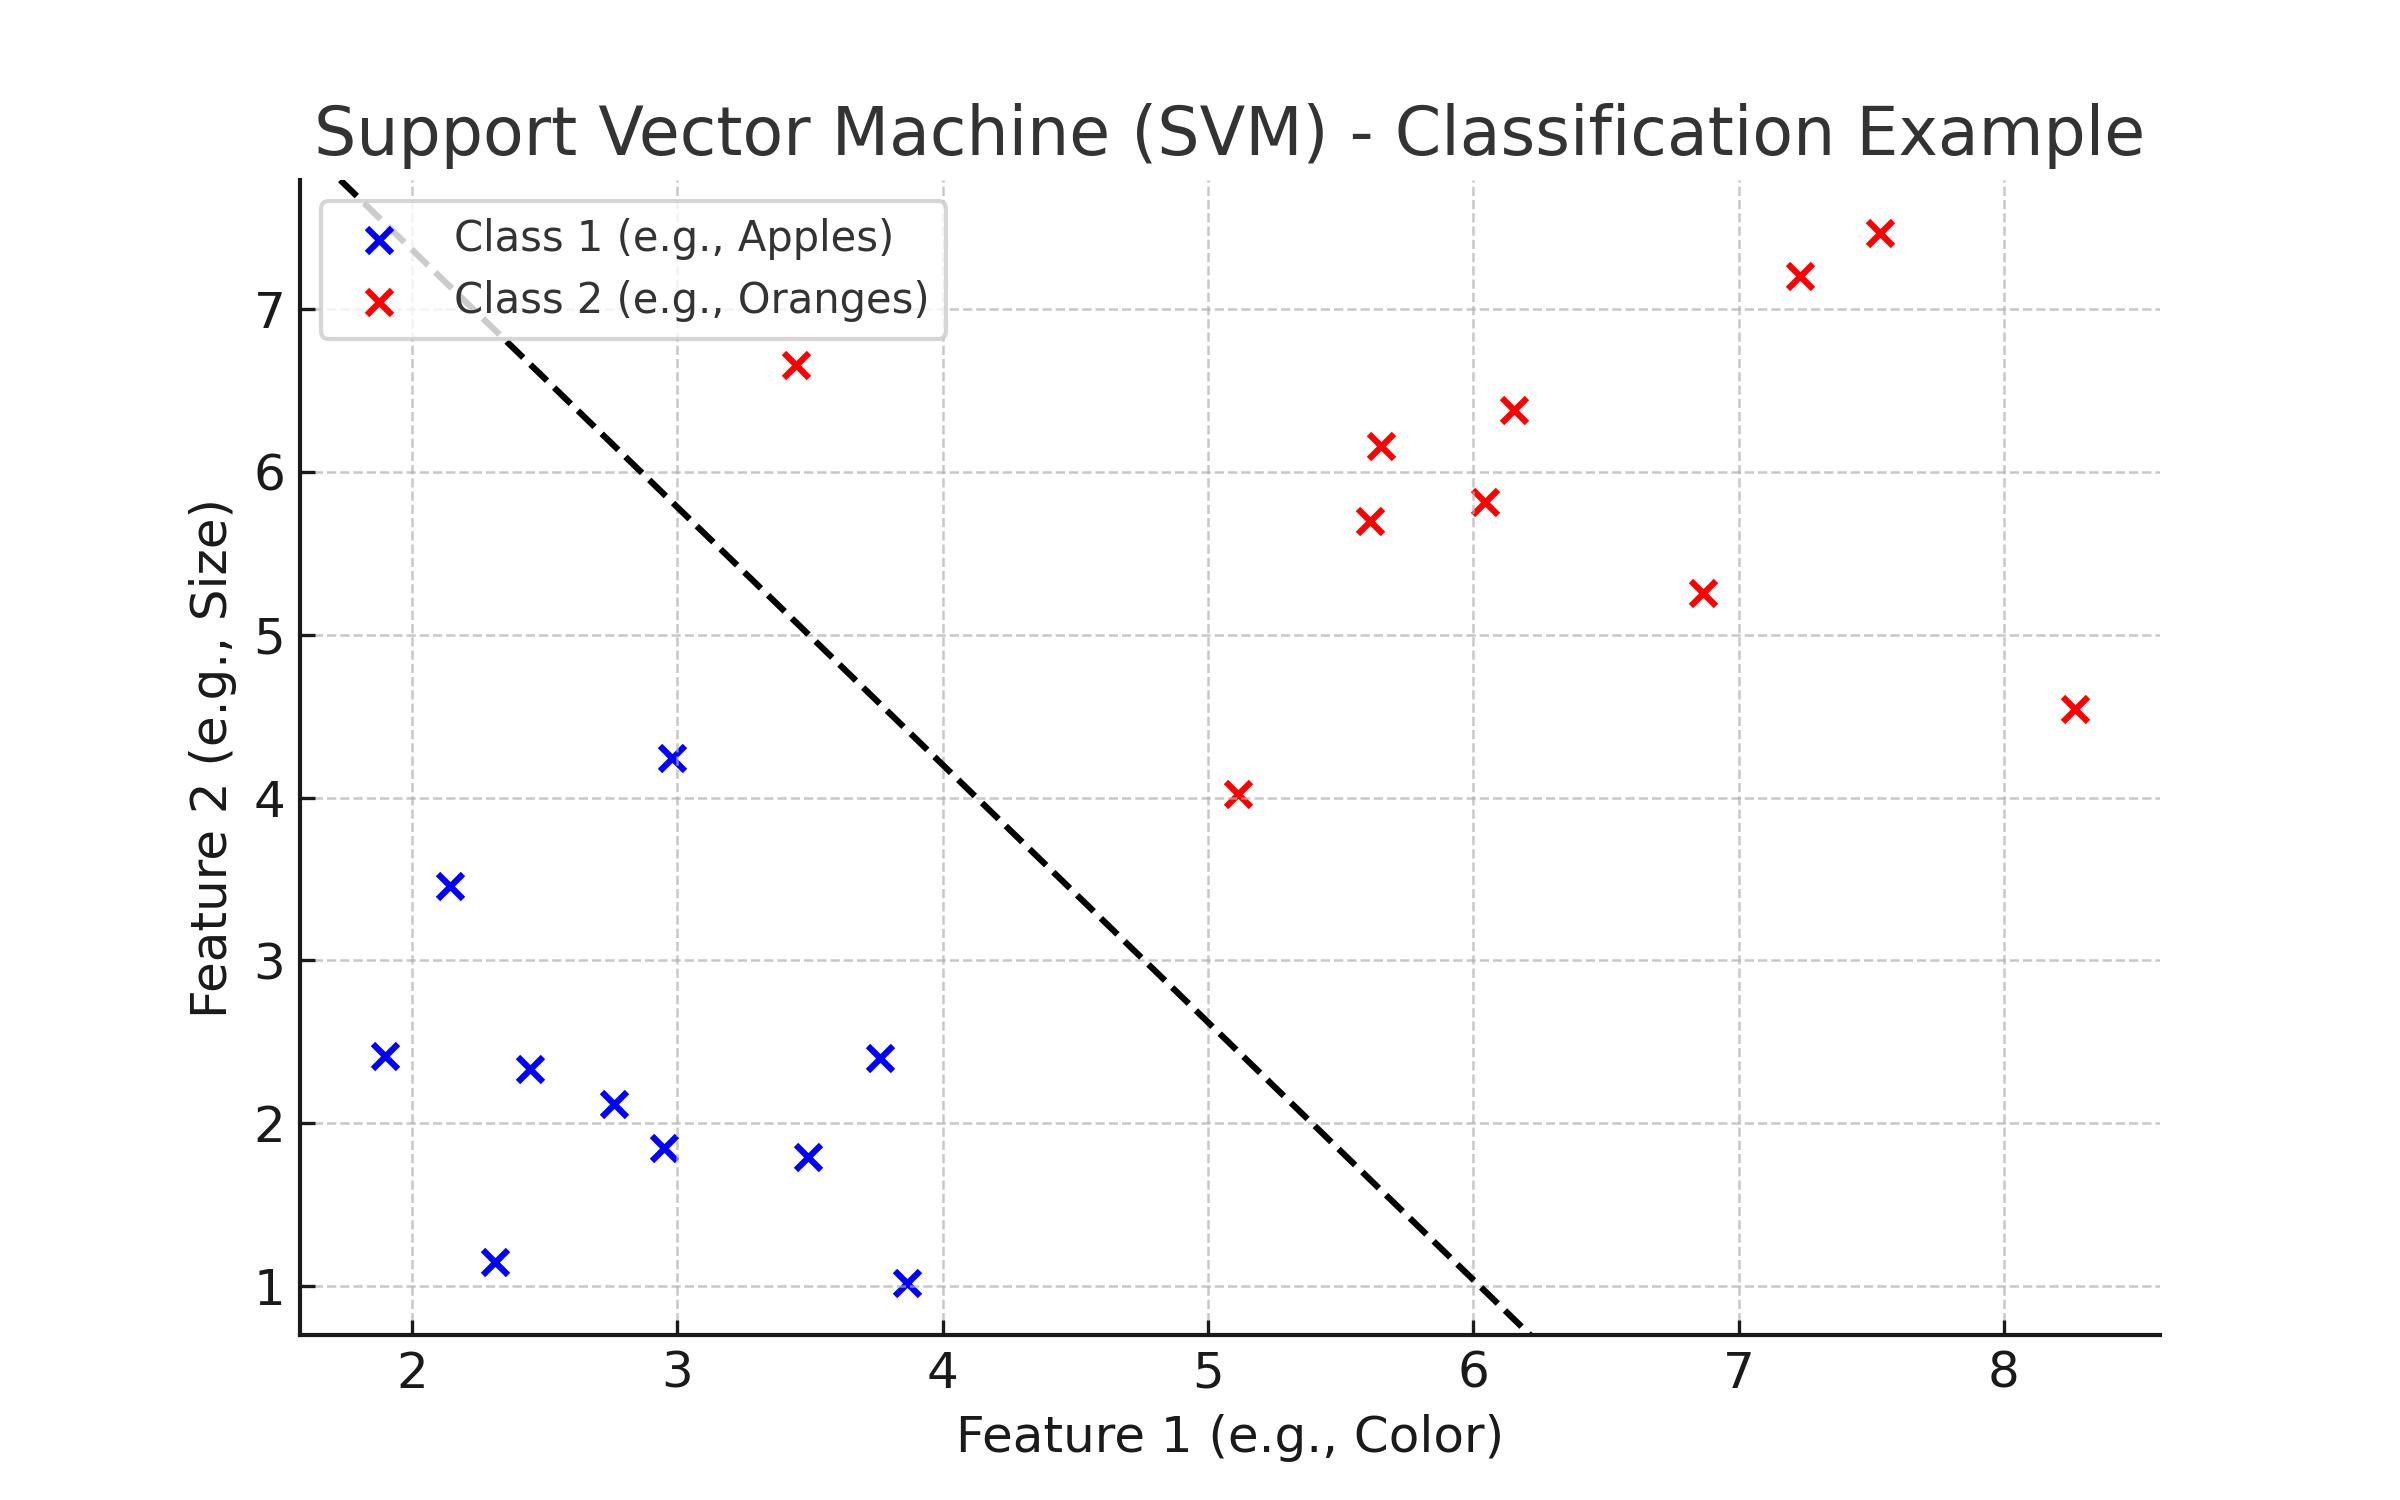
SVM is like drawing a perfect line 📏 between two groups of data so that they stay as far apart as possible. It helps computers classify things into categories (like apples vs. oranges).
How Does It Work?
Imagine you have two types of fruits 🍎🍊, and you want to separate them based on their color and size.
SVM finds the best possible line (or boundary) that clearly separates the two groups.
This boundary is called a hyperplane, and SVM makes sure it's as far away from both groups as possible.
Mini Example: Email Spam Detection 📩
SVM looks at email words, links, and sender info.
It draws a boundary between “Spam” and “Not Spam” emails.
When a new email arrives, SVM checks which side of the boundary it falls on to decide if it's spam or not!
2. Unsupervised Learning Algorithms
Unsupervised learning algorithms are machine learning methods that analyze and find patterns in data without labeled outputs. These algorithms explore data to uncover hidden structures, relationships, or groups without prior training on correct answers.
Unsupervised learning doesn’t use labeled data (no correct answers). Instead, it finds patterns and structures in the data by itself. Here’s how it works:
Input Data – The algorithm gets raw data without labels.
Pattern Detection – It looks for similarities, relationships, or structures in the data.
Grouping or Simplifying – Based on the patterns, it:
Creates groups (Clustering) – Like sorting different animals without knowing their names.
Finds relationships (Association) – Like noticing that people who buy chips often buy soda.
Reduces complexity (Dimensionality Reduction) – Like making a long story shorter while keeping key points.
Output – The algorithm gives insights, like groups of similar customers or important features in data.
💡 In short, the computer explores the data and organizes it in a meaningful way—without human guidance! 🚀
Popular Unsupervised Learning Algorithms
✅ K-means Clustering– Predicts values (e.g., house prices based on size).
✅ Mean-Shift Clustering– Used for classification (e.g., whether an email is spam or not).
✅ Dimensionality Reduction – Works like a flowchart for decision-making.
✅Hierarchical Clustering – Classifies data based on the closest similar examples.
a) K-means Clustering:
K-Means is a popular clustering algorithm that groups similar data points into K clusters. It works by:
Choosing K cluster centers (randomly at first).
Assigning each data point to the nearest cluster.
Moving the cluster centers to the average position of their assigned points.
Repeating steps 2 and 3 until the clusters don’t change.
Example:
Imagine we have data on customers' spending habits. K-Means can divide them into K groups, like:
High spenders
Medium spenders
Low spenders
This helps businesses target the right audience with different marketing strategies.
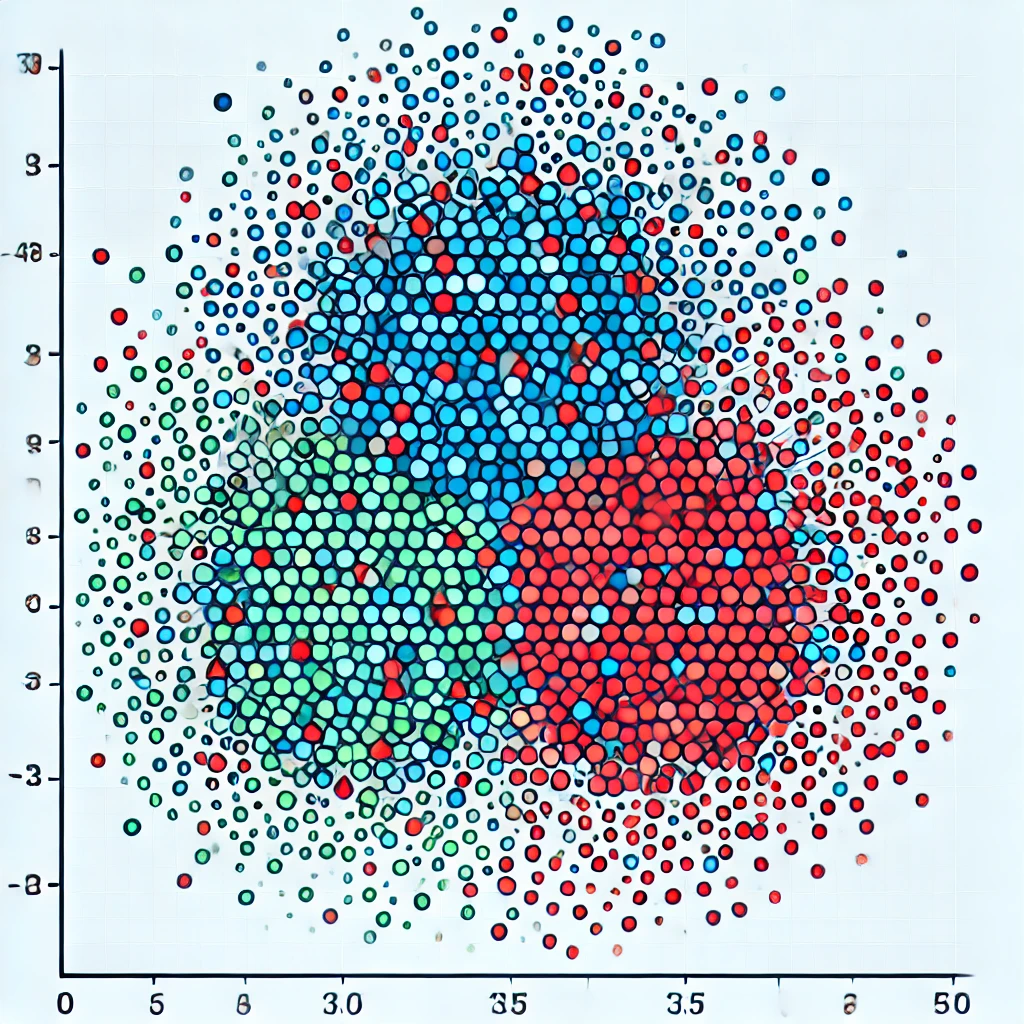
Here is an image illustrating K-Means Clustering. The different colored clusters represent groups of similar data points, with the "X" marks showing the centroids (cluster centers).
b) Mean-Shift Clustering:
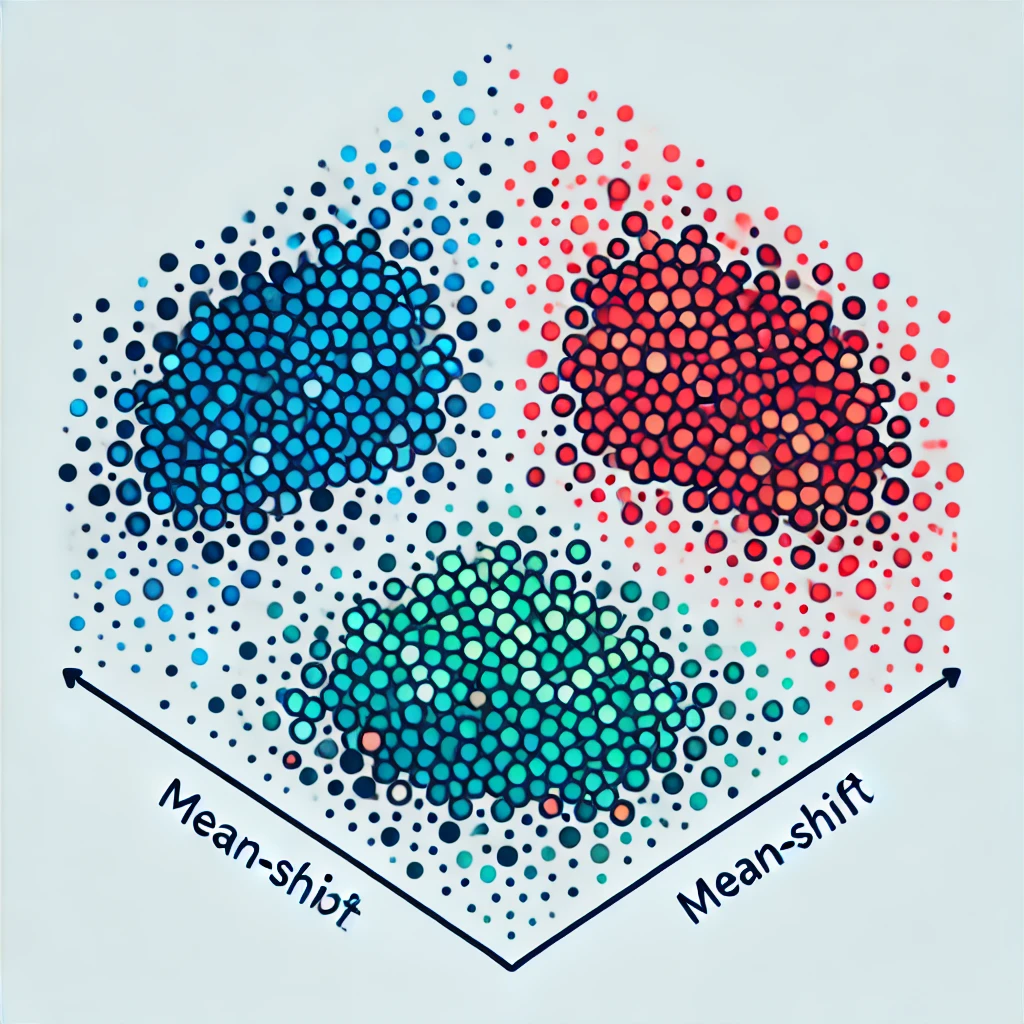
Mean-Shift is a clustering algorithm that finds high-density areas in data and groups them. It works by:
Placing points randomly in the data.
Shifting each point towards the densest region nearby (like moving to the busiest spot in a market).
Repeating until clusters form naturally.
Example:
Imagine a city with many cafés. Mean-Shift can help find the busiest café areas by identifying where people gather the most. This helps businesses decide the best location for a new café.
c) Dimensionality Reduction:
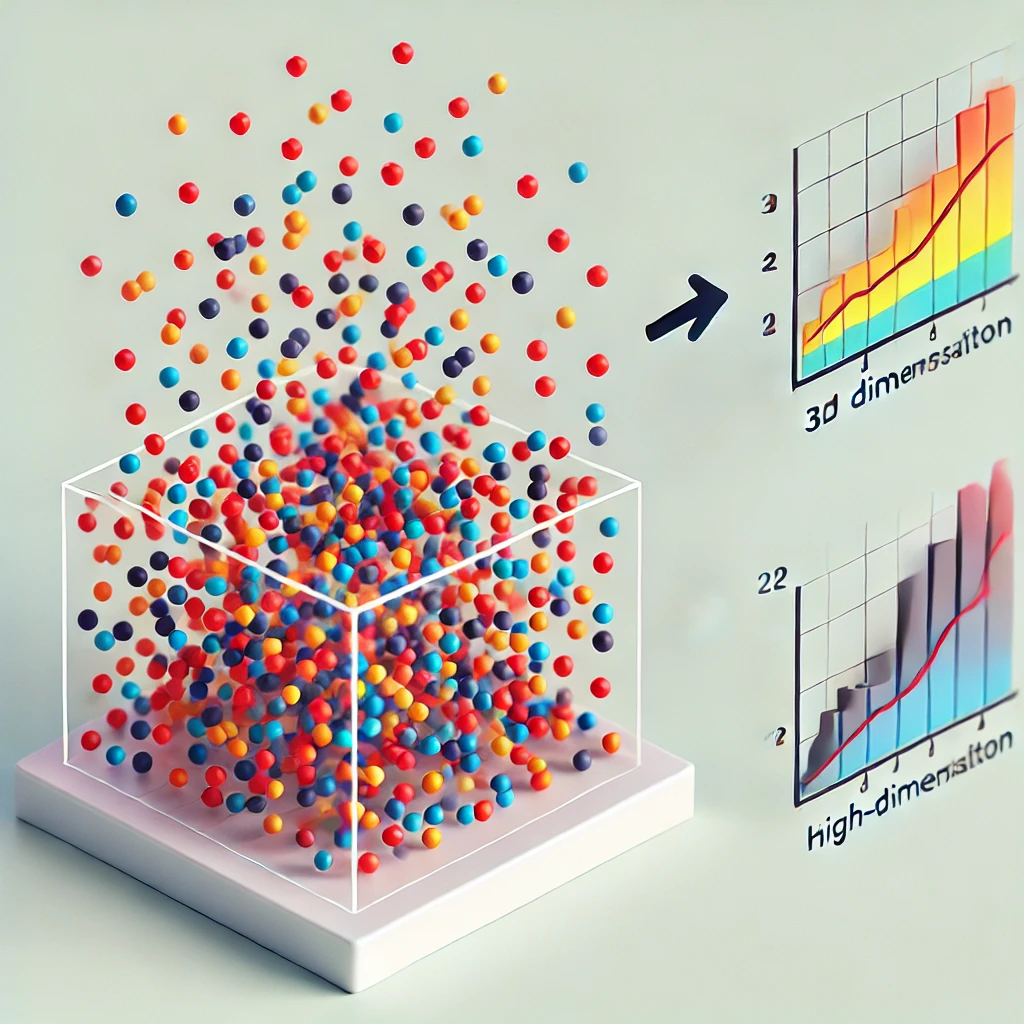
Dimensionality reduction is a technique used in machine learning to simplify complex data by removing unnecessary details while keeping the important information.
Example:
Imagine you have a large textbook, but you only need the main ideas for an exam. Instead of reading 500 pages, you create a short summary that keeps the key points.
Similarly, in machine learning:
A high-resolution image (1000x1000 pixels) can be compressed to a smaller size while keeping the important details.
A dataset with 100 features (columns) can be reduced to just 2 or 3 key features for better visualization and analysis.
Common Dimensionality Reduction Techniques:
PCA (Principal Component Analysis) – Finds the most important directions in data.
t-SNE (t-Distributed Stochastic Neighbor Embedding) – Helps visualize high-dimensional data in 2D or 3D.
d) Hierarchical Clustering:
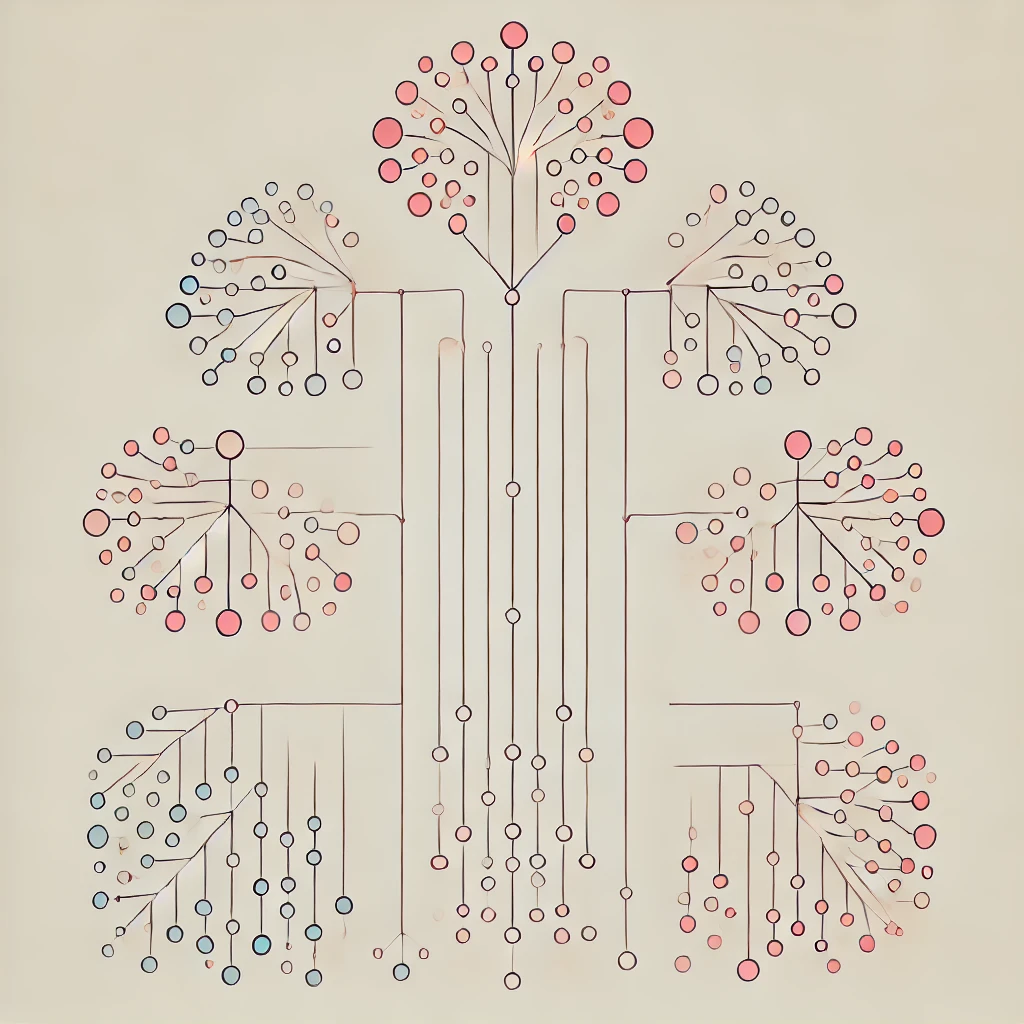
Hierarchical clustering groups data step by step by either:
Agglomerative (Bottom-Up) – Each point starts as its own cluster, and they merge together gradually.
Divisive (Top-Down) – Starts with all points in one big cluster, then splits them into smaller groups.
The result is a tree-like structure called a dendrogram, which shows how clusters are formed.
Example:
Imagine we want to group animals based on their characteristics:
Step 1: Each animal starts as its own group.
Step 2: Similar animals (like dogs and wolves) merge into small groups.
Step 3: Small groups merge into bigger categories (like all mammals together).
Final Step: A tree diagram shows the relationships between all animals.
This method is useful for family trees, customer segmentation, and document classification.
Dimensionality Reduction – Explained Simply! 🤖📉
Dimensionality Reduction is like organizing a messy room 🏠✨—you remove unnecessary things while keeping only the important ones.
Why Do We Need It?
Imagine you have a dataset with too many features (columns) 📊, like a survey with 100+ questions. Not all questions are important! So, we reduce the number of features while keeping the most useful information.
How Does It Work?
It removes unimportant or redundant data to make machine learning models faster and more efficient 🚀.
It helps in better visualization (e.g., reducing data from 3D to 2D for easy plotting).
Mini Example: Reducing Student Data 📚
Imagine you have student data with 10 features (Name, Age, Grades, Attendance, etc.), but only Grades and Attendance matter for predicting exam scores.
Dimensionality reduction removes the extra features and keeps only the useful ones!
Popular Dimensionality Reduction Techniques
✅ Principal Component Analysis (PCA) – Finds the most important patterns in data and removes noise.
✅ t-SNE (t-Distributed Stochastic Neighbor Embedding) – Used for visualization by reducing high-dimensional data into 2D or 3D.
✅ Autoencoders – Uses deep learning to compress and reconstruct important data.
💡 In short: Dimensionality Reduction simplifies data by removing unnecessary details while keeping the most important information! 🚀
Inroduction to Neutral Networks:
A Neural Network is a computer model inspired by the human brain 🧠. It helps machines learn from data and make smart decisions just like humans do!
How Does It Work?
Imagine you’re trying to recognize a cat in a photo 🐱📸. A Neural Network works step by step:
1️⃣ Input Layer – Takes the image as input (just like your eyes 👀).
2️⃣ Hidden Layers – Breaks down the image into patterns (like shapes, edges, and colors).
3️⃣ Output Layer – Finally decides: "Is it a cat or not?" ✅❌
It learns by adjusting itself over time, just like how humans learn from experience!
Mini Example: Handwriting Recognition ✍️
You write the number "8" on your phone.
A Neural Network scans your handwriting.
It compares it with thousands of other "8s" it has seen before.
It correctly predicts that you wrote "8"! ✅
Why Use Neural Networks?
✅ Great for recognizing images, speech, and patterns
✅ Powers AI in self-driving cars, chatbots, and even Netflix recommendations!
✅ Keeps improving as it learns from more data
💡 In short: Neural Networks help computers learn from data by working like a mini human brain! 🚀
Reinforcement Learning Algorithms:
Reinforcement Learning (RL) is a type of machine learning where a computer (called an "agent") learns by trial and error to make the best decisions. It interacts with an environment, gets feedback (rewards or penalties), and improves over time.
How It Works:
Agent – The learner (e.g., a robot, game-playing AI).
Environment – The world the agent interacts with (e.g., a chessboard, a self-driving car's road).
Actions – The choices the agent can make.
Rewards/Penalties – Feedback given for good or bad actions.
Policy – A strategy the agent follows to maximize rewards.
Example:
Imagine training a dog:
If the dog sits when commanded → Give a treat (reward).
If the dog jumps on the sofa → Say "No!" (penalty).
Over time, the dog learns to sit for rewards and avoid jumping on the sofa.
Types of RL Algorithms:
Model-Free RL – Learns from experience (e.g., Q-Learning, Deep Q-Networks).
Model-Based RL – Tries to predict future actions (e.g., AlphaGo).
Model-Free RL:
Model-Free RL is a type of learning where an agent learns by trying things out—without knowing how the environment works. It doesn’t plan ahead; it just learns from experience by getting rewards or penalties.
Easy Example: Teaching a Kid to Ride a Bicycle 🚴♂️
The child starts pedaling randomly (taking actions).
If they balance well, they keep riding (reward ✅).
If they fall, they learn what not to do (penalty ❌).
By trial and error, they slowly figure out how to ride smoothly.
The child doesn’t know the "rules" of physics, but they learn by doing—just like Model-Free RL!
Popular Model-Free RL Algorithms:
Q-Learning – Learns the best actions step by step.
Deep Q-Networks (DQN) – Uses deep learning to improve decision-making.
💡 In short, Model-Free RL is like learning from experience without knowing the rules in advance! 🚀
Model-Based RL:
Model-Based RL is a learning method where an agent builds a model of the environment and plans ahead before taking actions. Instead of just learning by trial and error (like Model-Free RL), it tries to predict what will happen next based on its past experiences.
Easy Example: Playing Chess
A chess player thinks ahead before making a move.
They imagine different moves and predict how the opponent might respond.
Based on this, they choose the best move instead of randomly trying things.
Over time, they improve their strategy and make smarter decisions.
This is like Model-Based RL, where the agent creates a mental "model" of the game and plans its actions!
Popular Model-Based RL Algorithms:
AlphaGo – Learned to play Go by predicting moves and planning strategies.
Monte Carlo Tree Search (MCTS) – Used in AI to simulate different future possibilities.
💡 In short, Model-Based RL helps AI plan ahead by understanding how the environment works—just like how humans think before acting! 🚀
Conclusion
Machine learning is the backbone of modern AI-driven applications. Understanding these algorithms gives you a strong foundation in the field of AI and Data Science. Whether you are working on predictive analytics, recommendation systems, or AI-powered automation, these ML algorithms will shape the future.
At TechGyan, we are committed to delivering high-quality educational content. Stay tuned for more ML and AI tutorials!
Do you want to learn ML with real-world projects? Subscribe to our YouTube channel TechGyan and start your journey today!
🔥 Stay Connected:
📌 Website: TechGyan 📌 YouTube: TechGyan Channel 📌 Twitter: @TechGyan
#MachineLearning #TechGyan #AI #DataScience
Subscribe to my newsletter
Read articles from techGyan : smart tech study directly inside your inbox. Subscribe to the newsletter, and don't miss out.
Written by

techGyan : smart tech study
techGyan : smart tech study
TechGyan is a YouTube channel dedicated to providing high-quality technical and coding-related content. The channel mainly focuses on Android development, along with other programming tutorials and tech insights to help learners enhance their skills. What TechGyan Offers? ✅ Android Development Tutorials 📱 ✅ Programming & Coding Lessons 💻 ✅ Tech Guides & Tips 🛠️ ✅ Problem-Solving & Debugging Help 🔍 ✅ Latest Trends in Technology 🚀 TechGyan aims to educate and inspire developers by delivering clear, well-structured, and practical coding knowledge for beginners and advanced learners.