Uptime-Kuma- Self Hosted Monitoring Tool
 Samikshya Sapkota
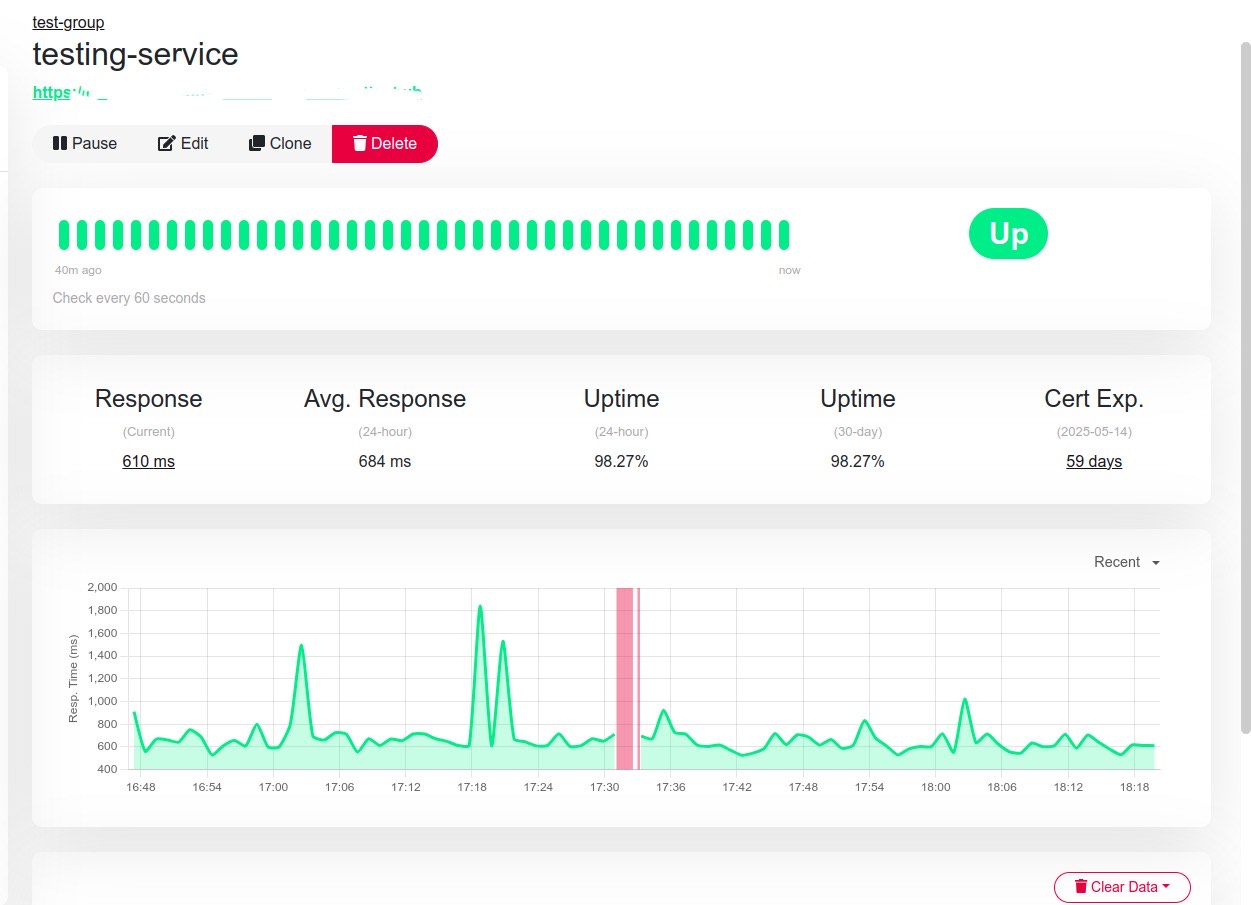
Introduction
In this article, we will walk through the process of setting up Uptime Kuma, a self-hosted monitoring tool, to keep track of the health and availability of our microservices. We will configure Uptime Kuma to monitor multiple microservices, set up real-time alert notifications via Slack.
Additionally, we will configure NGINX as a reverse proxy to secure and optimize access to Uptime Kuma. This setup will allow us to forward traffic and enable SSL.
By the end of this guide, you will have a fully functional monitoring system that provides instant alerts and a visual representation of service status, helping you proactively manage downtime and performance issues.
Prerequisites
Before proceeding, ensure you have the following:
A Linux Server
Docker Installed
Access to Slack Webhooks
NGINX Installed (For Reverse Proxy)
Uptime-Kuma
Uptime Kuma is an open source, self-hosted monitoring tool designed to track the uptime and availability of websites, APIs, servers, databases, and other network services. It provides real-time status updates, alert notifications, and a customizable status page to keep you informed about service health.
Install Uptime-Kuma using docker
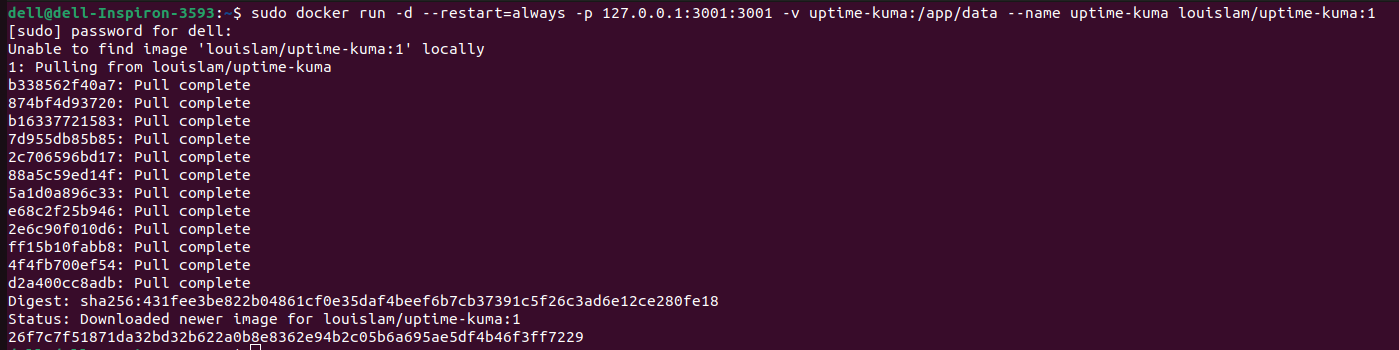
you can run this command to install uptime-kuma
docker run -d --restart=always -p 127.0.0.1:3001:3001 -v uptime-kuma:/app/data --name uptime-kuma louislam/uptime-kuma:1
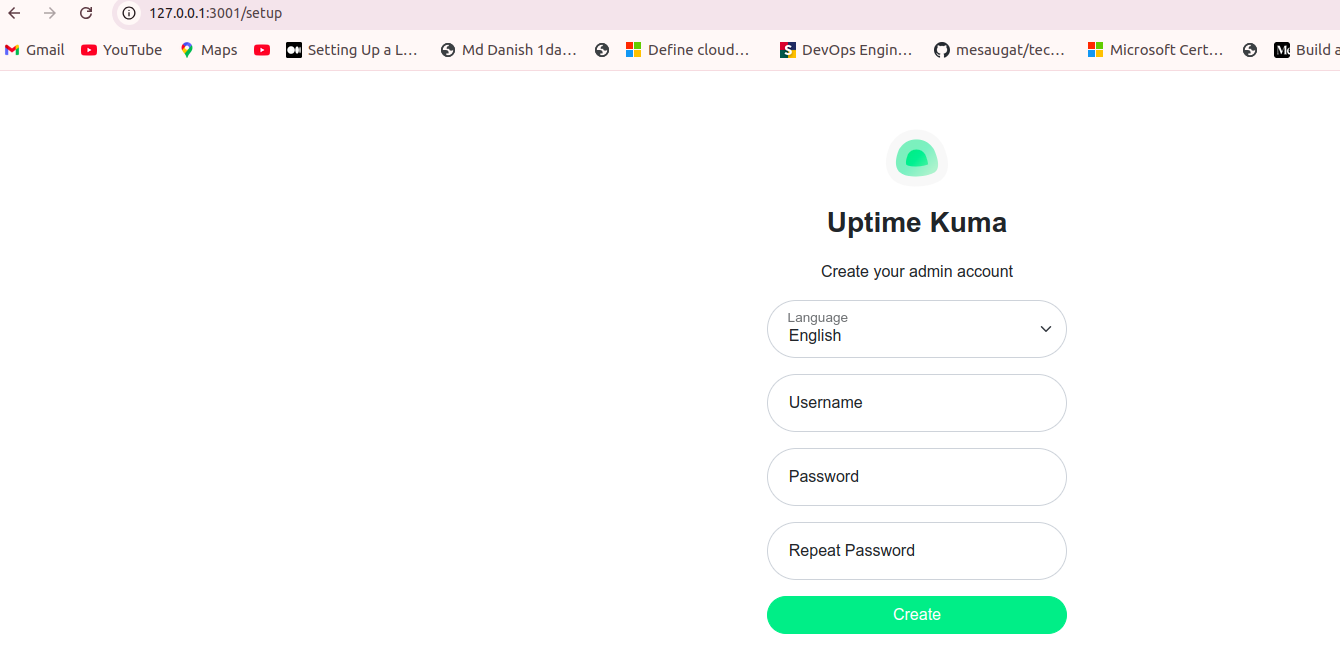
you can set username and password as you want
Note: This is run in 3001 port so, we will install nginx and configure uptime-kuma and run uptime-kuma in 80 port.
sudo apt update
sudo apt install nginx
sudo ufw allow 'Nginx HTTP'
systemctl status nginx
navigate to the sites-available and configure our uptime
cd /etc/nginx/sites-available
rm default
nano uptime-kuma
server {
    listen 80;  # Listen on all interfaces on port 80
    server_name localhost;  # Public IP address of the server

    location / {
        proxy_pass http://localhost:3001;  # Forward traffic to Uptime Kuma running on localhost:3001
        proxy_set_header Host $host;
        proxy_set_header X-Real-IP $remote_addr;
        proxy_set_header X-Forwarded-For $proxy_add_x_forwarded_for;
        proxy_set_header X-Forwarded-Proto $scheme;
    }
}
sudo ln -s /etc/nginx/sites-available/uptime-kuma /etc/nginx/sites-enabled/
sudo nginx -t
sudo systemctl restart nginx
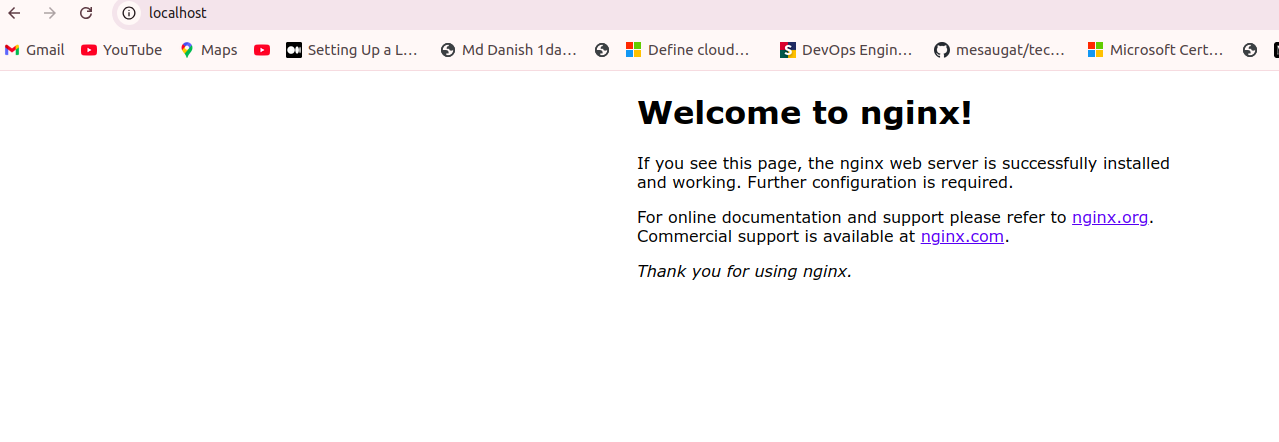
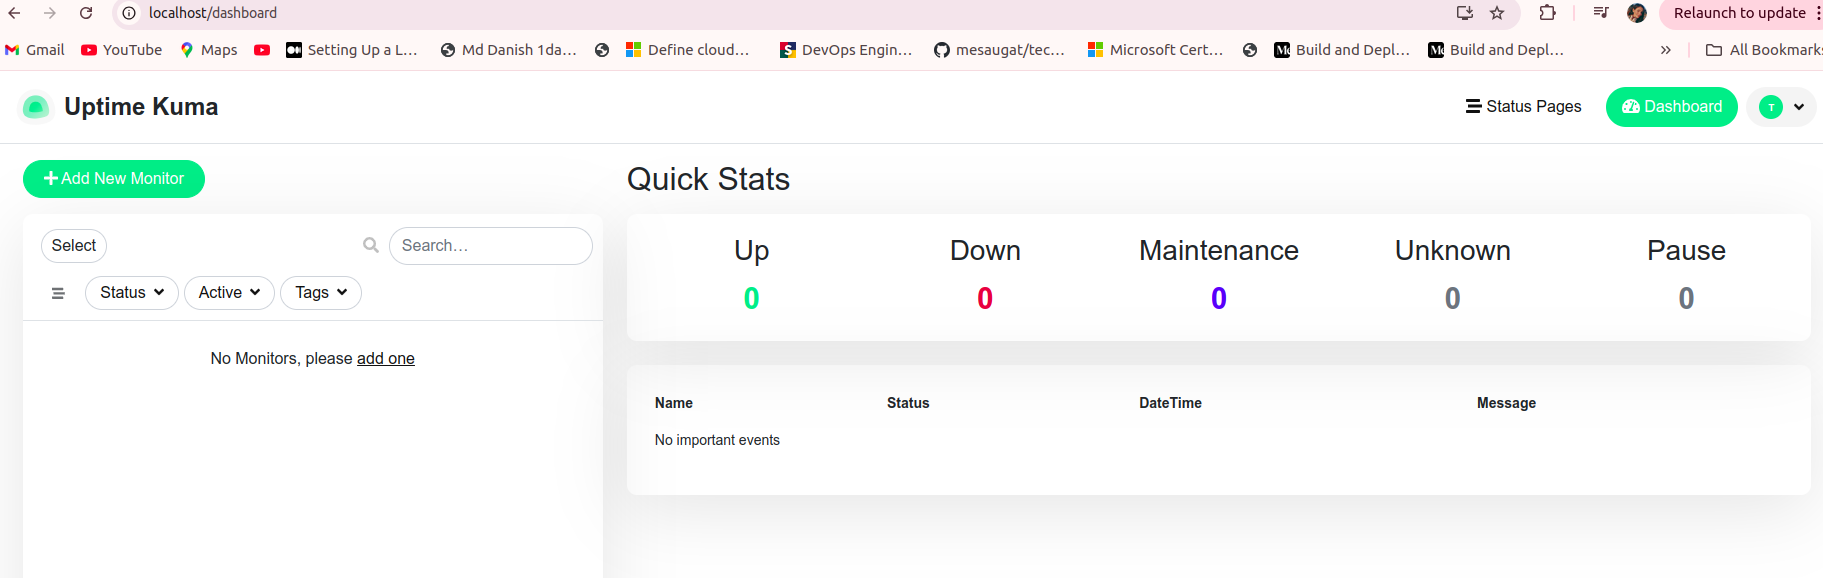
Now, you can see the page like this
Monitoring micro-services
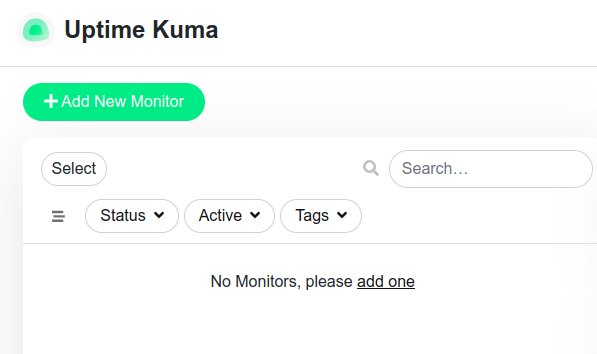
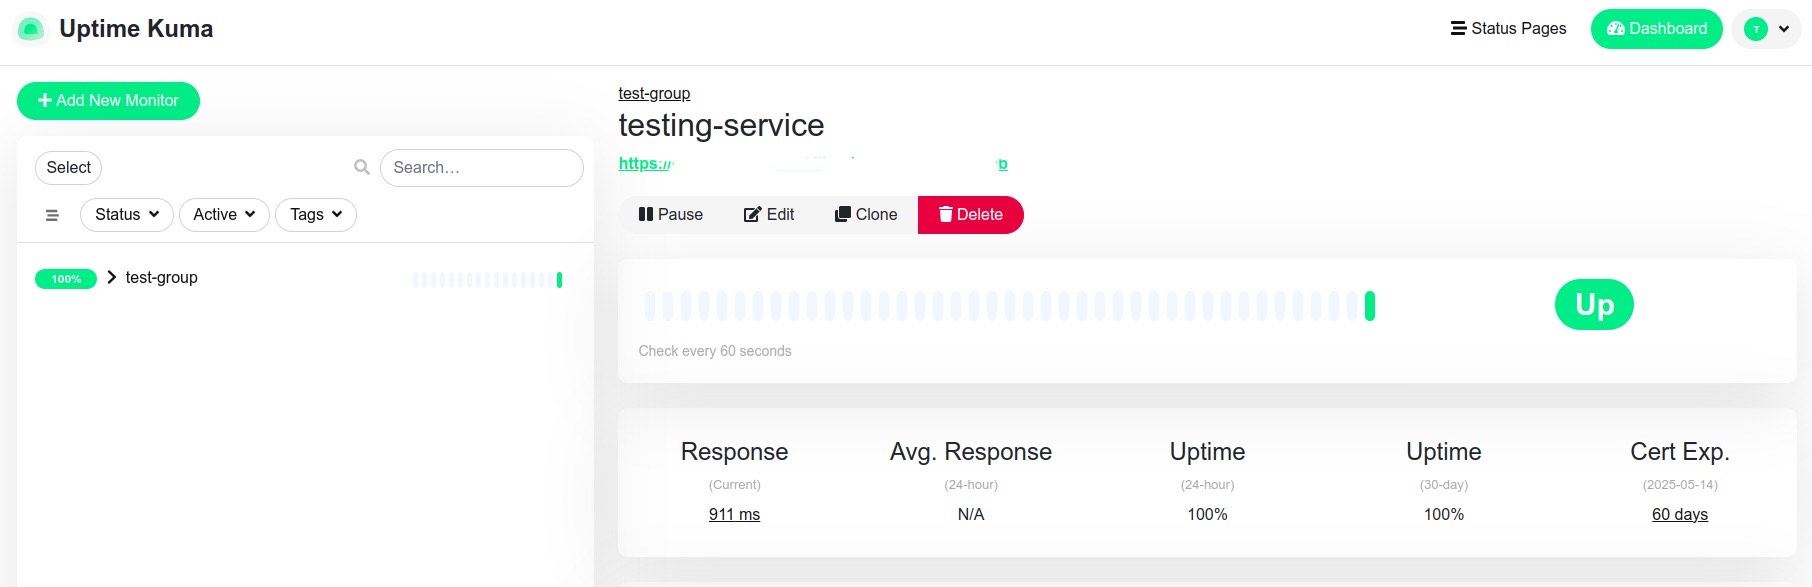
Click on the Add new monitor left side of the page
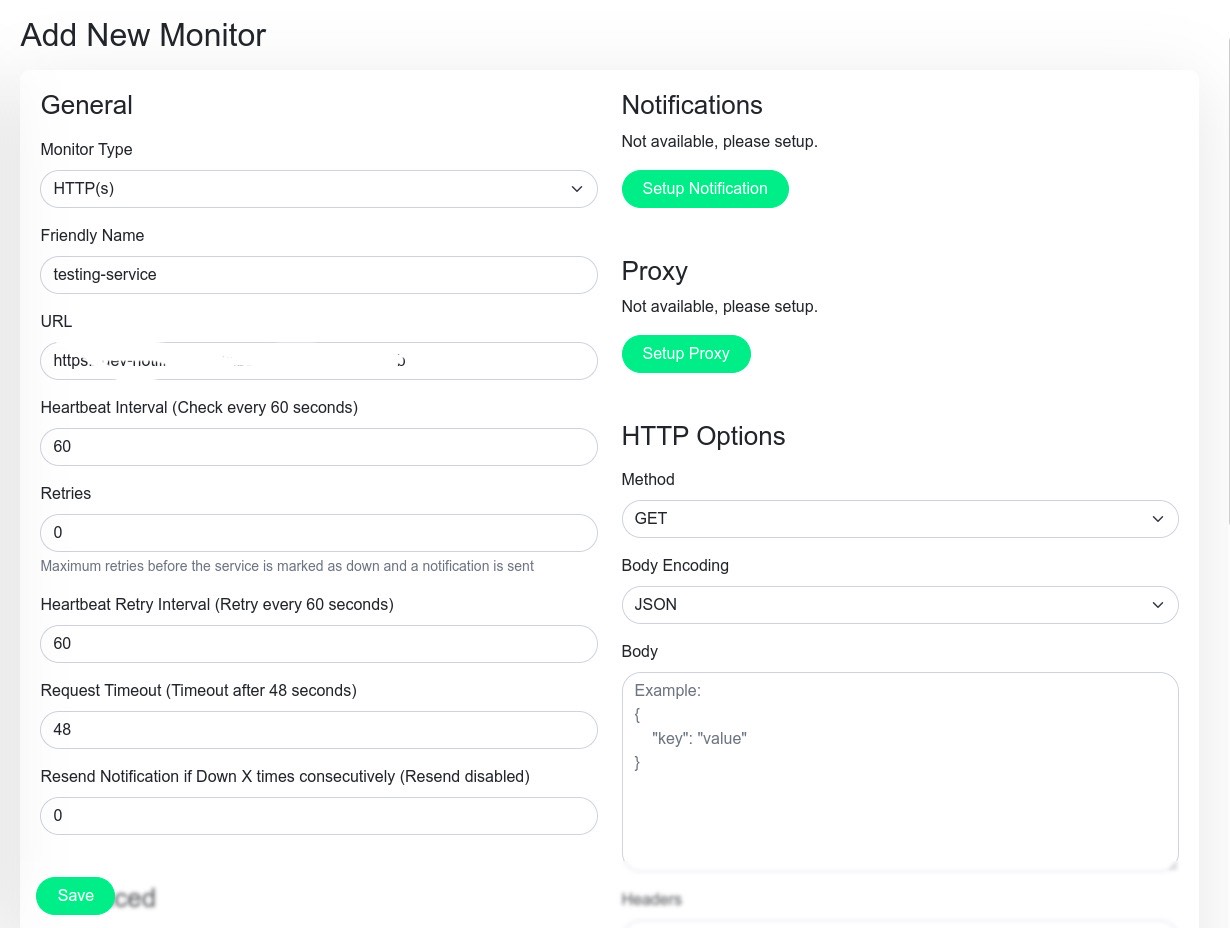
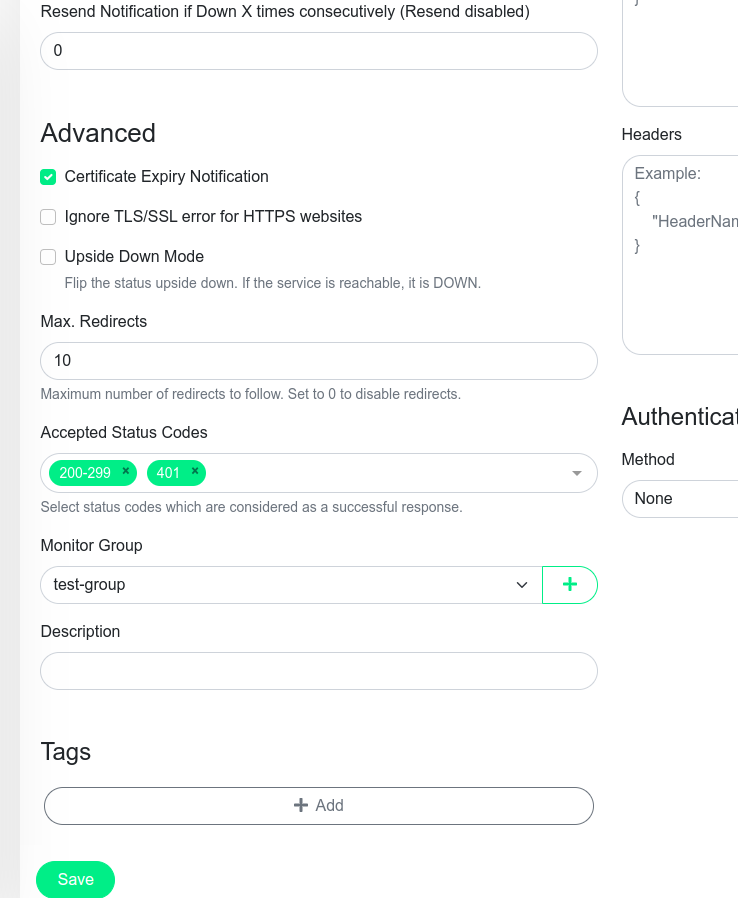
You can give any friendly name for your service and put the URL of that microservice which you want to monitor and enter the save
You can see your service is up and running
Notification Alert
Notification alerts in Uptime Kuma are crucial for keeping your systems running smoothly and minimizing downtime. When a service goes down, you get an instant alert — no need to manually check the dashboard. this doesn’t just notify you when a service goes down — it also lets you know when it comes back online.
Uptime Kuma supports a bunch of notification types, like Email, Telegram, Discord, Slack, Gotify, and more.
Here, We are going to setup slack notification alert
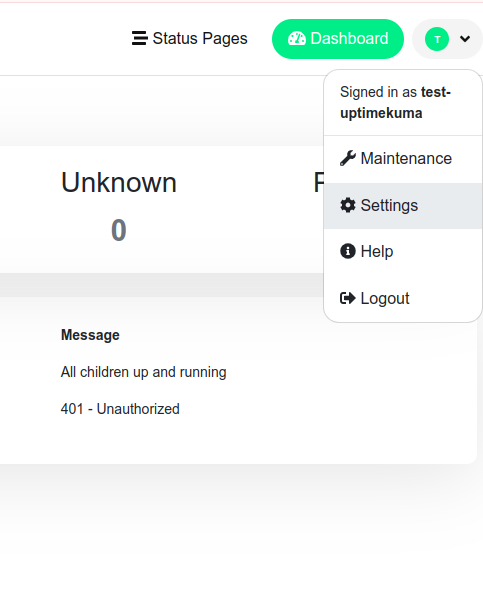
Navigate to the right corner of the page and you can see
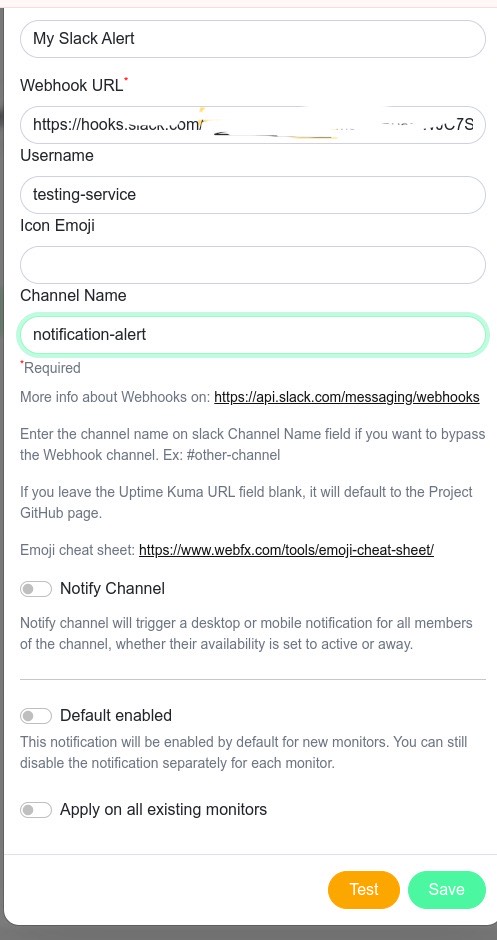
Go to your Uptime Kuma dashboard.
On the left sidebar, click "Settings" → "Notification".
Click "Add New Notification".
You have to create Webhook URL for setup slack notification so, follow the link as i have provide below
https://api.slack.com/messaging/webhooks
and you will be redirect to the below dashboard
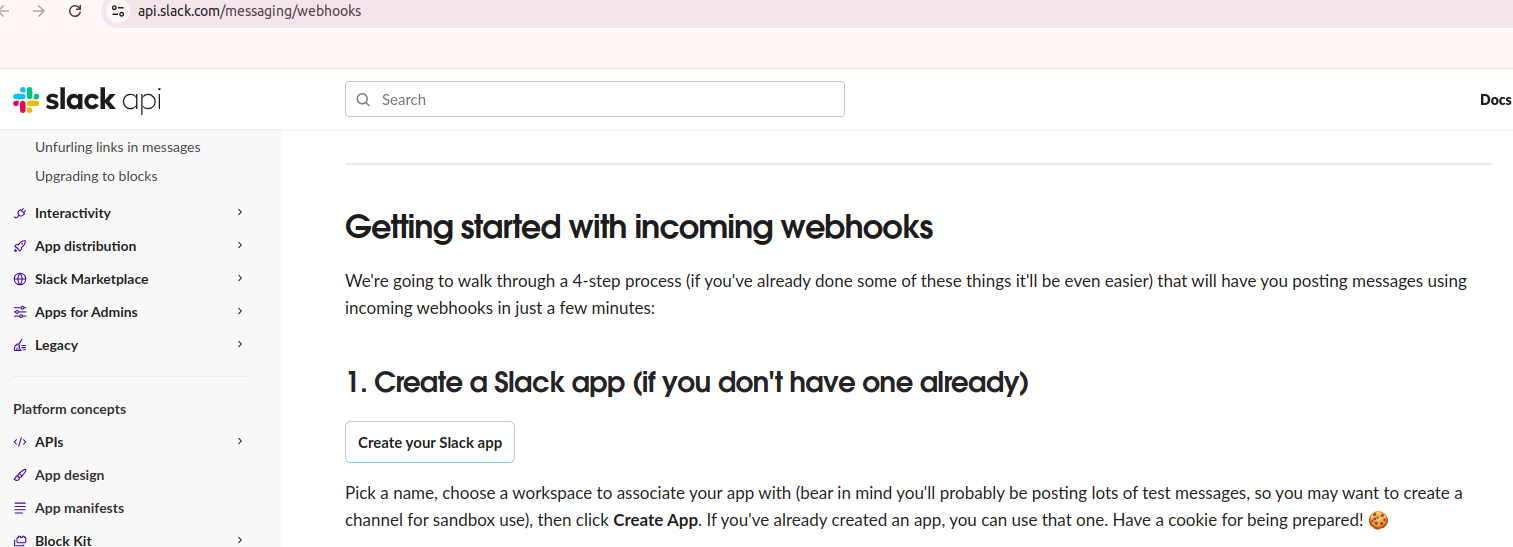
Click on the Create your Slack app
Choose From scratch
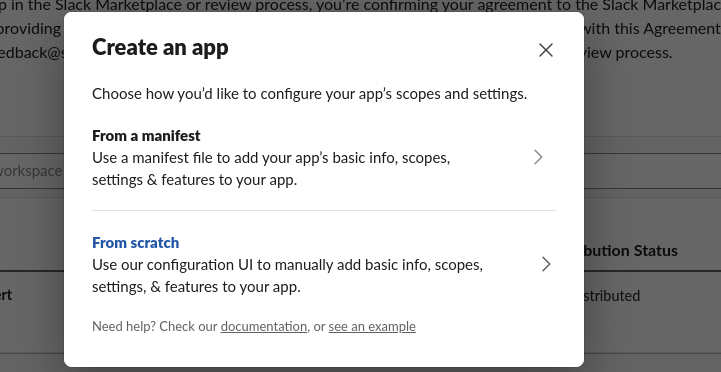
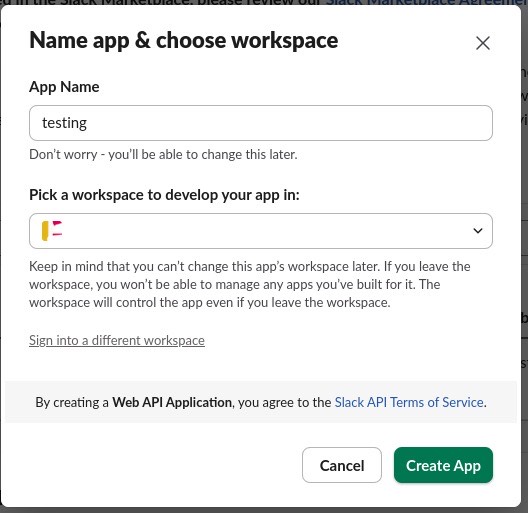
Create a new app:
Click "Create an App" → "From Scratch".

App Name: testing # you can give any name as you want
Workspace: Select your Slack workspace.
click on Create App
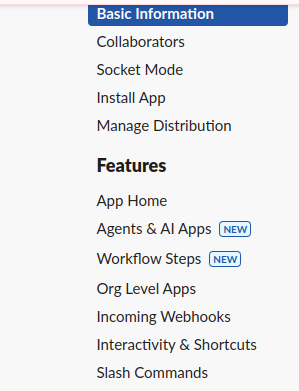
left corner you can see Incoming Webhooks and navigate their
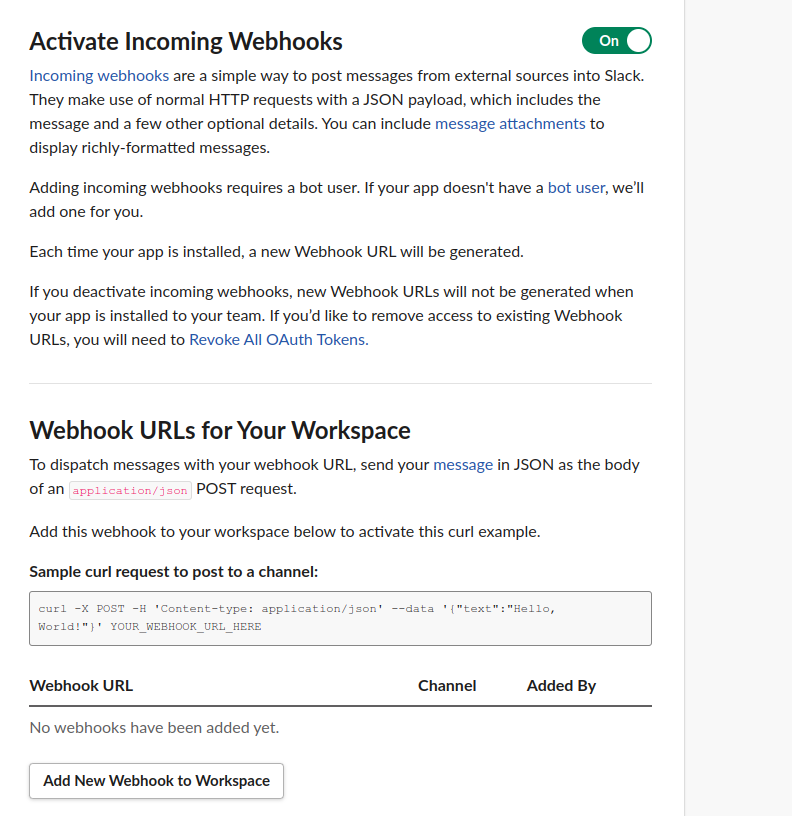
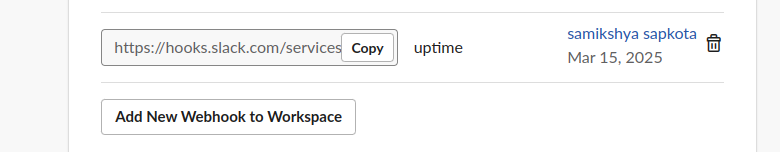
Click on the Add New Webhook to Workspace
Choose a slack group where you want to alert notification
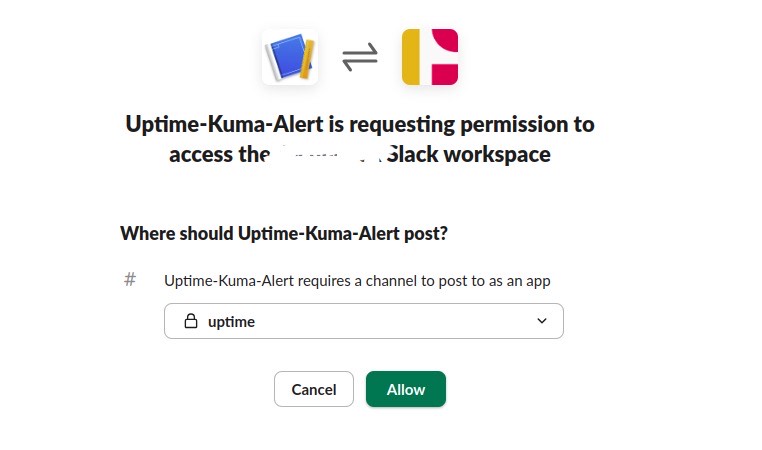
Now you get the Webhook URL, put this URL in the uptime-kuma notification
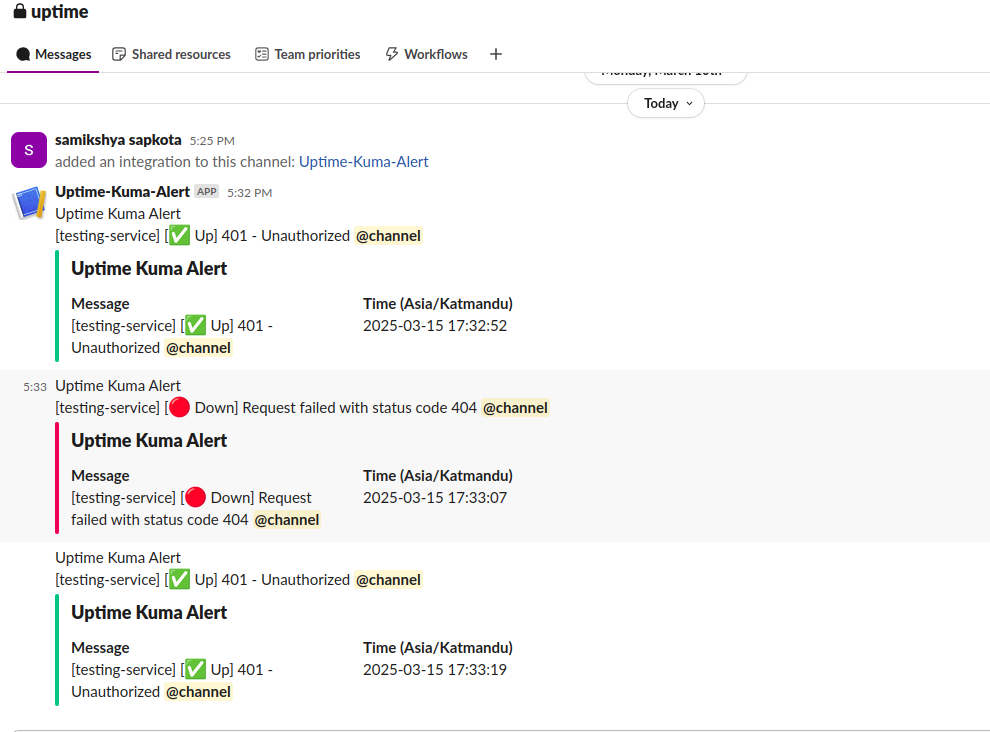
We have successfully, set up Slack notifications in Uptime Kuma, this means if any of our services goes DOWN or comes back UP, we’ll get an instant alert in Slack.
You’ve successfully set up a complete monitoring system using Uptime Kuma, Nginx, and Slack notifications. With Uptime Kuma running in Docker, you now have a flexible, lightweight service monitoring solution. Nginx acts as a reverse proxy, allowing external access to your monitoring dashboard via your localhost or public IP. Additionally, Slack notifications are configured, ensuring you’re promptly alerted whenever a service goes down or comes back online. This setup empowers you to stay on top of your services’ health in real time, minimizing downtime and keeping your systems reliable. For future improvements, you can enhance security with SSL and a custom domain, optimize performance checks, or expand notifications to other platforms.
Subscribe to my newsletter
Read articles from Samikshya Sapkota directly inside your inbox. Subscribe to the newsletter, and don't miss out.
Written by
Samikshya Sapkota
Samikshya Sapkota
Learner