Effective Log Monitoring: Using Grafana, Loki, and Promtail
 Navaneeth Krishna
Introduction
Monitoring logs efficiently is crucial for any modern application. Traditional log management in VPS can be complex. You have to SSH into instance and then look at the service logs but with Grafana, Loki, and Promtail, we can simplify the entire process. This article walks you through setting up an automated log monitoring system, leveraging Docker Compose to simplify the setup process and run the services as containers cause I love containers.
Prerequisites
Before we begin, ensure you have:
Docker & Docker Compose installed (Docs)
Basic knowledge of Grafana and Loki
Source Code from my Github Repository(repo)
Installation
Clone the git repo
 git clone https://github.com/navaneethkrishna30/monitoring.git
 cd monitoring
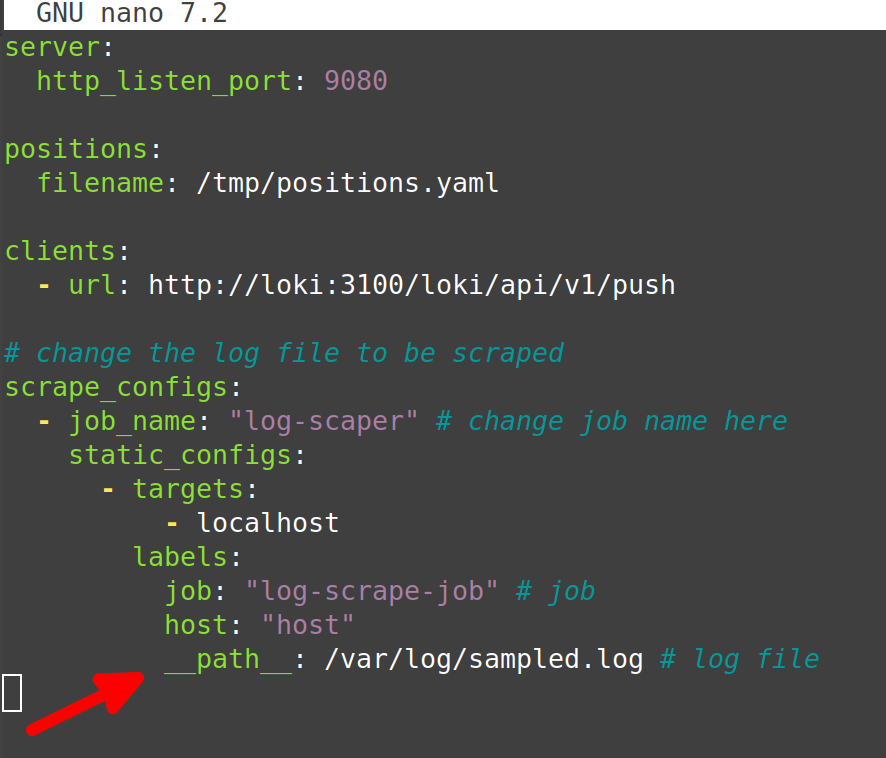
Change the service to be monitored in Promtail config
nano config/promtail-config.yml
Start the containers using Docker Compose
docker compose up -d
Deep Dive
The repository is structured to provide a fully automated log monitoring solution. The key components are:
Docker Compose File: Orchestrates all the services.
Loki Configuration: Sets up log aggregation.
Promtail Configuration: For log collection and forwarding.
Grafana Configuration and Provisioning: Automatically configures data sources.
Let's now understand what these files do:
docker-compose.yaml
When you run
docker-compose up -d, Docker Compose starts each service with the proper configurations and links them automatically. This means your log data flows seamlessly from Promtail to Loki and then to Grafana for visualization.config/loki-config.yml
Loki reads this file at startup to understand how to ingest, store, and serve log data, ensuring efficient querying and retention policies are enforced.
config/promtail-config.yml
Promtail continuously monitors specified directories for new logs. When new log entries are found, Promtail pushes them to Loki using the rules defined in this configuration file.
config/grafana-config.ini
When Grafana starts, it loads this file to apply your custom settings, ensuring that Grafana operates as desired from the moment it’s deployed.
grafana/provisioning/datasources/datasource.yaml
Grafana scans the mounted directory (
/etc/grafana/provisioning/datasources) on startup and loads any data source definitions it finds. This eliminates the need for manual configuration through the Grafana UI.
Results

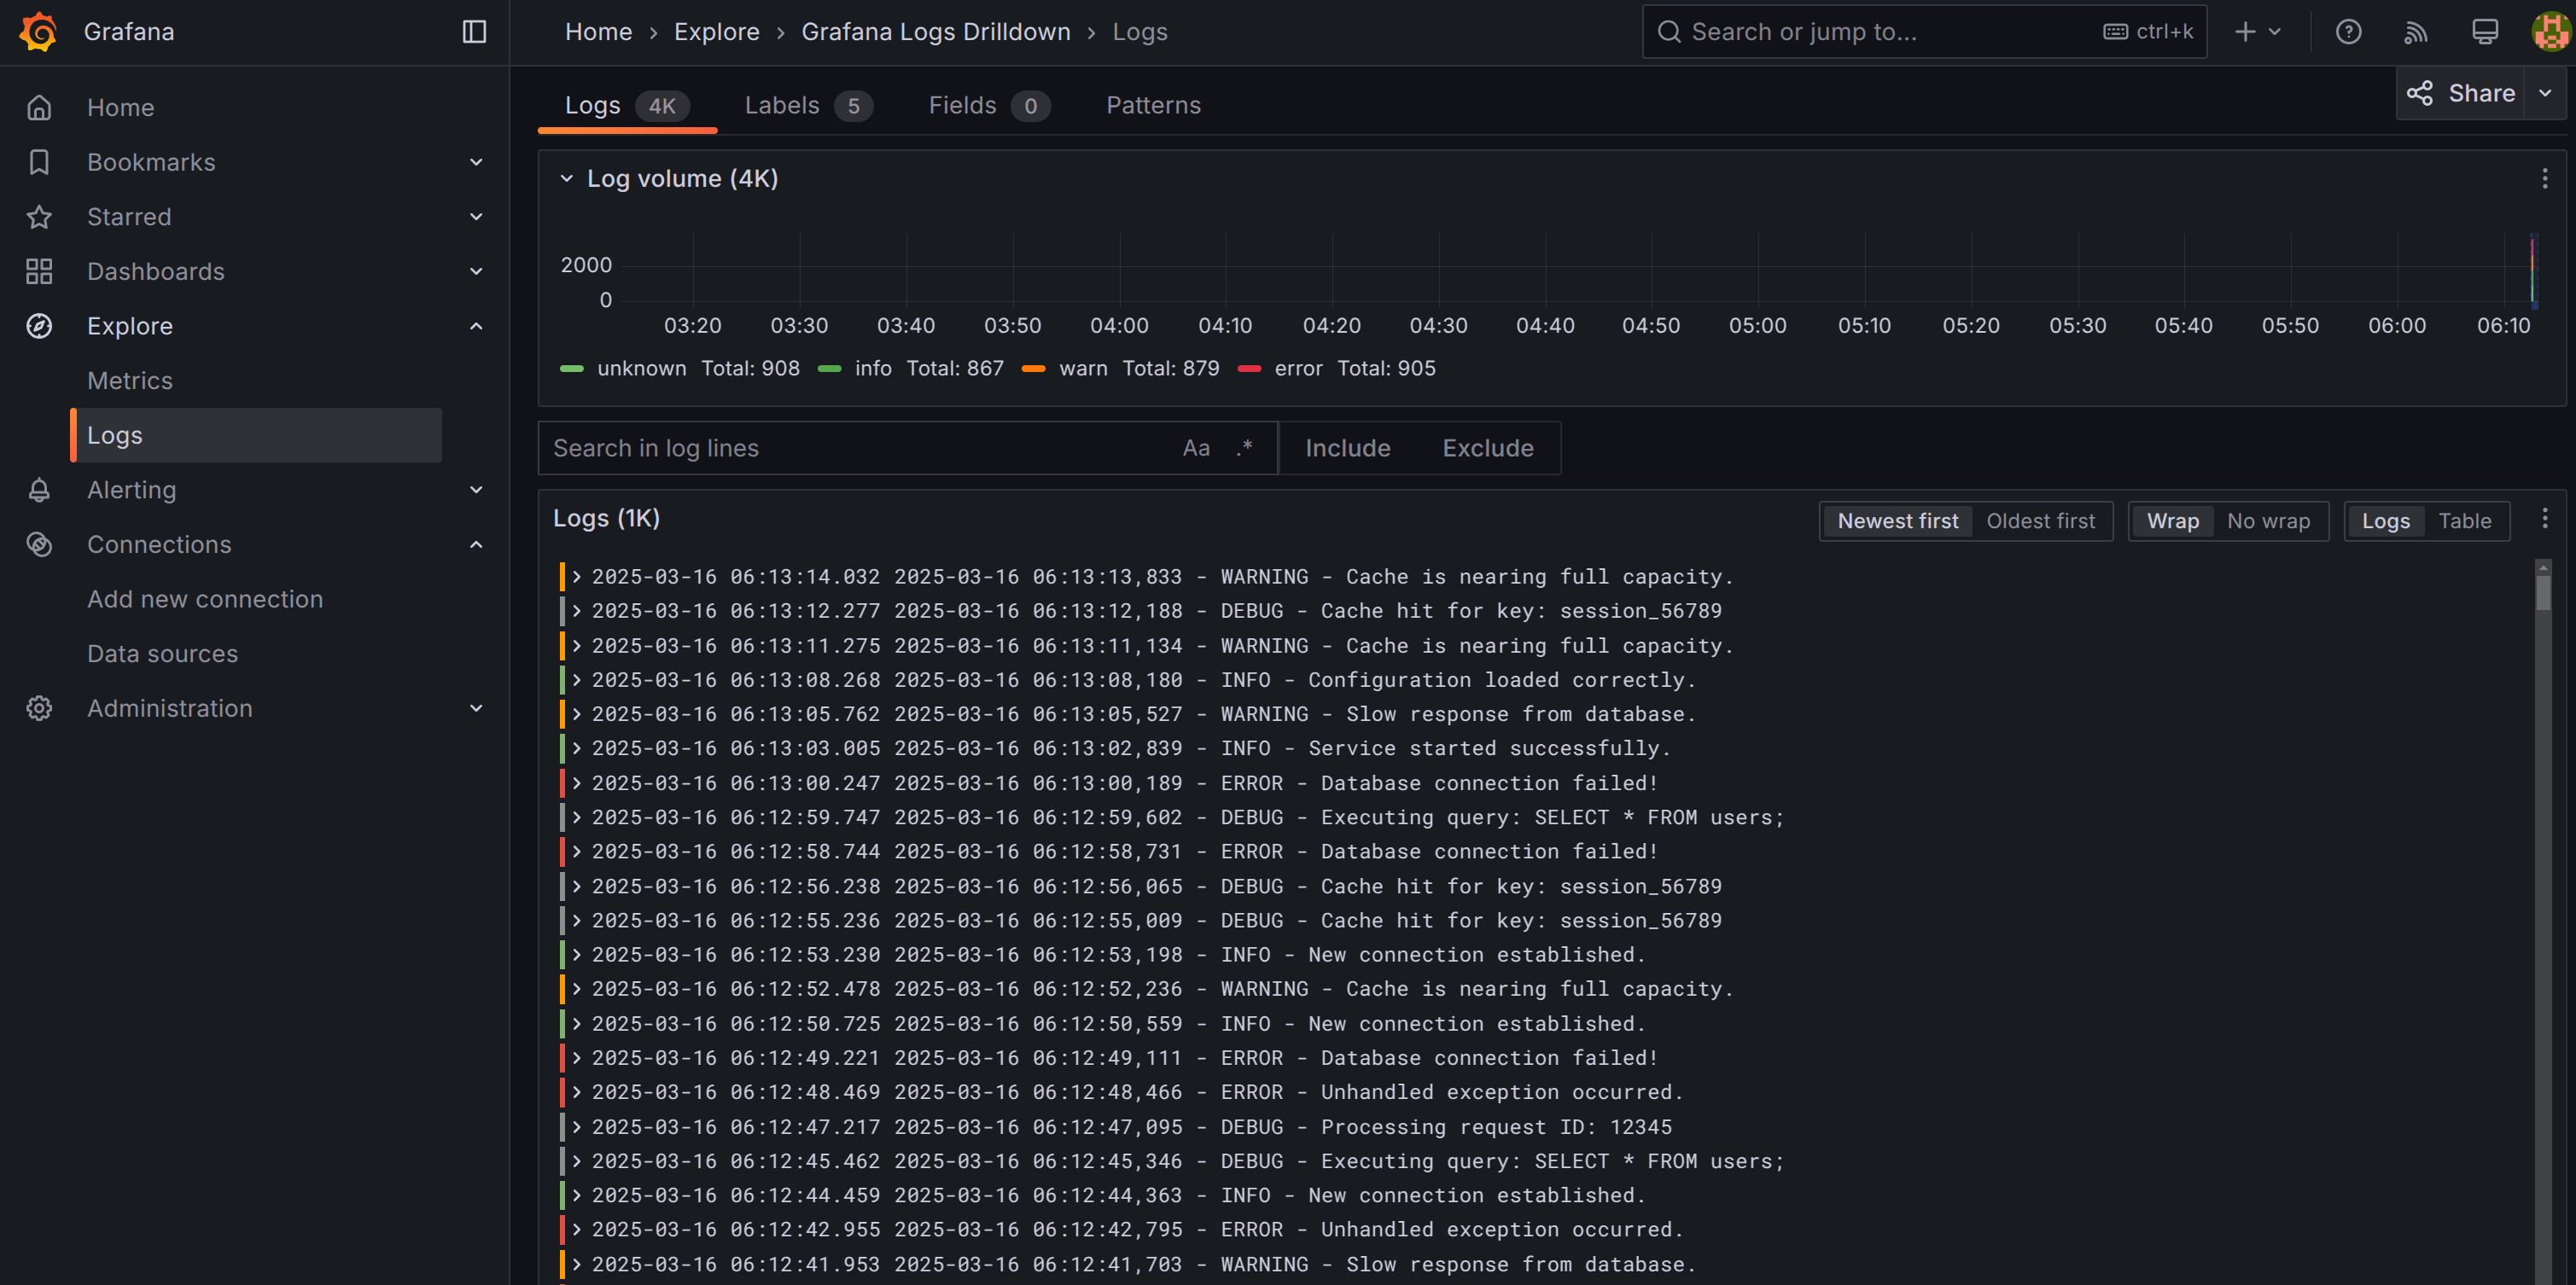
This is how your end setup should look like. Go to Explore > Logs. Then add the label to see the logs in detail service_name = log-scrape-job. Here you can see all the logs, filter them and do all good things that Grafana allows you.
Contributing
Thanks for reading the article. If you have any additions to the code base, you are more than welcome to contribute and raise a PR. Do follow me on my socials and hit me up for any project collabs.
Subscribe to my newsletter
Read articles from Navaneeth Krishna directly inside your inbox. Subscribe to the newsletter, and don't miss out.
Written by

Navaneeth Krishna
Navaneeth Krishna
yo yo yo