Boost Your Data Insights Using Grafana for Monitoring
 André Hoffmann
There are many tools available to monitor and analyze data. It is essential to watch over your system and all your environments for several reasons, primarily focusing on ensuring the health, security, and efficiency of your operations.
Grafana analyzes and displays metrics and logs from various data sources in real-time using an open-source visualization and monitoring platform. Monitoring infrastructure, applications, and systems with dashboards is a widely used method of illustrating system health.
You can choose from graphs, heat maps, tables, and other visualizations when creating custom or use predefined dashboards.
The integration can be done with different data sources, including Prometheus (a popular time-series monitoring system), Elasticsearch, InfluxDB, MySQL, PostgreSQL, and Cloud services.
Alerting is also a positive feature, which allows users to set alerts based on predefined metric thresholds. As metrics reach or fall below thresholds, Grafana can notify you through a variety of channels like email, Slack, or other messaging apps.
A key feature of Grafana is its ability to visualize real-time data, so it can easily be used to monitor the performance of systems, applications, and infrastructure in real time.
Common Use Cases:
Infrastructure Monitoring: Keep an eye on server performance like CPU, memory, and disk space, and use visuals for quick system health checks.
Application Performance Monitoring (APM): Monitor how well applications, services, and microservices are performing, often using tools like Prometheus or Jaeger for detailed tracking.
Log Analysis: Visualize and study logs from systems or apps, often using log tools like Elasticsearch.
Business Metrics: Track business data like website visits, sales numbers, or customer interactions.
I already worked with Grafana for different projects so I would like to deep dive into this great monitoring tool.
How to deploy Grafana in a fast and dirty way
First of all I quick set up a Kubernetes cluster where I could deploy Grafana. For this I used my old notebook. I installed Ubuntu 24.04.2 LTS as my operating system which you can find here https://ubuntu.com/download/server
Also I installed a SSH-client directly. For my Kubernetes cluster I used k3s as a single node cluster. That means Grafana and other tools will be deployed on my master node. For production environments it is useful to deploy Grafana on a worker node instead. Hence my system has no high availability right now but its fine for test purposes. K3s and a installing guide you can find here https://k3s.io/
While doing this, I had the following error:
WARN[0000] Unable to read /etc/rancher/k3s/k3s.yaml, please start server with --write-kubeconfig-mode or --write-kubeconfig-group to modify kube config permissions error: error loading config file "/etc/rancher/k3s/k3s.yaml": open /etc/rancher/k3s/k3s.yaml: permission denied
It can be solved by creating/configuring a kubeconfig file. For consistency put this into your .bashrc file.
export KUBECONFIG=~/.kube/config
mkdir ~/.kube 2> /dev/null
sudo k3s kubectl config view --raw > "$KUBECONFIG"
chmod 600 "$KUBECONFIG"
To fast deploy Grafana I used helm - https://helm.sh/. You can it fast install with the following command:
curl -fsSL -o get_helm.sh https://raw.githubusercontent.com/helm/helm/main/scripts/get-helm-3
chmod 700 get_helm.sh
./get_helm.sh

Ready to install Grafana
First of all I added Grafana to the helm repository. That’s very simple by just following the guidelines from artifact-hub - https://artifacthub.io/packages/helm/grafana/grafana
helm repo add grafana https://grafana.github.io/helm-charts
helm repo update
After adding Grafana to the repository and updating the chart, I installed it and displayed the admin password for the first login.
helm install grafana grafana/grafana
kubectl get secret --namespace default grafana -o jsonpath="{.data.admin-password}" | base64 --decode ; echo
Before we actually can login we need to port forward the Grafana instance so that we can reach the Kubernetes cluster. Since I use the same network as the Kubernetes cluster, I will make it easier and constant to reach the Grafana by changing the k8s-service from ClusterIP to Nodeport. Now the Grafana instance is reachable from the port of the node. You can do this as well just by editing the Grafana service (kubectl edit svc grafana) and change ClusterIP to NodePort
spec:
  ipFamilies:
  - IPv4
  ports:
  - name: service
    nodePort: 32613
    port: 80
    protocol: TCP
    targetPort: 3000
  selector:
    app.kubernetes.io/instance: grafana
    app.kubernetes.io/name: grafana
  sessionAffinity: None
  type: NodePort
status:
  loadBalancer: {}

Right after the change of the service I can reach Grafana on the internal-ip of the node on the defined node port. In my case 192.168.2.133:32613

Feed Grafana while integrate datasources
After I have deployed Grafana and made it reachable on node level I need to feed Grafana with data to create dashboards.
This depends on what you want to achieve! Maybe you want to trace an application you may install Grafana tempo, or get information about some logging data via Grafana Loki. I want to have a dashboard which shows me all information about my Kubernetes cluster. To achieve this I need information out of my cluster, so I will install Prometheus.
Here we can do the same steps that we have done for Grafana. We follow the guidelines of artifact-hub by adding the helm chart to our repository - https://artifacthub.io/packages/helm/prometheus-community/prometheus
After that we can simply deploy Prometheus in our k3s cluster
helm repo add prometheus-community https://prometheus-community.github.io/helm-charts
helm repo update
helm install prometheus prometheus-community/prometheus
The Prometheus server can be accessed via port 80 on the following DNS name from within your cluster: prometheus-server.default.svc.cluster.local
Prometheus can be added as a data source into Grafana by navigating to Connections → data source

TI added a new data source while I chose Prometheus from time series databases. You can name it whatever you want. Under connection you need to add the Prometheus server URL. Because the service is only available on port 80 its not possible to use HTTPS. For providing more security in production usages I recommend to change the configuration in Prometheus and enable port 443 for TLS.

After the data source is added it’s now possible to create a first dashboard.
Visible K3s in Grafana via customzied dashboard
Now its possible to create customized dashboards or even to import dashboards by copying the json configuration to dashboards. I wanted to use the K8S Dashboard EN 20250125 for Kubernetes/Prometheus. So I downloaded the json file from the Grafana website and imported the dashboard - https://grafana.com/grafana/dashboards/15661-k8s-dashboard-en-20250125/
After importing the dashboard it is immediately available and usable.

Customize dashboards via queries
To create a custom dashboard, simply click on 'Add visualization' in the dashboard menu.

Dashboards can be organized into individual panels that show data visually. Each panel requires at least one query to display a visualization.
Before we can start create single panels we have to choose a data source. Again I added Prometheus as my data source and started too create the first panel.

You can customize your panel as you like. It will get the data from the Prometheus data source. You can choose in the Metric explorer what data you exactly need. Also you can filter these data by labels.
For a first use case I want to create a panel which is showing me the exact number of pods running on my node. Hence I created a first query.

I begun by looking for fitting metrics of the Prometheus data source by searching in the metrics explorer. The metric explorer responses 84 results for pod. I found the metric kubelet_running_pods which hand out the exact number of running pods. I selected this metric which feed my panel with data.

Additional I used a label filter which shall only select my master node. In my case, it's irrelevant whether I use this filter because I only have one node. However, if I add a second node, the use case is no longer met and the data is corrupted because it only concerns the first node. Hence the complete query will be kubelet_running_pods{node_role_kubernetes_io_master="true"}
By clicking run queries the query will visualized in the panel. The default visualization ‘Time series‘ is now active.

You can always change between the visualization and the exact data which Prometheus is providing by click on ‘table view’

Grafana provides lot of other types of visualization and make own suggestions based on current data.

The last configurations which have to be done are the panel options where description of panel is defined. It includes title, legend and some changes to the appearance to the visualization itself.
After all configurations on the panel I got asked to create a dashboard which I named André’s dashboard The panel was automatically added to my new dashboard. Now its possible to see the running panel which is showing the exact amount of running pods on my master node in real-time. To test it I created a test-deployment with 2 replicas.
kubectl create deploy test-deployment --image=nginx --replicas=2
The deployment created two pods and the dashboard showed that there is a change of amount of running pods from 23 to 25.

I recommend to write down use cases before you start what you want to visualize. It makes much easier the searching for metrics in metric explorer.
Urgent: Grafana Alerting Issue Detected
Let everyone know that something is wrong with Grafafana Alerting. Grafana additionally provides an alerting system to watch specific events or circumstances. With that you do not have to keeep an eye on your dashboards all the time. You can also monitor system performance, applications, and infrastructure by triggering notifications when certain thresholds or conditions are met. These alerts can be configured for various data sources like Prometheus, Graphite, and others. Grafana supports multiple notification channels, including email, Slack, PagerDuty, and webhooks, enabling teams to quickly respond to critical issues.
The function of Grafanas alterting system is very simplistically explained with this picture. You can create a ‘Alert rule’ which produces ‘alert instances’ (alters). If an alert rule applies to the respective alert instance, the ‘notification policy’ is triggered and the ‘contact point’ is notified.

We should start creating a contact point which we would like to inform when something is wrong. For this we can go to Contact Points in the Alert menu. I would like to send a message in a Discord text channel when the alert rule will be fired. So I created a contact point naming ‘Discord - Captain Hook’ with integration type Discord.

Additional I created a Discord text channel named ‘alert’. Under the text-channel configuration I created a webhook-URL naming Captain Hook.

The Webhook URL of Captain Hook I entered the contact information to the contact points.
Now lets create an own alert by clicking on the alert-rules button in the menu:

Here you can find all alert rule you already created. It is possible to filter by the data-source, dashboard, states of the alerts and/or even by the contact point.

On the top right you can find the button to create a new alert.
Now we can actually create a rule. I would like to get informed when I have more then 24 pods running. Again I used the same metric (kubelet_running_pods) from Prometheus as I used for the dashboard.

Out of this information I configured the rules that determines whether an alert will fire. I added a threshold greater than 24. So the information the alert gets from the Prometheus will compared to the threshold. This fire the alert when more the 24 pods running on the master node.

I want that this rule to be checked every minute so I configured a pending period and saved the rule into a running pods folder. If there is an error like Prometheus doesn’t provide data the Alerting system will give me an error alert as well.

Last but not least I configured the notification message and saved it.

In the alert rules menu it is now possible to see the alert rule which will be firing a notification when the master node has more than 24 running pods.

I created some pods again to test the alert function.
kubectl create deploy test-deployment --image=nginx --replicas=5
The created Dashboard has now 28 running pods which will create an alert. I reduced it to 25 again so my channel will not be notified every minute.

When I have more than 24 running pods on master node Captain Hook notifies me on discord with this wonderful message:

Hint: Grafana Alerting uses the Prometheus alerting system architecture. It sends alerts to an Alert-manager, which manages notifications. This setup separates alert rule evaluation from notification handling, enhancing scalability.
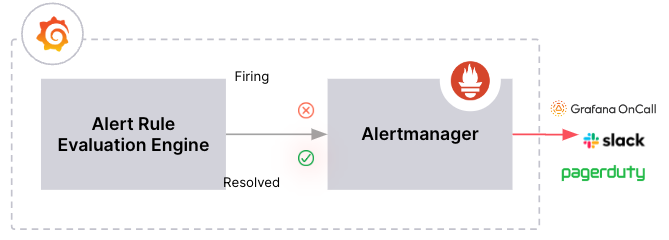
Grafana can be set up to let one or more Alertmanagers receive alerts managed by Grafana for handling notifications.
Secure your Grafana dashboards with RBAC
Grafana provides its own role-based access control (RBAC), a standardized method for granting, changing, and revoking access to Grafana resources such as dashboards and administrative settings. By using RBAC, you can assign users permissions that go beyond those available with basic roles. Grafana offers basic roles, fixed roles, and custom roles. Basic roles are standard in Grafana OSS and include Grafana administrator, organization administrator, editor, viewer, and none. If you have a Grafana Enterprise license, you can still use these basic roles. The enterprise edition allows for assigning fixed roles to users, teams, and service accounts, which offer more granular permissions than basic roles. As a Additional you can also create custom roles to manage user permissions according to your security needs.
I recommend to use least privilege in productive systems to enhances security by ensuring that access rights are restricted to the minimum necessary. It reduces the risk of cyberattacks, minimizes insider threats, simplifies compliance, improves security management, and helps contain potential breaches. By following this principle, organizations can create a more secure and efficient environment.
Conclusion
Grafana is a powerful tool for monitoring and visualizing data from various sources, offering real-time insights into system performance, application health, and infrastructure status. By deploying Grafana on a Kubernetes cluster, you can efficiently track metrics and logs, customize dashboards, and set up alerts to stay informed about critical events. The integration with data sources like Prometheus enhances its capabilities, allowing for detailed analysis and visualization. Additionally, Grafana's alerting system and role-based access control (RBAC) provide robust features for managing notifications and securing access. Whether for infrastructure monitoring, application performance tracking, or business metrics analysis, Grafana proves to be an invaluable asset in optimizing operations and ensuring system reliability.
Subscribe to my newsletter
Read articles from André Hoffmann directly inside your inbox. Subscribe to the newsletter, and don't miss out.
Written by
André Hoffmann
André Hoffmann
I am a Solution Architect with focus on IT-infrastructure. I like to work in the cloud but also on-prem. With Azure Cloud I build solutions for different customers. I am always interested in new Technology :) Certified Kubernetes Administrator Certified Azure Administrator Associate