Understanding Key Statistical Concepts in Simple Terms 📊
 Manav Rastogi
What is a Random Variable? 🤔
A random variable is a way to assign numbers to different outcomes of an experiment.
💡 Example: Tossing a coin 🎲
Heads → 1
Tails → 0
Types of Probability Distributions 🎯
Probability distributions tell us how likely different outcomes are. They can be:
1️⃣ Probability Density Function (PDF) – Continuous Data 📈
Used for variables that can take any value in a range.
Normal Distribution (Bell Curve) 🔔
Standard Normal Distribution
Log-Normal Distribution
Chi-Square & F-Distribution
2️⃣ Probability Mass Function (PMF) – Discrete Data 🎲
Used for variables that take specific values.
Bernoulli Distribution ✅❌ (Yes/No)
Binomial Distribution 🔢 (Multiple Yes/No)
Poisson Distribution 📞 (Rare events happening over time)
3️⃣ Uniform Distribution (Equal Chance for All) 🔄
Discrete Uniform Distribution (Rolling a fair die 🎲)
Continuous Uniform Distribution (Random number generator 🔢)
PMF vs. PDF vs. CDF 🤷♂️
| Concept | Type | Use Case | Example |
| PMF | Discrete | Probability of exact values | Rolling a die 🎲 |
| Continuous | Probability over a range | Heights of people 📏 | |
| CDF | Both | Probability of values ≤ x | Cumulative score distribution 🎯 |
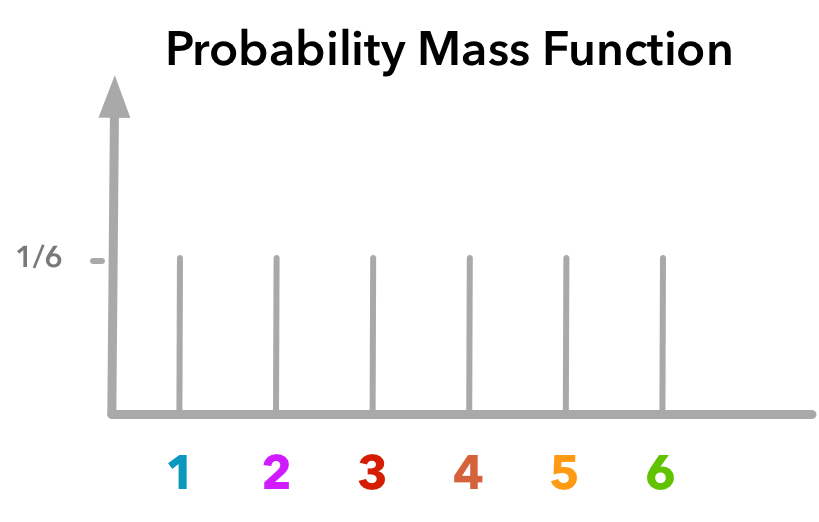
1️⃣ PMF (Probability Mass Function) 🎲
Used for discrete random variables (like rolling a die)
Example: Each face of a fair die has a probability of 1/6.
Graph:

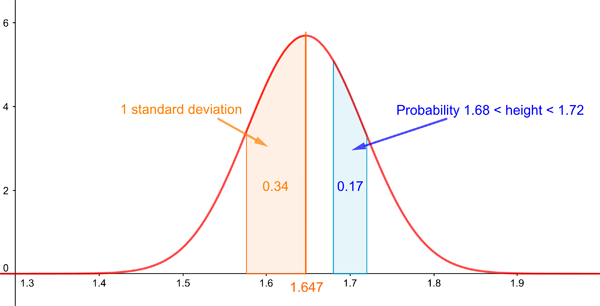
2️⃣ PDF (Probability Density Function) 📈
Used for continuous variables.
Example: Height of people → Bell Curve (Normal Distribution)
Graph:

3️⃣ CDF (Cumulative Distribution Function) 📊
Tells the probability that a value is less than or equal to x.
Example: The probability of rolling ≤ 3 on a die.
Understanding Different Distributions 📚
🎲 Uniform Distribution
Discrete Example: Rolling a fair die → Each number is equally likely.
Continuous Example: A random number generator selecting values between 0 and 1.
Question: If a shop sells between 20-50 items daily, what is the probability of selling between 25 and 40?
✅ Bernoulli Distribution
Definition: Used when there are only two possible outcomes.
Example: Flipping a coin (Heads/Tails).
Mean = p, Variance = p(1-p)
📞 Poisson Distribution
Definition: Used when counting rare events over a fixed time.
Example: Number of calls received per hour in a call center.
Why It Matters: Poisson is useful when counting rare events that happen at a constant rate over time, like the number of customer complaints received daily in a store.
Normal Distribution (Bell Curve) 🔔
Characteristics:
1️⃣ Symmetric around the mean.
2️⃣ Mean = Median = Mode.
3️⃣ No skewness.
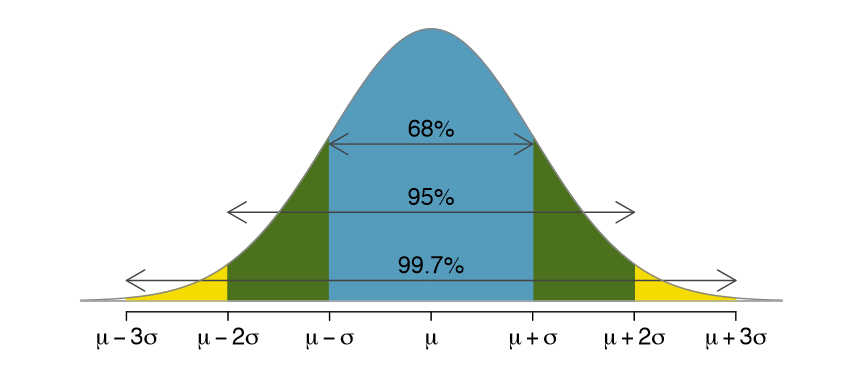
Empirical Rule (68-95-99.7 Rule) 📊
68% of values fall within 1 standard deviation.
95% within 2 standard deviations.
99.7% within 3 standard deviations.

Standard Normal Distribution (SND) ❓
Why use SND when we have Normal Distribution?
SND is a special case of Normal Distribution where mean = 0 and standard deviation = 1.
Use Case: Helps standardize data for comparisons and is essential for ML models like Linear & Logistic Regression.
Central Limit Theorem (CLT) 🧠
What is CLT?
If we take many samples from a population, the average of those samples will form a normal distribution.
Why important? Helps in making predictions & confidence intervals.
Graphical Representation:
🔹 Conditions for CLT:
1️⃣ The sample size should be large.
2️⃣ Sample size ≥ 30.
Real-World Application:
- CLT is widely used in A/B testing, where companies test different versions of a website and analyze user engagement. Since individual user behaviors can vary, taking many samples ensures a normal distribution of results.
Understanding Standard Error 🤓
What is it? It tells us how much the sample mean differs from the population mean.
Why important? Used in confidence intervals & hypothesis testing.
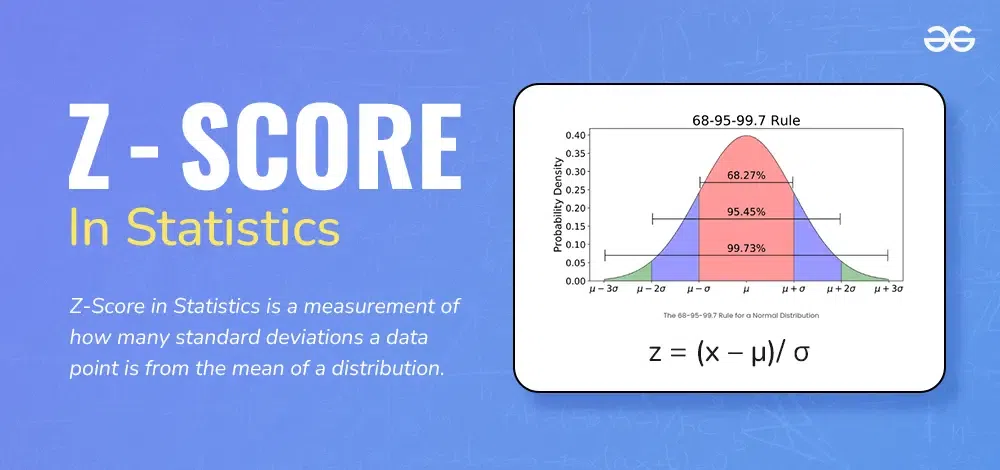
Z-Score Applications 📏
What is a Z-score? It measures how far a value is from the mean.
Example Question: Given marks X = {1,2,3,4,5,6}, mean = 4, SD = 1, find probability that score > 4.5.

Real-World Application:
Credit Scoring: Banks use Z-scores to determine how risky a loan applicant is. If an applicant's credit score is far below the mean, they may be considered high-risk.
Medical Diagnosis: Z-scores are used in bone density tests to identify osteoporosis. A low Z-score indicates weaker bones compared to the average population.
Point Estimate vs. Interval Estimate 🎯
Point Estimate
- Example: Finding the average salary of IT employees.
Interval Estimate
Gives a range instead of a single number.
Example: Predicting an IT employee’s salary will be between $50K and $70K.
🔹 When to use what?
Use Point Estimate when a single number is needed.
Use Interval Estimate when uncertainty is involved.
Final Thoughts 🚀
These statistical concepts are the foundation of data analysis and machine learning. Understanding them will help in making data-driven decisions! 🎯
Subscribe to my newsletter
Read articles from Manav Rastogi directly inside your inbox. Subscribe to the newsletter, and don't miss out.
Written by

Manav Rastogi
Manav Rastogi
"Aspiring Data Scientist and AI enthusiast with a strong foundation in full-stack web development. Passionate about leveraging data-driven solutions to solve real-world problems. Skilled in Python, databases, statistics, and exploratory data analysis, with hands-on experience in the MERN stack. Open to opportunities in Data Science, Generative AI, and full-stack development."