Coding Your Own Real-Time Poll Creator: Visualize Results Instantly with Chart.js 📊
 Learn Computer Academy
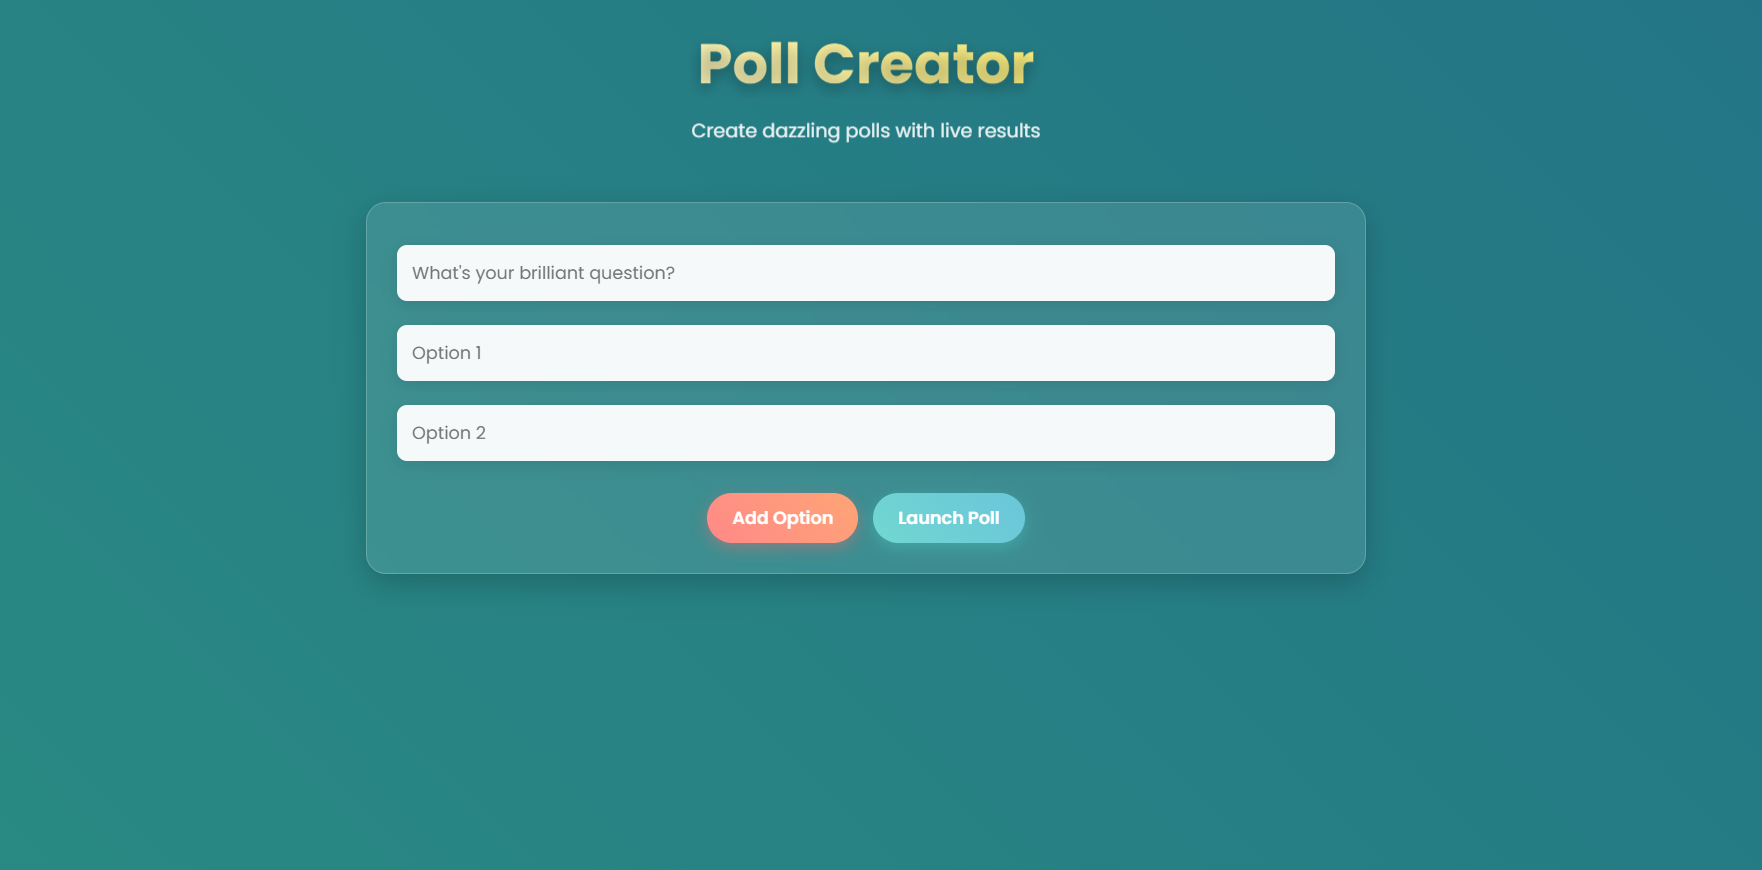
Have you ever wanted to create polls that update in real-time, showing results as votes come in? Today, we're going to build exactly that - a sleek, interactive poll creator with beautiful visualizations that update instantly. By the end of this tutorial, you'll have a fully functional poll application that allows users to create customized polls, share them via unique links, and see results update dynamically with attractive charts.
What We're Building 🛠️
Our poll creator application will have these key features:
Create custom polls with multiple options
Visualize results in real-time using Chart.js
Generate shareable links for your polls
Display vote percentages as users interact
Animate transitions for a polished user experience
The final product will look something like this: https://playground.learncomputer.in/poll-creator/

Prerequisites 📝
Before we start coding, make sure you have:
Basic understanding of HTML, CSS, and JavaScript
A code editor (like VS Code, Sublime Text, etc.)
A modern web browser
Project Structure 📁
We'll need three files:
index.html: The structure of our applicationstyles.css: For styling our poll creatorscript.js: To handle the application logic
Let's start by setting up our HTML structure.
The HTML Structure 🏗️
Our HTML will define the basic structure of our poll creator, including the form for creating polls and the section for displaying results.
<!DOCTYPE html>
<html lang="en">
<head>
    <meta charset="UTF-8">
    <meta name="viewport" content="width=device-width, initial-scale=1.0">
    <title>Poll Creator - Real Time Results</title>
    <link rel="stylesheet" href="styles.css">
    <script src="https://cdn.jsdelivr.net/npm/chart.js"></script>
</head>
<body>
    <div class="container">
        <header class="fancy-header">
            <h1>Poll Creator</h1>
            <p>Create dazzling polls with live results</p>
        </header>

        <div class="poll-creator">
            <div class="create-section glass-card">
                <input type="text" id="pollQuestion" class="fancy-input" placeholder="What's your brilliant question?">
                <div class="options-container" id="optionsContainer">
                    <input type="text" class="option-input fancy-input" placeholder="Option 1">
                    <input type="text" class="option-input fancy-input" placeholder="Option 2">
                </div>
                <div class="button-group">
                    <button id="addOption" class="fancy-btn">Add Option</button>
                    <button id="createPoll" class="fancy-btn primary">Launch Poll</button>
                </div>
            </div>

            <div class="results-section glass-card" id="resultsSection">
                <h2 id="activeQuestion" class="question-title"></h2>
                <div class="vote-buttons" id="voteButtons"></div>
                <div class="total-votes">Total Votes: <span id="totalVotes">0</span></div>
                <canvas id="resultsChart" class="chart-canvas"></canvas>
                <div class="share-link">
                    <input type="text" id="shareLink" class="fancy-input" readonly>
                    <button id="copyLink" class="fancy-btn">Copy Link</button>
                </div>
            </div>
        </div>
    </div>
    <script src="script.js"></script>
</body>
</html>
Let's break down what's happening in our HTML:
We include Chart.js from a CDN to create our visualization
The page is divided into two main sections:
A poll creation section where users input their question and options
A results section that displays the active poll, voting buttons, and a chart
Styling Our Poll Creator 🎨
Next, let's add some style to our application. We'll create a modern, glass-morphism design with smooth animations and gradients.
* {
    margin: 0;
    padding: 0;
    box-sizing: border-box;
    font-family: 'Poppins', sans-serif;
}

body {
    background: linear-gradient(45deg, #d64161, #2a8d82, #1e6388); /* Darker gradient */
    background-size: 400% 400%;
    animation: gradientBG 15s ease infinite;
    min-height: 100vh;
    padding: 30px;
}

@keyframes gradientBG {
    0% { background-position: 0% 50%; }
    50% { background-position: 100% 50%; }
    100% { background-position: 0% 50%; }
}

.container {
    max-width: 1000px;
    margin: 0 auto;
}

.fancy-header {
    text-align: center;
    margin-bottom: 50px;
    animation: float 3s ease-in-out infinite;
}

h1 {
    font-size: 3.5em;
    color: #fff;
    text-shadow: 0 5px 15px rgba(0, 0, 0, 0.3);
    background: linear-gradient(45deg, #fff, #ffeb3b);
    -webkit-background-clip: text;
    -webkit-text-fill-color: transparent;
}

.fancy-header p {
    color: rgba(255, 255, 255, 0.9);
    font-size: 1.2em;
    margin-top: 10px;
}

.glass-card {
    background: rgba(255, 255, 255, 0.1);
    border-radius: 20px;
    padding: 30px;
    backdrop-filter: blur(15px);
    border: 1px solid rgba(255, 255, 255, 0.2);
    box-shadow: 0 10px 30px rgba(0, 0, 0, 0.2);
    transition: transform 0.3s ease;
}

.glass-card:hover {
    transform: translateY(-5px);
}

.fancy-input {
    width: 100%;
    padding: 15px;
    margin: 12px 0;
    border: none;
    border-radius: 10px;
    background: rgba(255, 255, 255, 0.95);
    font-size: 1.1em;
    transition: all 0.3s ease;
    box-shadow: 0 4px 15px rgba(0, 0, 0, 0.1);
}

.fancy-input:focus {
    outline: none;
    box-shadow: 0 0 0 4px rgba(255, 107, 107, 0.4);
    transform: scale(1.02);
}

.button-group {
    display: flex;
    gap: 15px;
    margin-top: 20px;
    justify-content: center;
}

.fancy-btn {
    padding: 12px 25px;
    border: none;
    border-radius: 25px;
    background: linear-gradient(45deg, #ff6b6b, #ff8e53);
    color: white;
    cursor: pointer;
    font-weight: 600;
    font-size: 1.1em;
    transition: all 0.3s ease;
    box-shadow: 0 5px 15px rgba(255, 107, 107, 0.4);
    position: relative;
    overflow: hidden;
}

.fancy-btn.primary {
    background: linear-gradient(45deg, #4ecdc4, #45b7d1);
    box-shadow: 0 5px 15px rgba(78, 205, 196, 0.4);
}

.fancy-btn:hover {
    transform: translateY(-3px);
    box-shadow: 0 8px 25px rgba(255, 107, 107, 0.6);
}

.fancy-btn.primary:hover {
    box-shadow: 0 8px 25px rgba(78, 205, 196, 0.6);
}

.fancy-btn::after {
    content: '';
    position: absolute;
    top: -50%;
    left: -50%;
    width: 200%;
    height: 200%;
    background: rgba(255, 255, 255, 0.2);
    transform: rotate(30deg);
    transition: all 0.5s ease;
}

.fancy-btn:hover::after {
    top: 100%;
    left: 100%;
}

.results-section {
    display: none;
}

.question-title {
    color: #fff;
    font-size: 2em;
    margin-bottom: 20px;
    text-align: center;
    background: linear-gradient(45deg, #fff, #ffeb3b);
    -webkit-background-clip: text;
    -webkit-text-fill-color: transparent;
}

.vote-buttons {
    display: flex;
    flex-wrap: wrap;
    gap: 15px;
    margin: 25px 0;
    justify-content: center;
}

.vote-buttons button {
    flex: 1;
    min-width: 150px;
    padding: 15px;
    position: relative;
}

.vote-buttons button::before {
    content: attr(data-percentage);
    position: absolute;
    top: -20px;
    right: 10px;
    font-size: 0.9em;
    color: #fff;
    background: rgba(0, 0, 0, 0.5);
    padding: 2px 8px;
    border-radius: 10px;
    opacity: 0;
    transition: opacity 0.3s ease;
}

.vote-buttons button:hover::before {
    opacity: 1;
}

.total-votes {
    text-align: center;
    color: #fff;
    font-size: 1.2em;
    margin: 15px 0;
    background: rgba(255, 255, 255, 0.1);
    padding: 10px;
    border-radius: 10px;
}

.total-votes span {
    font-weight: bold;
    background: linear-gradient(45deg, #fff, #ffeb3b);
    -webkit-background-clip: text;
    -webkit-text-fill-color: transparent;
}

.chart-canvas {
    max-height: 450px !important;
    margin: 30px 0;
    border-radius: 15px;
    background: rgba(255, 255, 255, 0.95);
    padding: 20px;
    box-shadow: 0 5px 20px rgba(0, 0, 0, 0.1);
}

.share-link {
    display: flex;
    gap: 15px;
    margin-top: 20px;
}

.share-link input {
    flex-grow: 1;
}

@keyframes float {
    0%, 100% { transform: translateY(0); }
    50% { transform: translateY(-10px); }
}
Let's examine some key styling features:
Animated Background: We use a gradient background with animation to create visual interest
Glass Card Effect: Semi-transparent cards with backdrop filter for a modern look
Input Animations: Form elements scale slightly on focus for better feedback
Button Effects: Custom styling with hover animations and gradients
Chart Styling: We've styled the chart area to match our overall design
The JavaScript Logic 🧠
Now for the most important part - the JavaScript that powers our poll creator. We'll use a class-based approach and the Chart.js library.
class Poll {
    constructor() {
        this.question = '';
        this.options = new Map();
        this.chart = null;
        this.totalVotes = 0;
    }

    initializeChart() {
        const ctx = document.getElementById('resultsChart').getContext('2d');
        this.chart = new Chart(ctx, {
            type: 'pie',
            data: {
                labels: [],
                datasets: [{
                    data: [],
                    backgroundColor: [
                        '#FF6B6B', '#4ECDC4', '#45B7D1',
                        '#96CEB4', '#FFEEAD', '#D4A5A5'
                    ],
                    borderWidth: 2,
                    borderColor: '#fff'
                }]
            },
            options: {
                responsive: true,
                plugins: {
                    legend: {
                        position: 'bottom',
                        labels: {
                            color: '#333',
                            font: { size: 14, weight: 'bold' },
                            padding: 20
                        }
                    }
                },
                animation: {
                    duration: 1500,
                    easing: 'easeOutBounce'
                }
            }
        });
    }

    updateChart() {
        if (this.chart) {
            this.chart.data.labels = Array.from(this.options.keys());
            this.chart.data.datasets[0].data = Array.from(this.options.values());
            this.chart.update();
        }
    }

    calculatePercentage(votes) {
        return this.totalVotes === 0 ? 0 : Math.round((votes / this.totalVotes) * 100);
    }
}

const poll = new Poll();

document.addEventListener('DOMContentLoaded', () => {
    const addOptionBtn = document.getElementById('addOption');
    const createPollBtn = document.getElementById('createPoll');
    const optionsContainer = document.getElementById('optionsContainer');
    const resultsSection = document.getElementById('resultsSection');
    const voteButtons = document.getElementById('voteButtons');
    const activeQuestion = document.getElementById('activeQuestion');
    const shareLink = document.getElementById('shareLink');
    const copyLinkBtn = document.getElementById('copyLink');
    const totalVotesSpan = document.getElementById('totalVotes');

    function generateShareUrl(question, options) {
        const baseUrl = window.location.origin + window.location.pathname;
        const pollData = { q: question, o: options };
        const encodedData = btoa(JSON.stringify(pollData));
        return `${baseUrl}?poll=${encodedData}`;
    }

    function loadPollFromUrl() {
        const urlParams = new URLSearchParams(window.location.search);
        const pollData = urlParams.get('poll');
        if (pollData) {
            try {
                const decodedData = JSON.parse(atob(pollData));
                document.getElementById('pollQuestion').value = decodedData.q;
                optionsContainer.innerHTML = '';
                decodedData.o.forEach((option, index) => {
                    const newOption = document.createElement('input');
                    newOption.type = 'text';
                    newOption.className = 'option-input fancy-input';
                    newOption.value = option;
                    newOption.style.animation = `slideIn 0.5s ease ${index * 0.1}s both`;
                    optionsContainer.appendChild(newOption);
                });
                createPollBtn.click();
            } catch (e) {
                console.error('Invalid poll data in URL');
            }
        }
    }

    addOptionBtn.addEventListener('click', () => {
        if (optionsContainer.children.length < 6) {
            const newOption = document.createElement('input');
            newOption.type = 'text';
            newOption.className = 'option-input fancy-input';
            newOption.placeholder = `Option ${optionsContainer.children.length + 1}`;
            newOption.style.animation = 'slideIn 0.5s ease';
            optionsContainer.appendChild(newOption);
        }
    });

    createPollBtn.addEventListener('click', () => {
        const question = document.getElementById('pollQuestion').value;
        const options = Array.from(optionsContainer.getElementsByTagName('input'))
            .map(input => input.value.trim())
            .filter(value => value !== '');

        if (question && options.length >= 2) {
            poll.question = question;
            options.forEach(opt => poll.options.set(opt, 0));

            activeQuestion.textContent = question;
            voteButtons.innerHTML = '';
            options.forEach((opt, index) => {
                const btn = document.createElement('button');
                btn.textContent = opt;
                btn.className = 'fancy-btn';
                btn.style.animation = `slideIn 0.5s ease ${index * 0.1}s both`;
                btn.setAttribute('data-percentage', '0%');
                btn.addEventListener('click', () => {
                    const currentVotes = (poll.options.get(opt) || 0) + 1;
                    poll.options.set(opt, currentVotes);
                    poll.totalVotes++;
                    totalVotesSpan.textContent = poll.totalVotes;
                    const percentage = poll.calculatePercentage(currentVotes);
                    btn.setAttribute('data-percentage', `${percentage}%`);
                    poll.updateChart();
                    btn.style.transform = 'scale(1.05)';
                    setTimeout(() => btn.style.transform = 'scale(1)', 200);
                });
                voteButtons.appendChild(btn);
            });

            if (!poll.chart) poll.initializeChart();
            poll.updateChart();

            resultsSection.style.display = 'block';
            resultsSection.style.animation = 'fadeIn 0.8s ease';
            shareLink.value = generateShareUrl(question, options);
        }
    });

    copyLinkBtn.addEventListener('click', () => {
        shareLink.select();
        navigator.clipboard.writeText(shareLink.value)
            .then(() => {
                copyLinkBtn.textContent = 'Copied!';
                copyLinkBtn.style.background = 'linear-gradient(45deg, #96ceb4, #ffeead)';
                setTimeout(() => {
                    copyLinkBtn.textContent = 'Copy Link';
                    copyLinkBtn.style.background = 'linear-gradient(45deg, #ff6b6b, #ff8e53)';
                }, 2000);
            })
            .catch(err => console.error('Failed to copy: ', err));
    });

    loadPollFromUrl();
});

const styleSheet = document.styleSheets[0];
styleSheet.insertRule(`
    @keyframes slideIn {
        from {
            opacity: 0;
            transform: translateY(20px);
        }
        to {
            opacity: 1;
            transform: translateY(0);
        }
    }
`, styleSheet.cssRules.length);

styleSheet.insertRule(`
    @keyframes fadeIn {
        from { opacity: 0; }
        to { opacity: 1; }
    }
`, styleSheet.cssRules.length);
Let's walk through how this JavaScript works:
The Poll Class
We created a Poll class to manage our poll data and chart. This helps organize our code and keeps related functionality together. The class includes methods for:
Initializing the chart: Sets up a pie chart using Chart.js with custom styling
Updating the chart: Refreshes the chart with the latest voting data
Calculating percentages: Computes vote percentages for display
Event Handling
Our main event listeners handle:
Adding options: Allows users to add up to 6 voting options
Creating a poll: Takes the question and options, initializes the chart, and generates a share link
Recording votes: Updates the data and chart when users vote
Copying the share link: Provides feedback when users copy the link
The Share Link System
One of the most powerful features is the ability to share polls. Here's how it works:
We encode the poll data (question and options) using Base64
We add this encoded data to the URL as a query parameter
When someone loads the page with this parameter, we decode it and automatically rebuild the poll
How It All Works Together 🔄
Let's trace through the application flow:
User enters a poll question and at least two options
User clicks "Launch Poll" to create their poll
The application initializes the chart and generates a shareable link
When someone votes, the chart updates in real-time with new percentages
Anyone with the share link can access the same poll and add their votes
Advanced Features Explained 🚀
Real-Time Updates
The real-time updates happen because we're directly manipulating the DOM and calling the Chart.js update method after each vote. No server or complex setup needed!
Animations
We use CSS animations for most visual effects and Chart.js built-in animations for the chart updates. This gives users immediate visual feedback.
Data Encoding
For sharing polls, we use the btoa() and atob() functions to encode and decode JSON data to Base64 strings that can be safely used in URLs.
Potential Enhancements 🌟
Ways you could extend this project:
Local Storage: Save polls and votes in local storage to persist between page refreshes
Backend Integration: Add a server to store polls permanently and enable wider sharing
User Authentication: Allow only poll creators to reset or close polls
Multiple Chart Types: Add options for different visualization types
Export Results: Allow downloading results as CSV or images
Conclusion 🎉
Congratulations! You've built a fully functional poll creator with real-time result visualization. This project demonstrates the power of modern JavaScript and CSS, allowing you to create interactive applications without complex backend systems.
The combination of Chart.js for visualization, CSS animations for visual feedback, and clever URL parameter handling for sharing makes this a surprisingly powerful application with just a few files of code.
Feel free to experiment with the code, add new features, or integrate it into your own projects!
Happy coding! 🚀
Subscribe to my newsletter
Read articles from Learn Computer Academy directly inside your inbox. Subscribe to the newsletter, and don't miss out.
Written by