Observability with OpenTelemetry and Grafana stack part 3: Setting up log aggregation with Loki, Grafana, and OpenTelemetry Collector
 Driptaroop Das
Now we are in the thick of things. Previously, we have the services running in docker containers and are instrumented with the OpenTelemetry Java agent to collect the telemetry data. In this part, we will setup the log aggregation with Loki, Grafana, and OpenTelemetry Collector.
OpenTelemetry Collector
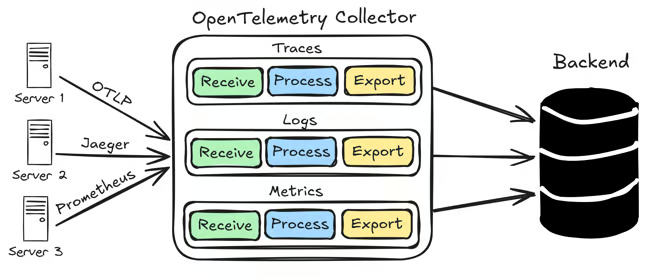
The OpenTelemetry Collector is one of the core components of the OpenTelemetry observability stack. It is a vendor-agnostic neutral intermediary for collecting, processing, and forwarding telemetry signals (traces, metrics, and logs) to an observability backend.
Its primary goal is to simplify observability architectures by removing the need to deploy multiple telemetry agents. Instead, the Collector consolidates diverse telemetry signals into a single, unified solution, significantly reducing complexity and overhead. Beyond simplification, the Collector provides a robust abstraction layer between your applications and observability platforms. This separation grants flexibility, allowing seamless integration with various backends without altering application instrumentation.
The Collector natively supports the OpenTelemetry Protocol (OTLP), but it also integrates effortlessly with open source observability data formats like Jaeger, Prometheus, Fluent Bit, and others. Its vendor-neutral architecture ensures compatibility with a broad range of open-source and commercial observability solutions.
Benefits of using OpenTelemetry Collector
- Unified Telemetry Collection: Consolidates traces, metrics, and logs into a single collection point, simplifying deployment and management.
- Reduced Complexity: Eliminates the need for multiple telemetry agents, significantly streamlining observability infrastructure.
- Flexibility and Abstraction: Provides an abstraction layer between applications and observability backends, enabling seamless integration without altering application instrumentation.
- Vendor-Neutral Integration: Supports the OpenTelemetry Protocol (OTLP) and popular telemetry formats like Jaeger, Prometheus, and Fluent Bit, allowing interoperability with diverse backend solutions.
- Extensibility: Highly customizable through user-defined components, facilitating adaptation to specialized requirements and advanced use cases such as filtering and batching.
- Cost Efficiency: Reduces operational overhead by consolidating agents and optimizing telemetry data processing.
- Open Source and Community-Driven: Built on Go and licensed under Apache 2.0, benefiting from continuous enhancements by a vibrant open-source community.
How does OpenTelemetry Collector work?

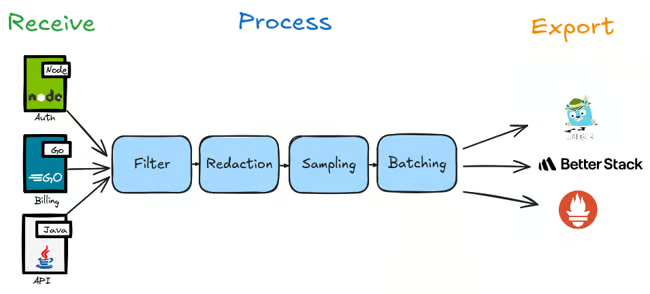
From a high level, open telemetry collector is a collection of several pipelines. Each pipeline represents a different type of telemetry signal (traces, metrics, logs) and consists of several parts like receivers, processors, and exporters.
- Receivers: Receivers are responsible data reception. They ingest telemetry data from various sources. It collects telemetry data from a variety of sources, including instrumented applications, agents, and other collectors. This is done through
receivercomponents. - Processors: Processors are responsible for transforming and enriching telemetry data. They can be used to filter, aggregate, or enhance telemetry data before it is exported. This is done through
processorcomponents. - Exporters: Exporters are responsible for sending telemetry data to a backend system, such as observability platforms, databases, or cloud services for purposes such as tracing systems, metric stores, and log aggregators. This is done through
exportercomponents.
By combining receivers, processors, and exporters in the Collector configuration, you can create pipelines which serve as a separate processing lane for logs, traces, or metrics. Different combinations of receivers, processors, and exporters can be used to create simple but powerful pipelines that meet your specific observability requirements.

NOTE: There are also
Connectorcomponents can also link one pipeline's output to another's input allowing you to use the processed data from one pipeline as the starting point for another. This enables more complex and interconnected data flows within the Collector.
OpenTelemetry Collector Flavors
There are 2 flavors of the OpenTelemetry Collector: core and contrib.
- Core: This contains only the most essential components along with frequently used extras like filter and attribute processors, and popular exporters such as Prometheus, Kafka, and others. It's distributed under the
otelcolbinary. - Contrib: This is the comprehensive version, including almost everything from both the
coreandcontribrepositories, except for components that are still under development. It's distributed under theotelcol-contribbinary. This is the one we will be using.
Setting up OpenTelemetry Collector
Setting up the OpenTelemetry Collector configuration
We will be using the contrib version of the OpenTelemetry Collector. otel collector uses a configuration file to setup the pipelines. Let's create the config file for the collector in the new directory called config/otel and name it otel.yaml.
receivers:
  otlp:
      protocols:
        http:
          endpoint: "0.0.0.0:4318"
processors:
  batch:

exporters:
  otlphttp/loki:
    endpoint: http://loki:3100/otlp # loki is the loki service running in the same docker network. We will setup the loki service later.

service:
  pipelines:
    logs:
      receivers: [otlp]
      processors: [batch]
      exporters: [otlphttp/loki]
In this otel config file, we are setting up the otel collector pipeline(s). So far the only pipeline we configured is the logs pipeline.
- We are using the
otlpreceiver to receive the logs from the services. This logs are exported from the services in theOTLPformat by the OpenTelemetry Java agent. The otlp receiver can receive information over gRPC or HTTP. We are using the HTTP protocol. We are creating an endpoint on which the receiver will listen for the instrumented services to send the data. - We are using the
batchprocessor to batch the logs before exporting them. - We are using the
otlphttp/lokiexporter to export the logs to the loki service running in the same docker network. Loki is fully compatible with OTLP and can receive logs in the OTLP format over HTTP. - Finally, we are setting up the
logspipeline with theotlpreceiver,batchprocessor, andotlphttp/lokiexporter creating a single processing lane for logs.
We can now add the otel collector service to the compose file.
    otel-collector:
      image: otel/opentelemetry-collector-contrib:0.120.0
      volumes:
        - ./config/otel/otel.yaml:/etc/config.yaml
      command:
        - "--config=/etc/config.yaml"
      profiles:
        - otel
We have to edit the services compose definition to add the otel collector endpoint so that the otel Java Agent knows where to send the telemetry data. Since we are using anchored extension sections, we can easily add the otel collector endpoint to all the services
by adding the OTEL_EXPORTER_OTLP_ENDPOINT environment variable to the x-common-env-services anchored extension section.
x-common-env-services: &common-env-services
  SPRING_DATASOURCE_URL: jdbc:postgresql://db-postgres:5432/postgres
  SPRING_DATASOURCE_USERNAME: postgres
  SPRING_DATASOURCE_PASSWORD: password
  OTEL_EXPORTER_OTLP_ENDPOINT: "http://otel-collector:4318"
  OTEL_LOGS_EXPORTER: otlp
Loki
Now that the application is sending the logs to the OpenTelemetry Collector via the OpenTelemetry Java agent, we need to setup the log aggregation backend to store and query the logs so that the open telemetry collector can export the logs to it. We will be using Loki for this purpose. Loki is a horizontally-scalable, highly-available, multi-tenant log aggregation system inspired by Prometheus. It is designed to be very cost-effective and easy to operate, as it does not index the contents of the logs, but rather a set of labels for each log stream.
Setting up Loki
Loki needs a configuration file to setup the log aggregation. Let's create the config file for Loki in the new directory called config/loki and name it loki.yaml.
# Disable multi-tenancy, ensuring a single tenant for all log streams.
auth_enabled: false

# Configuration block for the Loki server.
server:
  http_listen_port: 3100  # Listen on port 3100 for all incoming traffic.
  log_level: info         # Set the log level to info.

# The limits configuration block allows default global and per-tenant limits to be set (which can be altered in an
# overrides block). In this case, volume usage is be enabled globally (as there is one tenant).
# This is used by the Logs Explorer app in Grafana.
limits_config:
  volume_enabled: true

# The common block is used to set options for all of the components that make up Loki. These can be overridden using
# the specific configuration blocks for each component.
common:
  instance_addr: 127.0.0.1            # The address at which this Loki instance can be reached on the local hash ring.
  # Loki is running as a single binary, so it's the localhost address.
  path_prefix: /loki                  # Prefix for all HTTP endpoints.
  # Configuration of the underlying Loki storage system.
  storage:
    # Use the local filesystem. In a production environment, you'd use an object store like S3 or GCS.
    filesystem:
      chunks_directory: /loki/chunks  # The FS directory to store the Loki chunks in.
      rules_directory: /loki/rules    # The FS directory to store the Loki rules in.
  replication_factor: 1               # The replication factor (RF) determines how many ingesters will store each chunk.
    # In this case, we have one ingester, so the RF is 1, but in a production system
  # you'd have multiple ingesters and set the RF to a higher value for resilience.
  # The ring configuration block is used to configure the hash ring that all components use to communicate with each other.
  ring:
    # Use an in-memory ring. In a production environment, you'd use a distributed ring like memberlist, Consul or etcd.
    kvstore:
      store: inmemory

# The schema_config block is used to configure the schema that Loki uses to store log data. Loki allows the use of
# multiple schemas based on specific time periods. This allows backwards compatibility on schema changes.
schema_config:
  # Only one config is specified here.
  configs:
    - from: 2020-10-24          # When the schema applies from.
      store: tsdb               # Where the schema is stored, in this case using the TSDB store.
      object_store: filesystem  # As configured in the common block above, the object store is the local filesystem.
      schema: v13               # Specify the schema version to use, in this case the latest version (v13).
      # The index configuration block is used to configure how indexing tables are created and stored. Index tables
      # are the directory that allows Loki to determine which chunks to read when querying for logs.
      index:
        prefix: index_          # Prefix for all index tables.
        period: 24h             # The period for which each index table covers. In this case, 24 hours.

# The ruler configuration block to configure the ruler (for recording rules and alerts) in Loki.
ruler:
  alertmanager_url: http://localhost:9093   # The URL of the Alertmanager to send alerts to. Again, this is a single
  # binary instance running on the same host, so it's localhost.

analytics:
  reporting_enabled: false
The details of this config file is fairly complex but in a nutshell, we are setting up Loki to listen on port 3100 for incoming traffic (if you remember, that is the port we were exporting the logs to in the otel collector config). We are using the local filesystem to store the logs. In a production environment, you'd use an object store like S3 or GCS. We are also setting up the replication factor to 1. In a production system, you'd have multiple ingesters and set the RF to a higher value for resilience.
We can now add the Loki service to the compose file.
  loki:
    image: grafana/loki:3.4.2
    command: [ "--pattern-ingester.enabled=true", "-config.file=/etc/loki/loki.yaml" ]
    volumes:
      - "./config/loki/loki.yaml:/etc/loki/loki.yaml"
    profiles:
      - grafana
Grafana
So now we have a log aggregation system in place. The only thing left is to visualize the logs. We will be using Grafana for this purpose.
Grafana is a multi-platform open-source analytics and interactive visualization web application. It provides charts, graphs, and alerts for the web when connected to widely supported data sources.
Setting up Grafana
Grafana needs a configuration file to setup the data sources. Let's create the datasource config file for Grafana in the new directory called config/grafana and name it grafana-datasource.yaml.
apiVersion: 1

datasources:
  - name: Loki
    type: loki
    uid: loki
    access: proxy
    url: http://loki:3100
    basicAuth: false
    isDefault: false
    version: 1
    editable: false
In this config file, we are setting up the Loki datasource for Grafana. We are setting the datasource name to Loki, the type to loki, the url to http://loki:3100 (if you remember, that is the port Loki is listening on for incoming traffic).
We can now add the Grafana service to the compose file.
    grafana:
      image: grafana/grafana:11.5.2
      volumes:
        - "./config/grafana/grafana-datasource.yaml:/etc/grafana/provisioning/datasources/datasources.yaml"
        - "./ca.crt:/etc/ssl/certs/ca-certificates.crt" # If you have any custom CA certificates, you can add them here. We will use this to trust the certificates in the services. Ignore if not needed.
      ports:
        - "3000:3000"
      environment:
        - GF_FEATURE_TOGGLES_ENABLE=flameGraph traceqlSearch correlations traceQLStreaming metricsSummary traceqlEditor traceToMetrics traceToProfiles datatrails # Feature flags to enable some of the features in Grafana that we will need later on.
        - GF_INSTALL_PLUGINS=grafana-lokiexplore-app,grafana-exploretraces-app,grafana-pyroscope-app # Install the plugins for Loki, Explore Traces, and Pyroscope. we wil use them later on for drill down.
        - GF_AUTH_ANONYMOUS_ENABLED=true # Enable anonymous access to Grafana
        - GF_AUTH_ANONYMOUS_ORG_ROLE=Admin # Set the role for the anonymous user
        - GF_AUTH_DISABLE_LOGIN_FORM=true # Disable the login form and log the user in automatically
      depends_on:
        - loki
      profiles:
        - grafana
Now, the system should somewhat look like this:
Start the services
Now that we have log aggregation and visualization in place, we can start the services and the auth server along with the OpenTelemetry Collector, Loki, and Grafana.
docker compose --profile "*" up --force-recreate --build
Check the logs of the services, the OpenTelemetry Collector, Loki, and Grafana to see if everything is running fine.
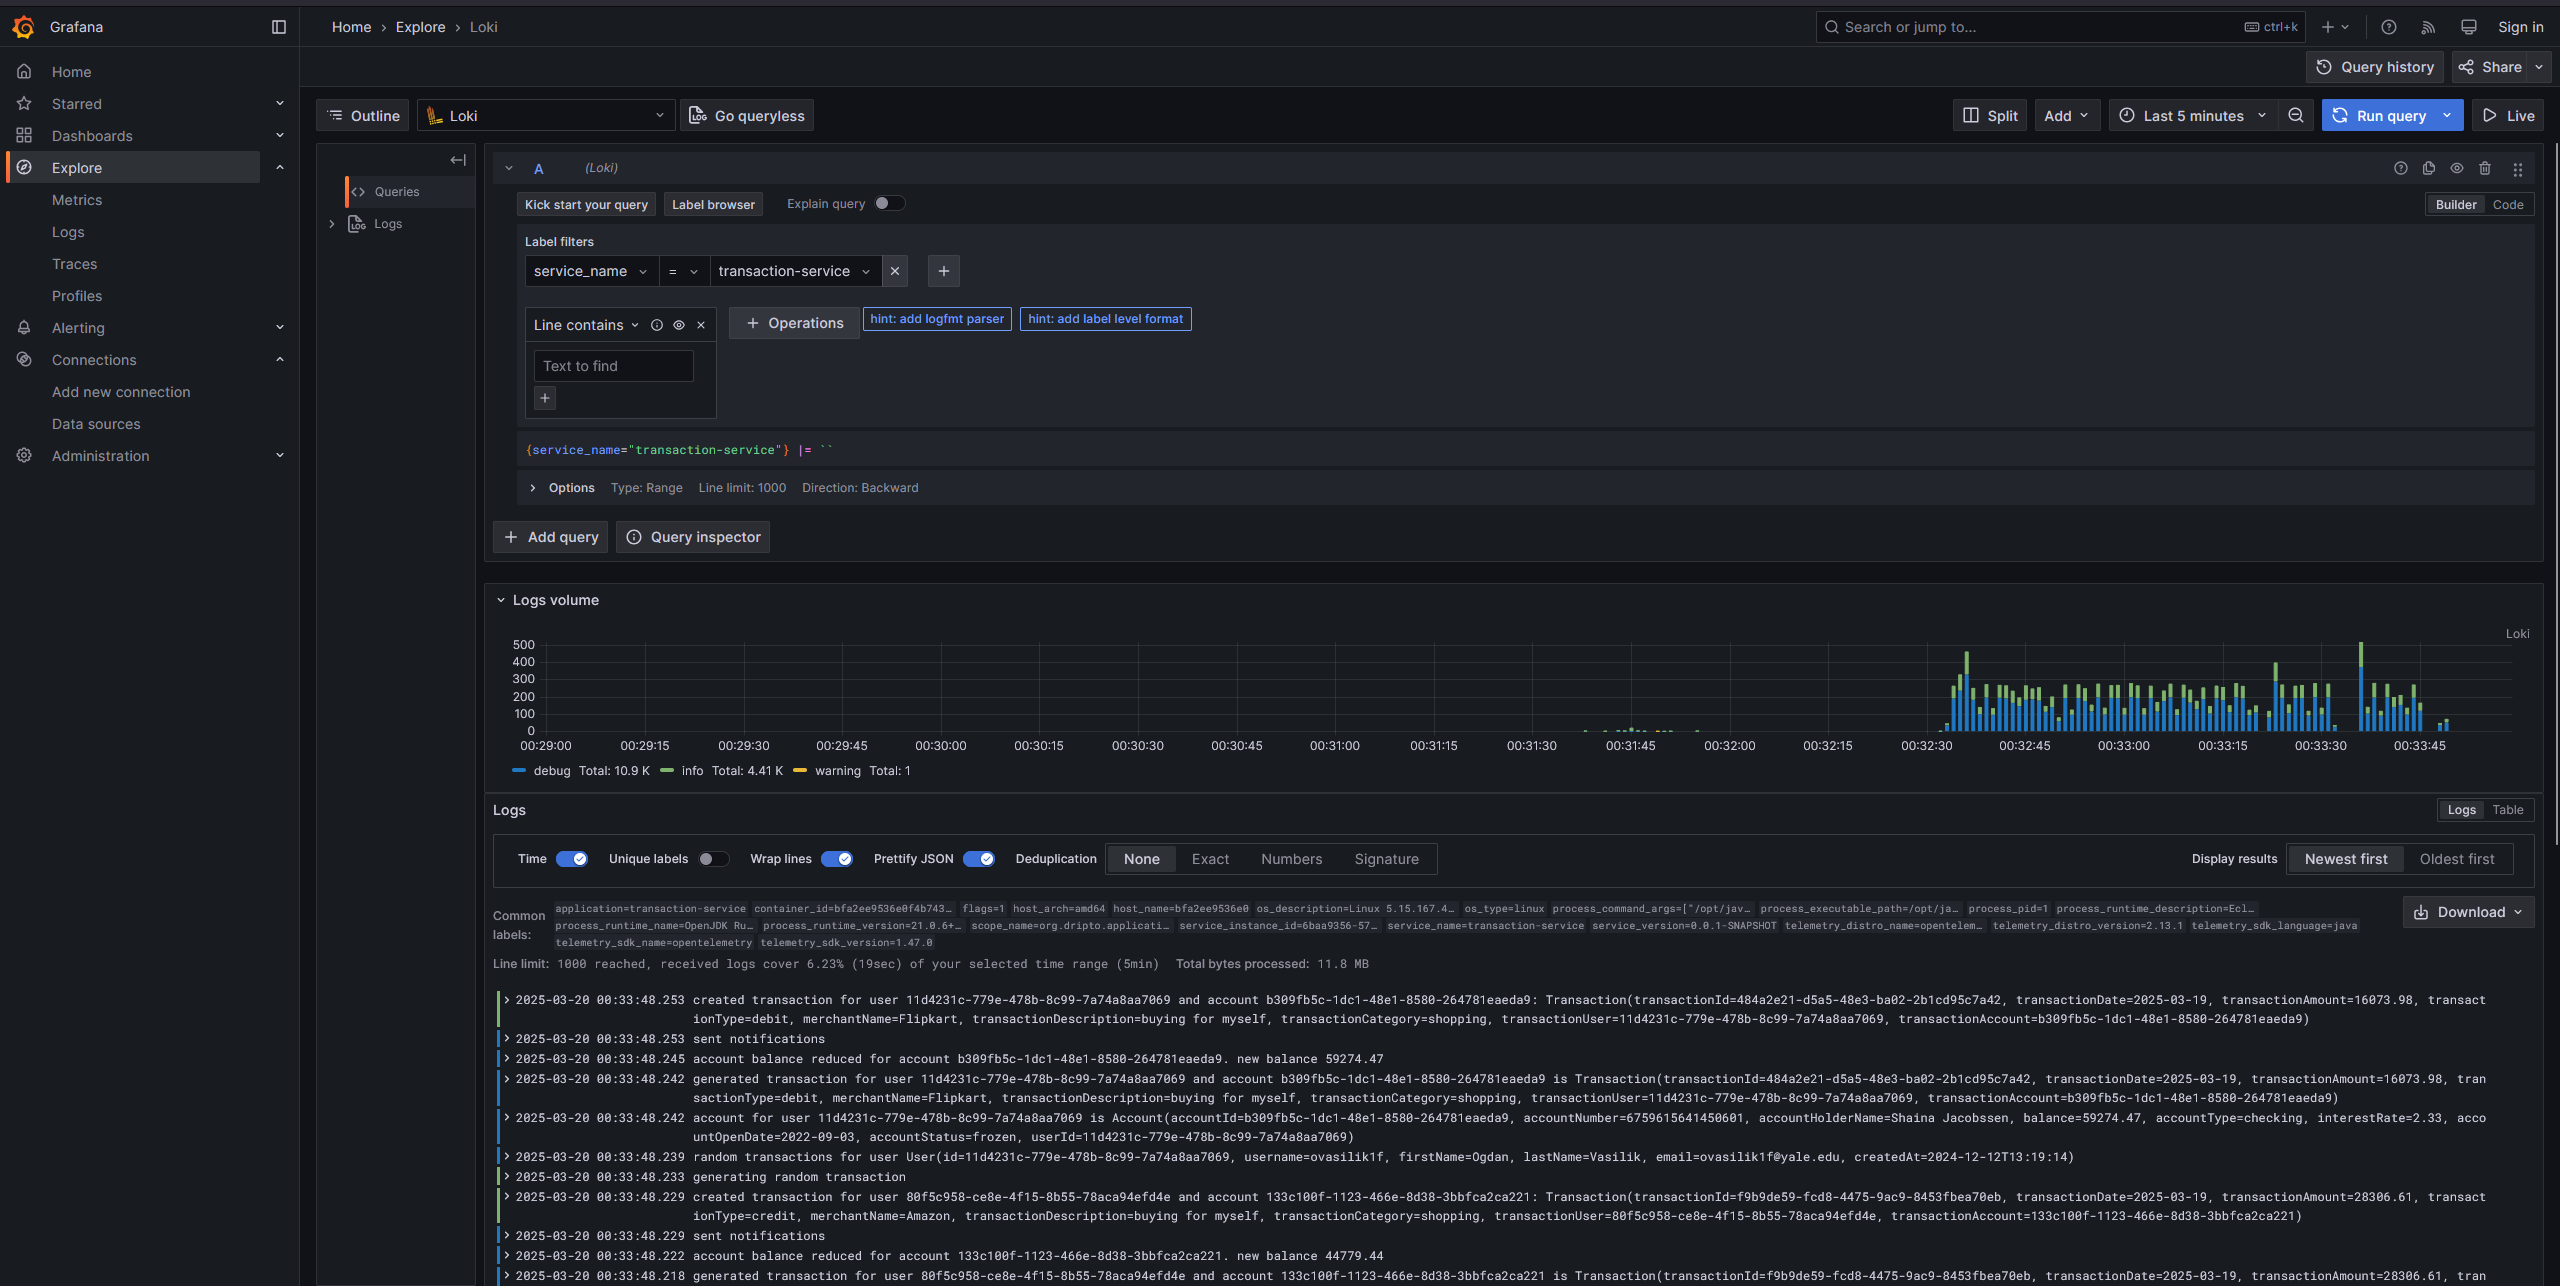
Finally, if everything is running fine, you can access Grafana at http://localhost:3000. You will be able to see the logs from the services in the Explore section of Grafana by selecting the Loki datasource. You may have to filter by the service name to see the logs from a particular service.

In the next part, we will setup the metrics monitoring with Mimir/Prometheus, Grafana, and OpenTelemetry Collector.
Subscribe to my newsletter
Read articles from Driptaroop Das directly inside your inbox. Subscribe to the newsletter, and don't miss out.
Written by

Driptaroop Das
Driptaroop Das
Self diagnosed nerd 🤓 and avid board gamer 🎲
