Observability with OpenTelemetry and Grafana stack Part 5: Setting up distributed tracing with Tempo, Grafana, and OpenTelemetry Collector
 Driptaroop Das
Now that we have log aggregation and metrics visualization in place, the only thing left is to setup the distributed tracing. We will be using Tempo for this purpose.
Tempo
Tempo is a high-scale, production-grade, and cost-effective distributed tracing backend. It is designed to be highly scalable, cost-effective, and easy to operate. Tempo is a horizontally scalable, highly available, and multi-tenant tracing backend that is optimized for high cardinality data and long retention periods.
Tempo is designed to work seamlessly with Grafana and Loki, providing a unified observability platform for logs, metrics, and traces.
We would use the same OTEL collector OTLP receiver to receive the traces from the services. Then OTEL collector will export the traces to Tempo and we will visualize the traces in Grafana.
Setting up OpenTelemetry Collector for traces
Since we are using the OTLP receiver in OTEL collector for logs already, we can use the same receiver for traces. The OTEL java agent can export the traces alongside the logs to the OpenTelemetry Collector using the OTLP protocol. We just need to add the OTEL_TRACES_EXPORTER environment variable to the x-common-env-services anchored extension section in the compose file.
x-common-env-services: &common-env-services
  SPRING_DATASOURCE_URL: jdbc:postgresql://db-postgres:5432/postgres
  SPRING_DATASOURCE_USERNAME: postgres
  SPRING_DATASOURCE_PASSWORD: password
  OTEL_EXPORTER_OTLP_ENDPOINT: "http://otel-collector:4318"
  OTEL_EXPORTER_PROMETHEUS_HOST: "0.0.0.0"
  OTEL_METRICS_EXPORTER: otlp
  OTEL_TRACES_EXPORTER: otlp # set the traces exporter to otlp
  OTEL_LOGS_EXPORTER: otlp
Now lets update the otel collector config file to include the traces pipeline.
receivers:
  otlp:
      protocols:
        http:
          endpoint: "0.0.0.0:4318"
  prometheus:
    config:
      scrape_configs:
        - job_name: 'mimir'
          scrape_interval: 5s
          static_configs:
              - targets: ['mimir:9009']
                labels:
                  group: 'infrastructure'
                  service: 'mimir'
        - job_name: 'user-service'
          scrape_interval: 5s
          metrics_path: '/actuator/prometheus'
          static_configs:
              - targets: ['user-service:8080']
                labels:
                  group: 'service'
                  service: 'user-service'
        - job_name: 'account-service'
          scrape_interval: 5s
          metrics_path: '/actuator/prometheus'
          static_configs:
            - targets: [ 'account-service:8080' ]
              labels:
                group: 'service'
                service: 'account-service'
        - job_name: 'transaction-service'
          scrape_interval: 5s
          metrics_path: '/actuator/prometheus'
          static_configs:
            - targets: [ 'transaction-service:8080' ]
              labels:
                group: 'service'
                service: 'transaction-service'
        - job_name: 'notification-service'
          scrape_interval: 5s
          metrics_path: '/actuator/prometheus'
          static_configs:
            - targets: [ 'notification-service:8080' ]
              labels:
                group: 'service'
                service: 'notification-service'
        - job_name: 'auth-server'
          scrape_interval: 5s
          metrics_path: '/actuator/prometheus'
          static_configs:
            - targets: [ 'auth-server:9090' ]
              labels:
                group: 'service'
                service: 'auth-server'
        - job_name: 'grafana'
          static_configs:
            - targets: [ 'grafana:3000' ]
              labels:
                service: 'grafana'
                group: 'infrastructure'

processors:
  batch:

exporters:
  otlphttp/mimir:
    endpoint: http://mimir:9009/otlp
  otlphttp/loki:
    endpoint: http://loki:3100/otlp
  otlphttp/tempo: # new exporter for exporting traces to tempo
    endpoint: http://tempo:4318
    tls:
      insecure: true

service:
  pipelines:
    metrics:
      receivers: [otlp, prometheus]
      processors: [batch]
      exporters: [otlphttp/mimir]
    logs:
      receivers: [otlp]
      processors: [batch]
      exporters: [otlphttp/loki]
    traces: # new pipeline for traces
      receivers: [otlp]
      processors: [batch]
      exporters: [otlphttp/tempo]
Setting up Tempo
Now that the OTEL collector is set up to export the traces to Tempo, we can set up Tempo. We just need to create the Tempo config file and add the Tempo service to the compose file.
Tempo needs a configuration file to setup the storage and other configurations. Let's create the config file for Tempo in the new directory called config/tempo and name it tempo.yaml.
# For more information on this configuration, see the complete reference guide at
# https://grafana.com/docs/tempo/latest/configuration/

# Enables result streaming from Tempo (to Grafana) via HTTP.
stream_over_http_enabled: true

# Configure the server block.
server:
  # Listen for all incoming requests on port 3200.
  http_listen_port: 3200

# The distributor receives incoming trace span data for the system.
distributor:
  receivers:             # This configuration will listen on all ports and protocols that tempo is capable of.
    otlp:
      protocols:
        http:
          endpoint: "0.0.0.0:4318" # OTLP HTTP receiver.
        grpc:            # This example repository only utilises the OTLP gRPC receiver on port 4317.
          endpoint: "0.0.0.0:4317" # OTLP gRPC receiver.

# The ingester receives data from the distributor and processes it into indices and blocks.
ingester:
  max_block_duration: 5m

# The compactor block configures the compactor responsible for compacting TSDB blocks.
compactor:
  compaction:
    block_retention: 1h                # How long to keep blocks. Default is 14 days, this demo system is short-lived.
    compacted_block_retention: 10m     # How long to keep compacted blocks stored elsewhere.

# Configuration block to determine where to store TSDB blocks.
storage:
  trace:
    backend: local                     # Use the local filesystem for block storage. Not recommended for production systems.
    local:
      path: /var/tempo/blocks           # Directory to store the TSDB blocks.

# Configures the metrics generator component of Tempo.
metrics_generator:
  # Specifies which processors to use.
  processor:
    # Span metrics create metrics based on span type, duration, name and service.
    span_metrics:
      # Configure extra dimensions to add as metric labels.
      dimensions:
        - http.method
        - http.target
        - http.status_code
        - service.version
    # Service graph metrics create node and edge metrics for determinng service interactions.
    service_graphs:
      # Configure extra dimensions to add as metric labels.
      dimensions:
        - http.method
        - http.target
        - http.status_code
        - service.version
    # Configure the local blocks processor.
    local_blocks:
      # Ensure that metrics blocks are flushed to storage so TraceQL metrics queries against historical data.
      flush_to_storage: true
  # The registry configuration determines how to process metrics.
  registry:
    # Configure extra labels to be added to metrics.
    external_labels:
      source: tempo
      cluster: "docker-compose"
  # Configures where the store for metrics is located.
  storage:
    # WAL for metrics generation.
    path: /tmp/tempo/generator/wal
    # Where to remote write metrics to.
    remote_write:
      - url: http://mimir:9009/api/v1/push  # URL of locally running Mimir instance.
        send_exemplars: true # Send exemplars along with their metrics.
  traces_storage:
    path: /tmp/tempo/generator/traces

# Global override configuration.
overrides:
  metrics_generator_processors: [ 'service-graphs', 'span-metrics','local-blocks' ] # The types of metrics generation to enable for each tenant.
We can now add the Tempo service to the compose file.
    tempo:
      image: grafana/tempo:2.7.1
      volumes:
        - "./config/tempo/tempo.yaml:/etc/tempo/tempo.yaml"
      command:
        - "--config.file=/etc/tempo/tempo.yaml"
      profiles:
        - grafana
Setting up Grafana for traces
We just need to add the Tempo datasource to Grafana to visualize the traces.
  apiVersion: 1

  datasources:
    - name: Mimir
      type: prometheus
      uid: mimir
      access: proxy
      orgId: 1
      url: http://mimir:9009/prometheus
      basicAuth: false
      isDefault: true
      version: 1
      editable: false
      jsonData:
        httpMethod: POST
        prometheusType: "Mimir"
        tlsSkipVerify: true
    - name: Loki
      type: loki
      uid: loki
      access: proxy
      url: http://loki:3100
      basicAuth: false
      isDefault: false
      version: 1
      editable: false
    - name: Tempo
      type: tempo
      uid: tempo
      access: proxy
      url: http://tempo:3200
      basicAuth: false
      isDefault: false
      version: 1
      editable: false
      jsonData:
        nodeGraph:
          enabled: true
        serviceMap:
          datasourceUid: 'mimir'
        tracesToLogs:
          datasourceUid: loki
          filterByTraceID: false
          spanEndTimeShift: "500ms"
          spanStartTimeShift: "-500ms"
Test the setup
Let's start the entire stack together now.
docker compose --profile "*" up --force-recreate --build
And then will call the transaction service to generate some traces.
# Get the access token by calling token endpoint with client basic auth
# using k6:k6-secret as client id and client secret
curl --location 'http://localhost:9090/oauth2/token' --header 'Content-Type: application/x-www-form-urlencoded' --header 'Authorization: Basic azY6azYtc2VjcmV0' --header 'Cookie: JSESSIONID=98F10ED169A1ADD4083434BEC9B8A27C' --data-urlencode 'grant_type=client_credentials' --data-urlencode 'scope=local'

# Call the transaction service to generate some traces
curl --location --request POST 'http://localhost:8080/transactions/random' \
--header 'Authorization: Bearer eyJraWQiOiI5ZDQzY2NjMy1hMGQyLTQ0YzMtOWRkMi02NGFjNDhhOTJlNTUiLCJhbGciOiJSUzI1NiJ9.eyJzdWIiOiJrNiIsImF1ZCI6Ims2IiwibmJmIjoxNzQyNTA4MDQ1LCJoZWxsbzEiOiJ3b3JsZDEiLCJzY29wZSI6WyJsb2NhbCJdLCJpc3MiOiJodHRwOi8vbG9jYWxob3N0OjkwOTAiLCJleHAiOjE3NDI1MDgzNDUsImlhdCI6MTc0MjUwODA0NSwianRpIjoiMDk4ODYyNGMtYzU5Yy00NTFjLTgwYjQtMWE0YjczMjk5MzJiIn0.oBSUBWXAZwOwol7GfnQpg4k_nFWABoV2GTLYEtA-BELUGMHx0eBD94jxsnr5-8kODzVF31VCQ-NbiotT4dNtiHv3eHBn4YnnlFLNX1VvFQRXz6bcahu_soRTg5c0bURMm5B8xuOL4fuNw8mNFe9WDyzDj5qY0Q-er0NQIQjXyICEdPn91Z5Ofhp6jcv2ANa1GnY6q-KOdFPmljC-eokDpp0Kq_uDtxBD8ns2ogqayWOnWgnOBOtvMju7c_lguvJ0IKm7HnCz1Ud4sbHrJq3UooArtPssDUBWJHQW9B-ugvNulFWGyCFda-A-XQThya_Q3YpWRejPPy6Kt_Z1s4rPBw'
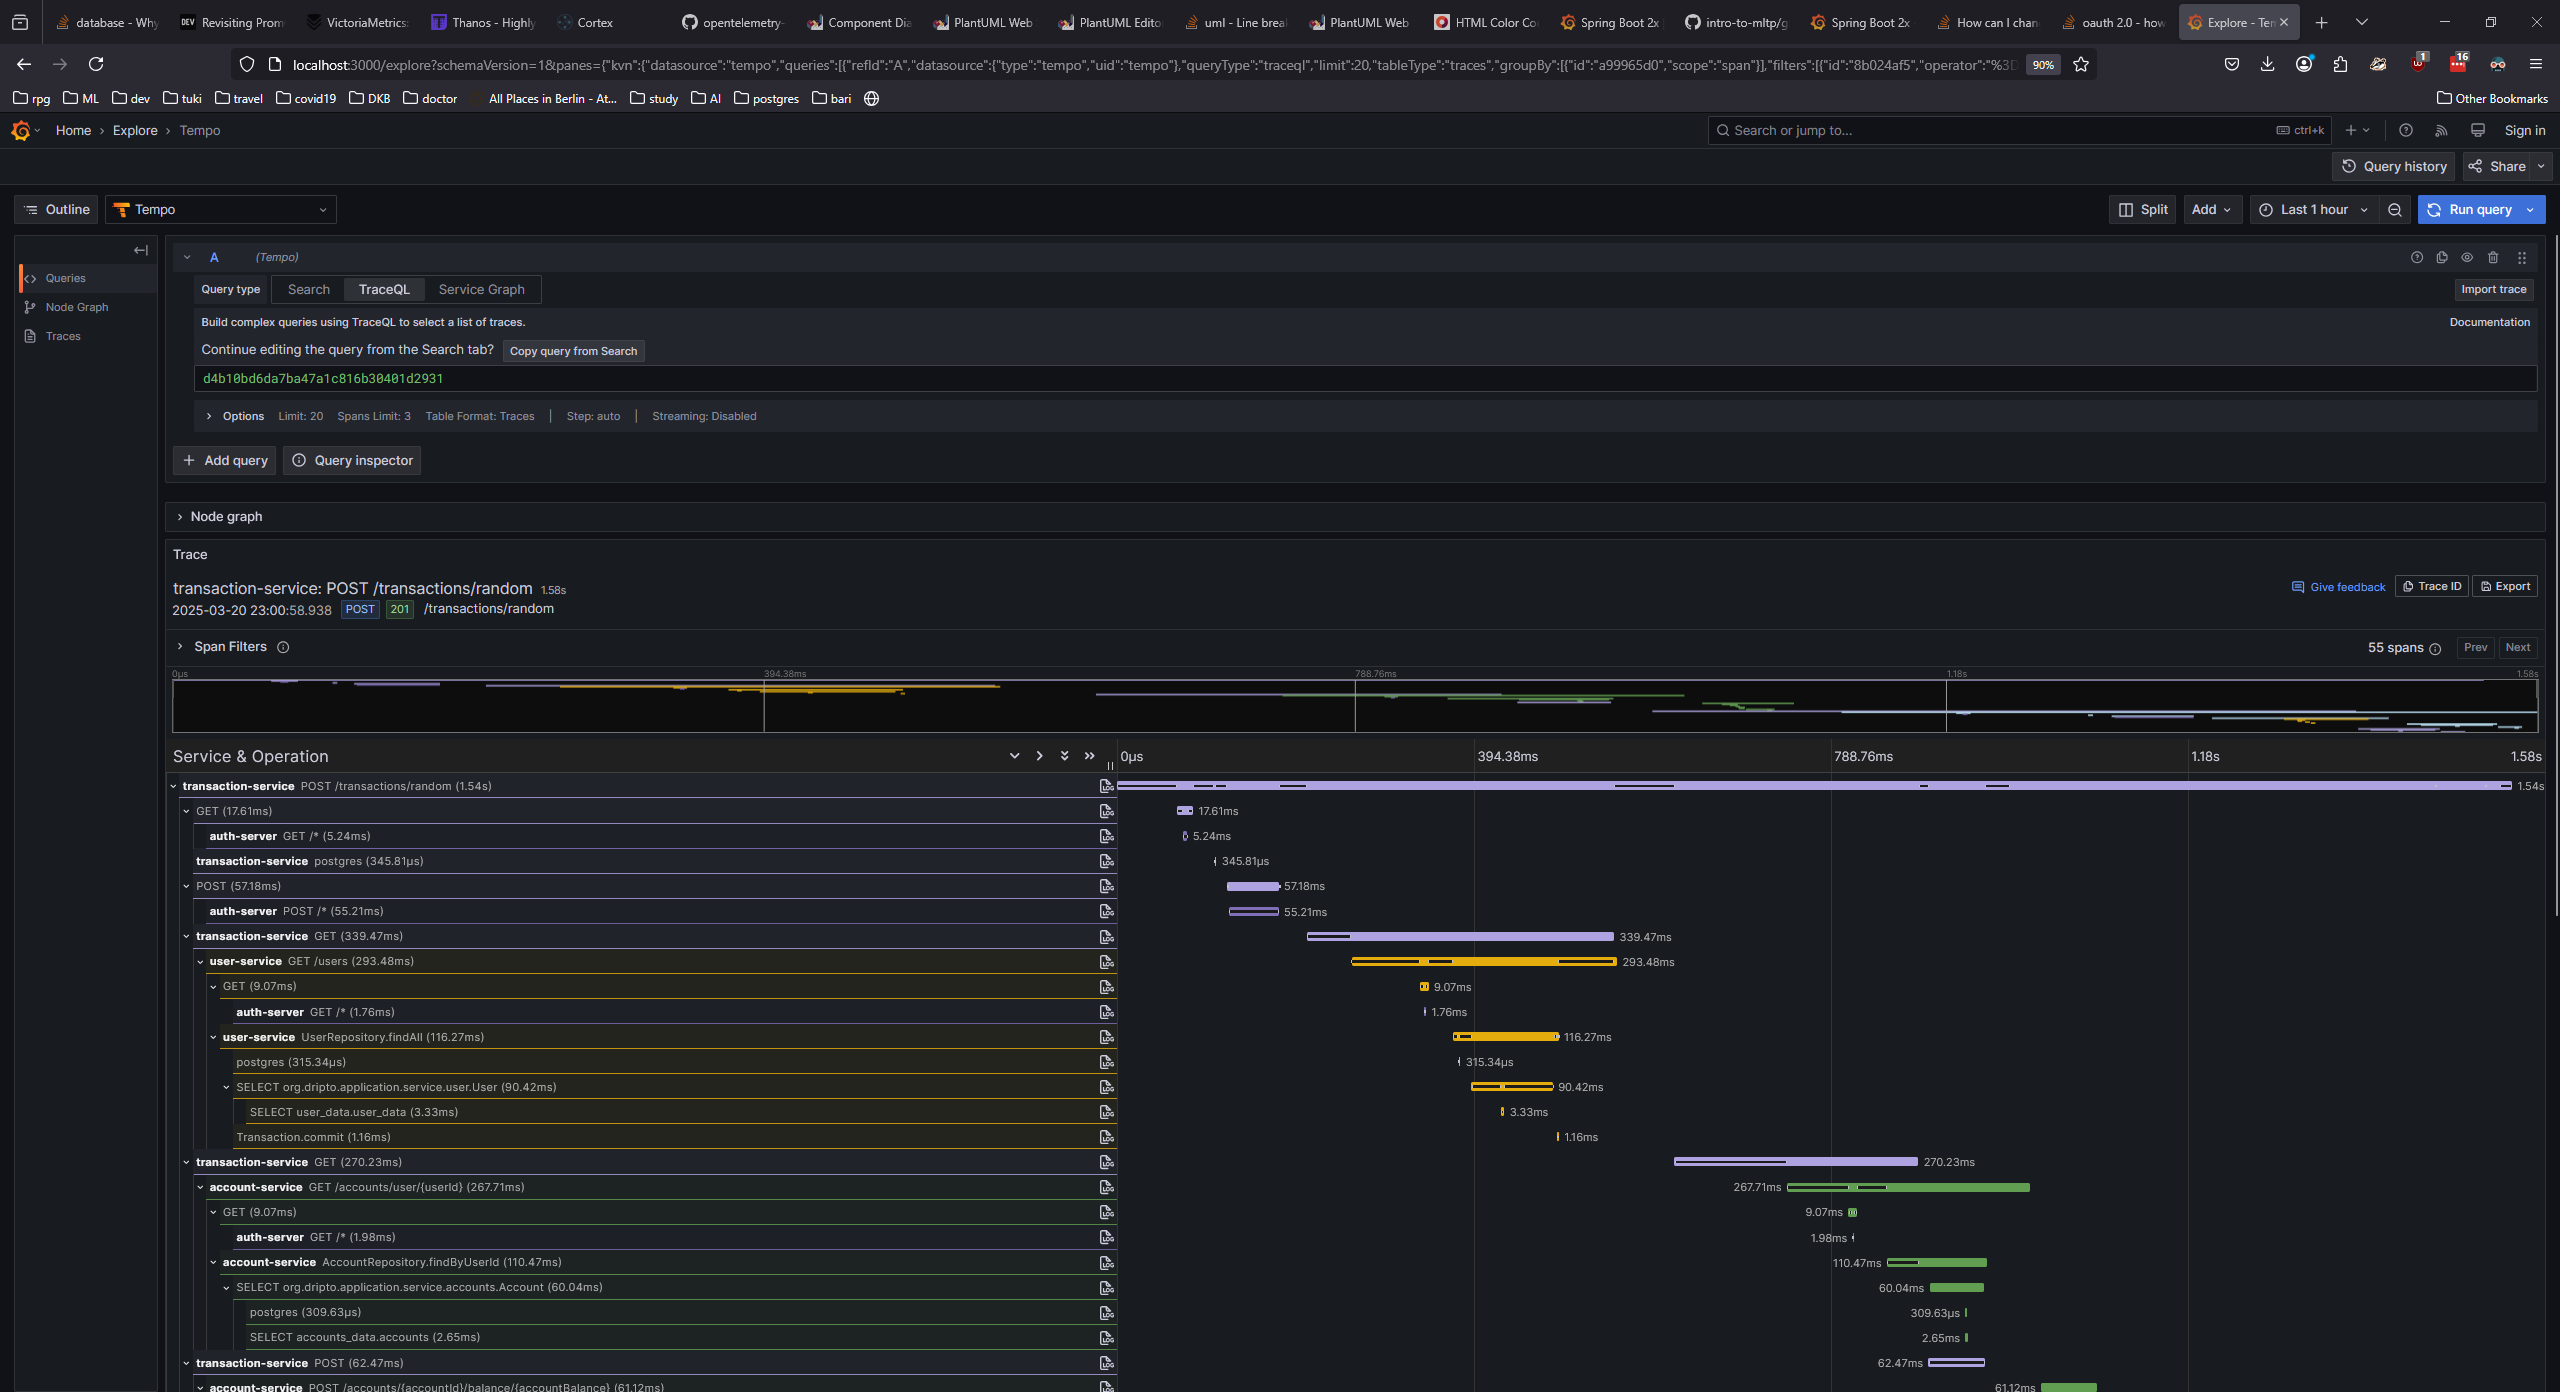
Now finally we can access Grafana at http://localhost:3000. Navigate to the explore section and select the Tempo datasource. You will be able to see the traces from the services.
There should be a bunch of traces generated by the prometheus receiver calling the actuator endpoint of the services. Select the trace to see the details.

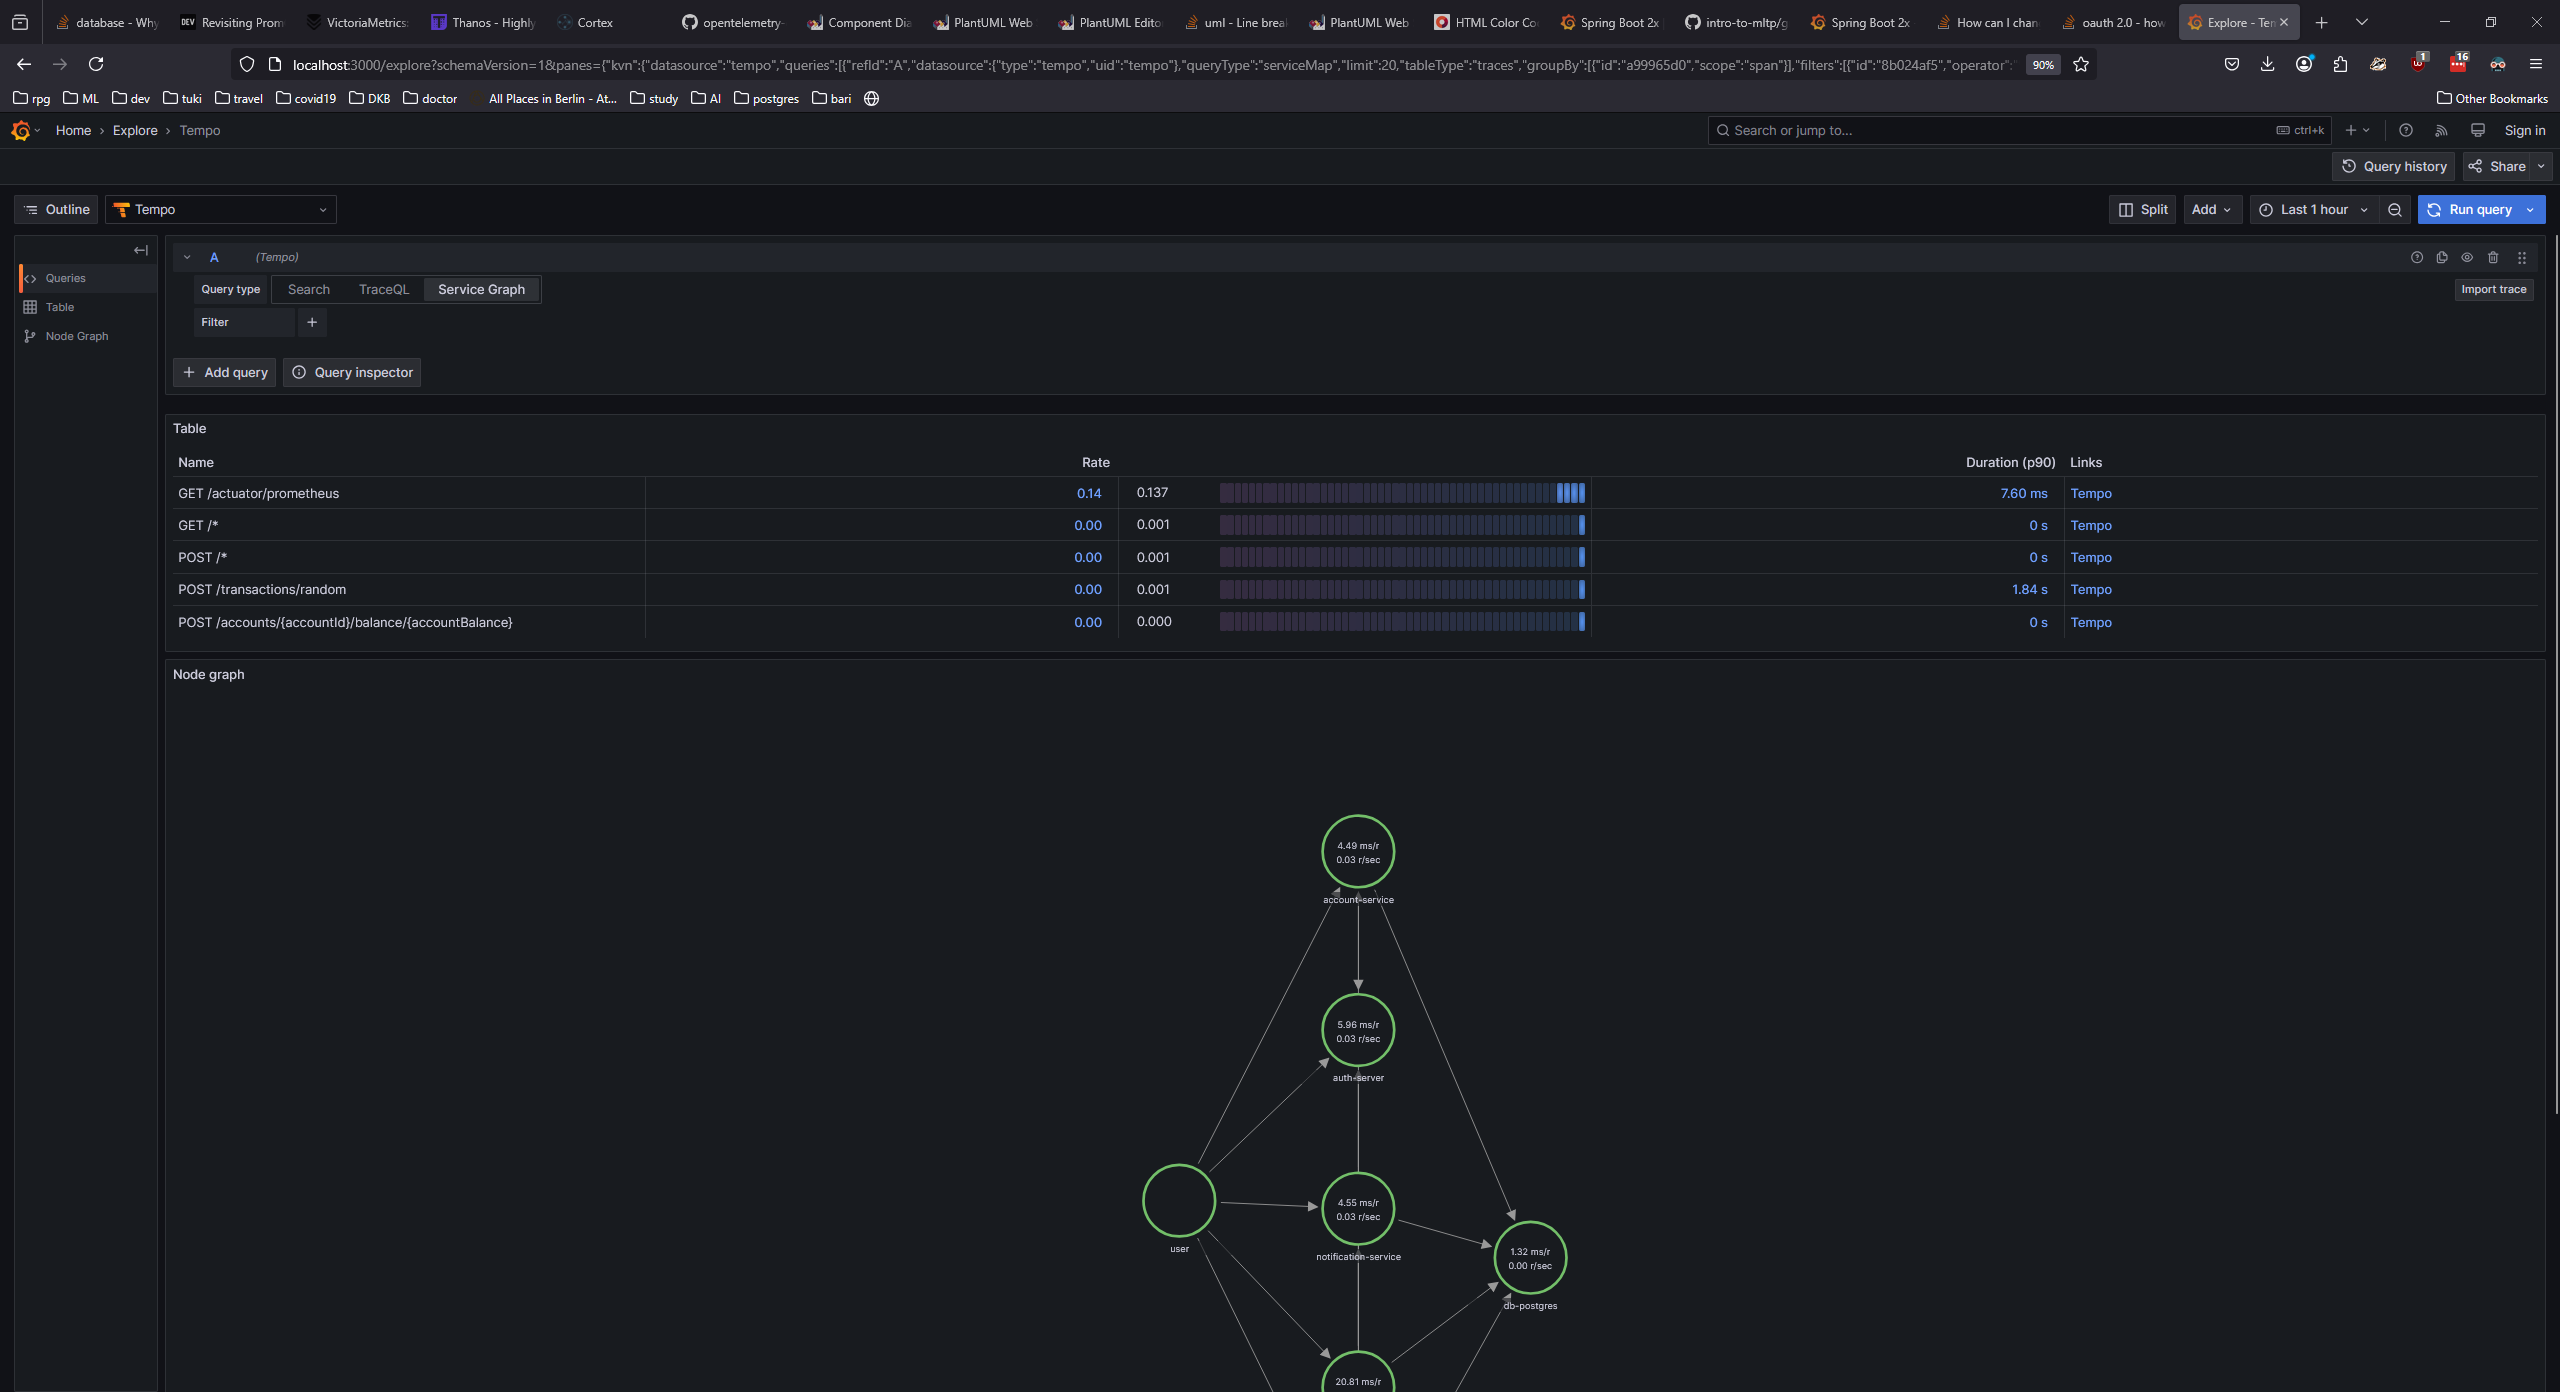
You can also go to the service graph to see the service interactions.

And that's it. We have successfully set up the observability stack for the microservices. We have log aggregation, metrics monitoring, and distributed tracing in place. You can now monitor the logs, metrics, and traces of the services in a single platform.
The final thing left to be done is to use a load testing tool like k6 to generate some load on the services and see the performance impact on the services with and without the observability java agent.
Subscribe to my newsletter
Read articles from Driptaroop Das directly inside your inbox. Subscribe to the newsletter, and don't miss out.
Written by

Driptaroop Das
Driptaroop Das
Self diagnosed nerd 🤓 and avid board gamer 🎲
