Being Quick: Resolve what's dirty.
 Sebastian Sellmair
Part 1 will describe the technical aspects of this story. Part 2 will focus on some aspects that could potentially apply to other teams and projects.
Sometimes finding a solution in O(n²) might be pretty awesome. Sometimes it's a respectable achievement. In my case, it was good enough to get started.
I am talking about the current ‘project firework’ aka. “Compose Hot Reload”. As presented in some internal talks or YouTube videos, the crucial part of implementing Hot Reload is figuring out which parts of your application are dirty after some code was changed. Luckily, Compose is a functional framework, so we mostly care about functions (or some scopes within a function, to be more precise)
For the sake of this blog post, some simplifications will be made:
Let’s accept the fact that Compose Hot Reload has the concept of ‘scopes’ inside functions and a way to identify them. We also assume that Compose Hot Reload knows the entire state of your application before any request to reload classes arrives. Knowing a scope also means knowing a ‘hash code’ of the code inside the scope. As a simplification, you can think of this hash code as the hash of all bytecode instructions. I will present more details on the exact calculation of this hash in some other materials.
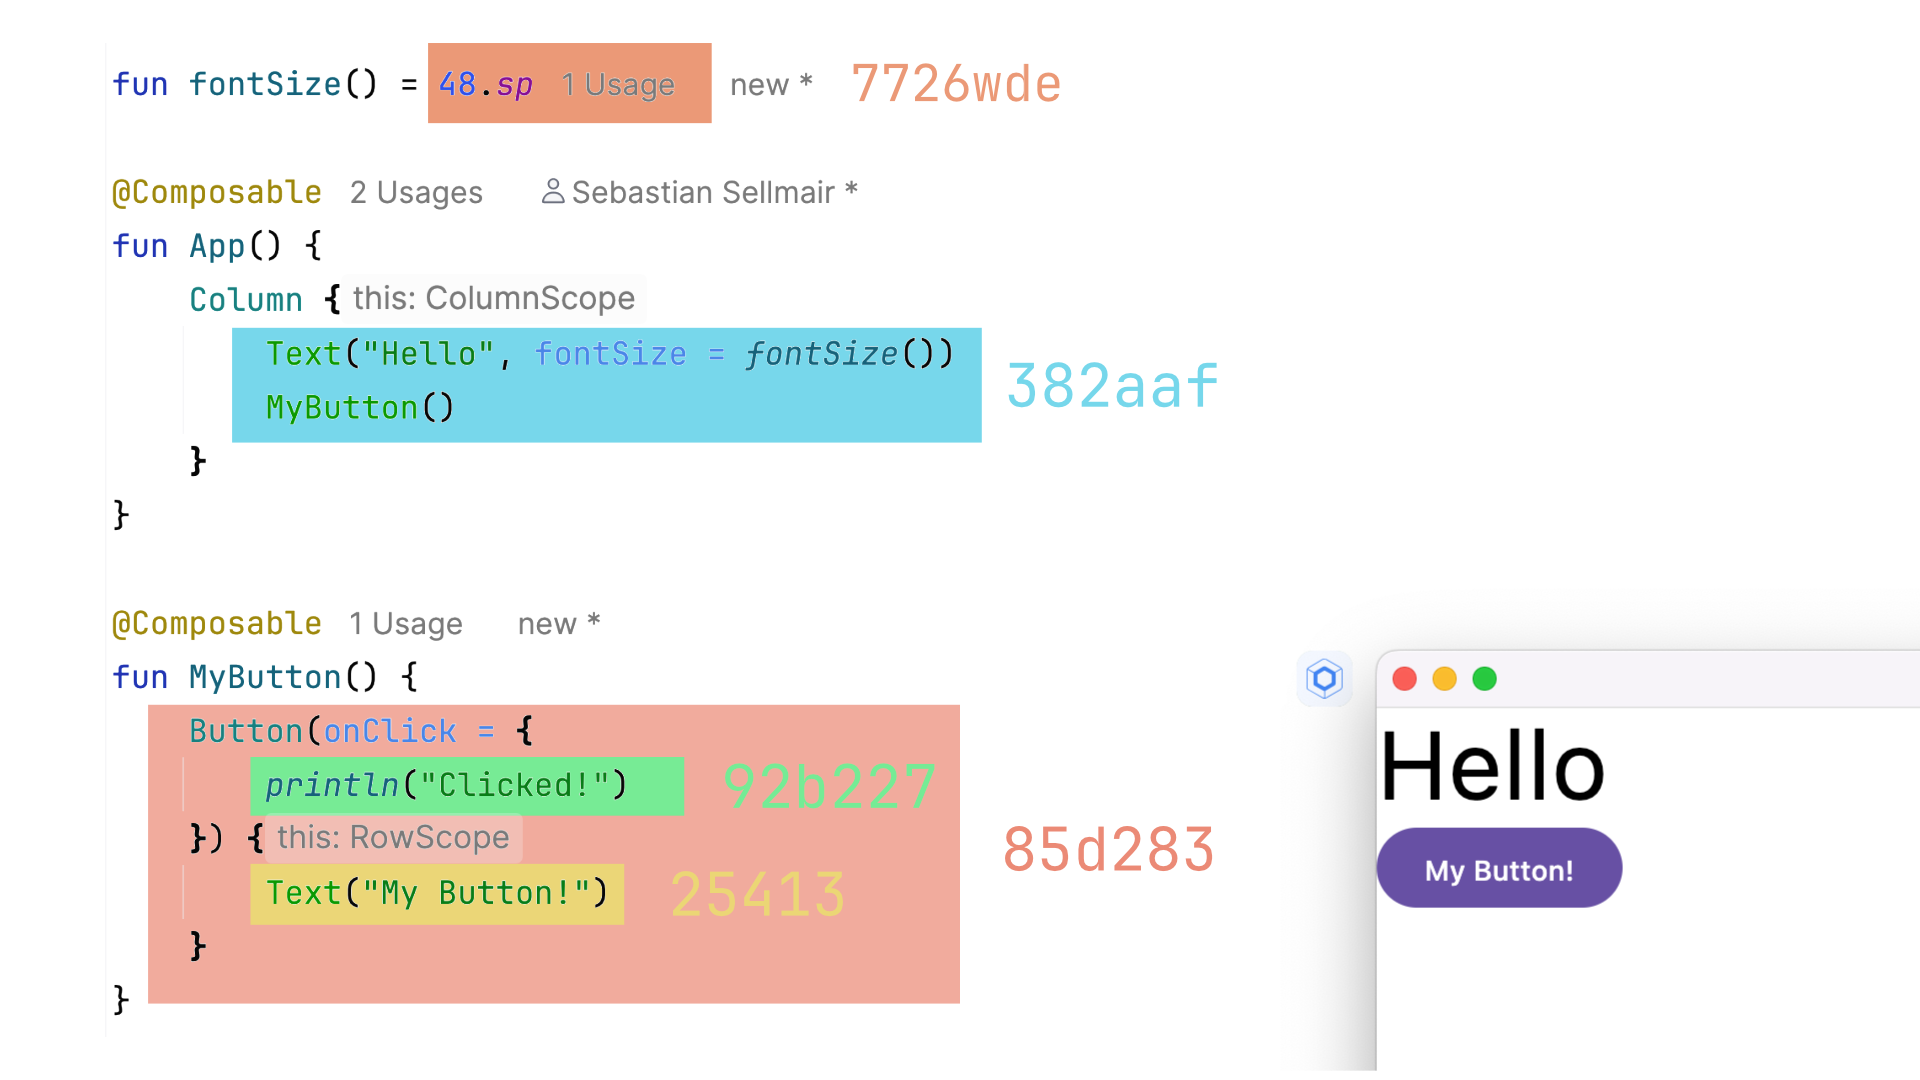
In the image above, you can see an example of the tracked runtime, where each scope gets its associated hash value. Note: The hash value includes only the code of the scope, child scopes are not included! This can then be represented as a tree/graph:
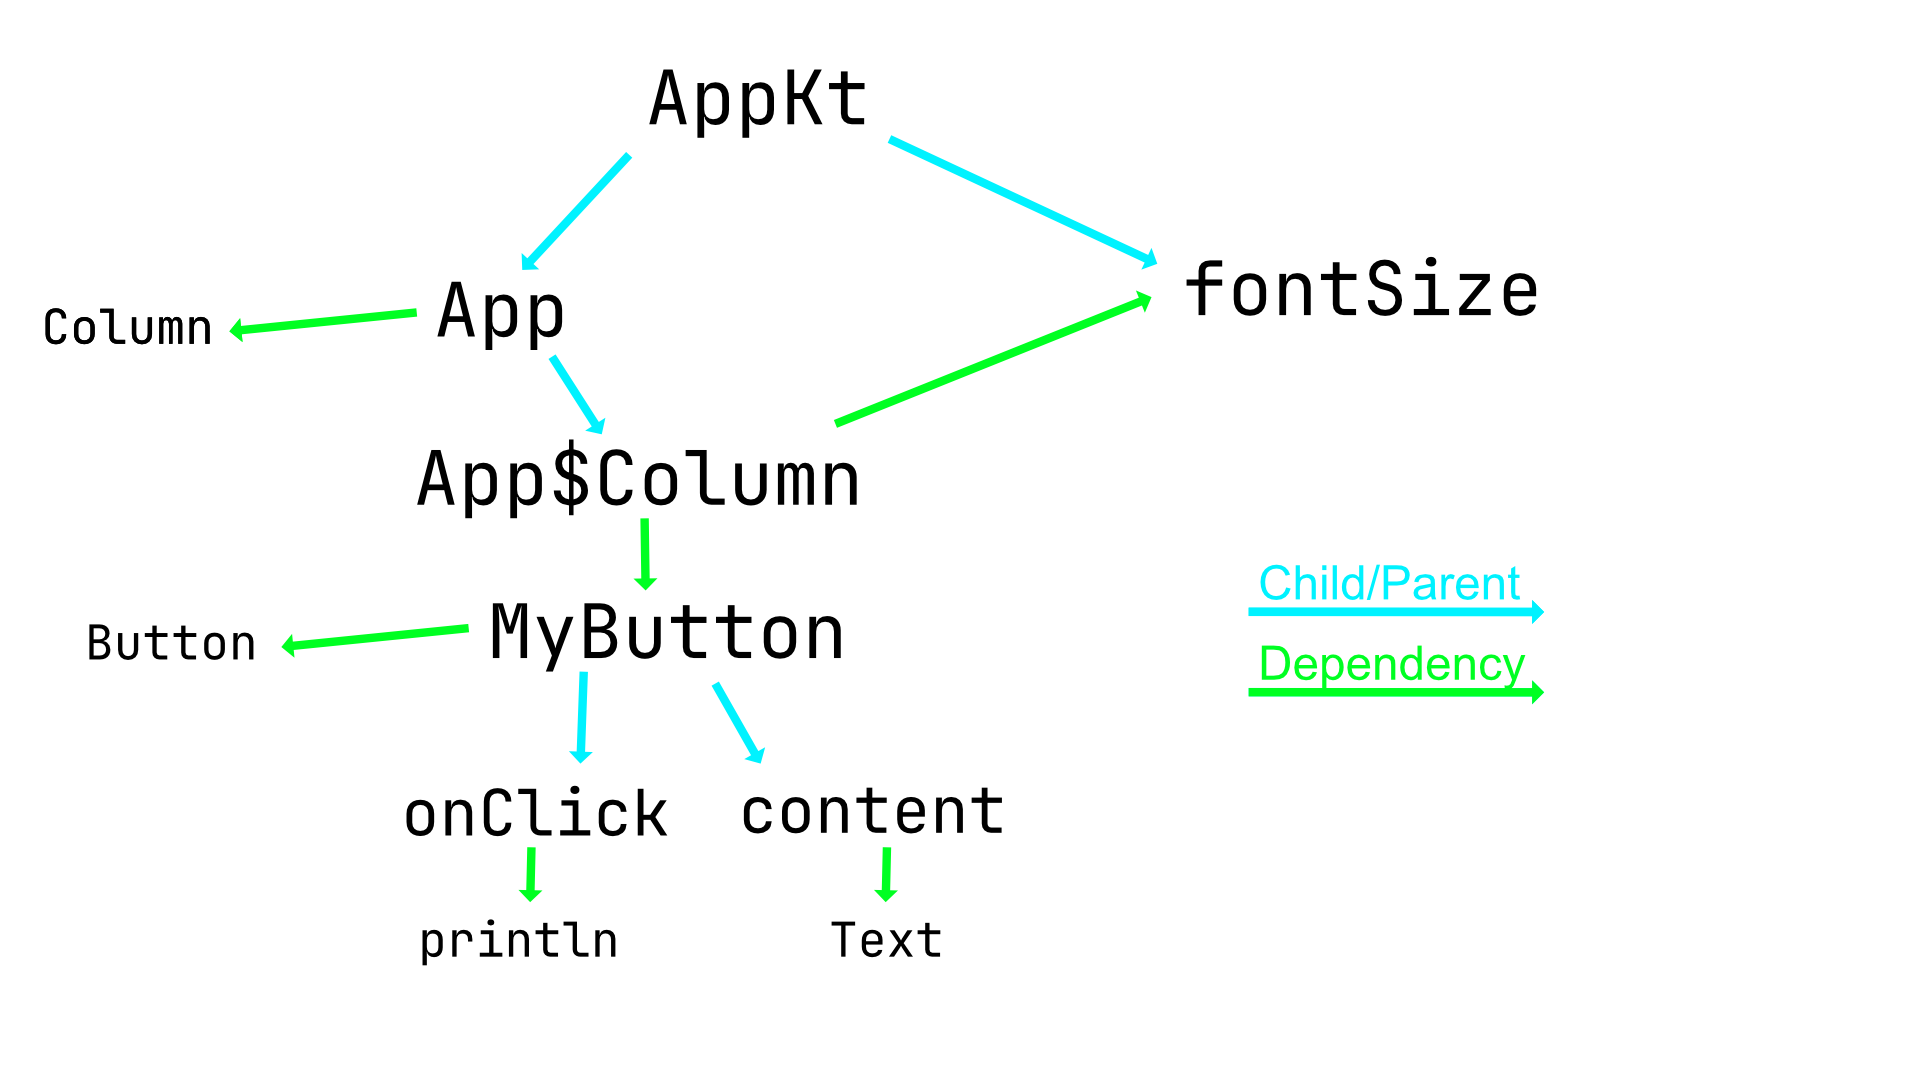
(Those graphics skills are unmatched, I know).
We can represent two kinds of relations: Either one scope is just a child of another scope
Or one scope has an explicit dependency on another scope (e.g. by calling a function).
In the example above, the code calls into other @Composable functions such as Button, Text, or Column as well as some utility function fontSize()
O(n²): good enough, until it is not
So here is how Hot Reload, before 1.0.0-alpha03, figured out which @Composable scopes are ‘dirty’ and have to be invalidated.
The first ‘n’: Number of @Composable functions/scopes
It’s fair to assume that in user-facing applications, the number of @Composable scopes grow linear to the size of the codebase n.
Hot Reload knows the entire state of the runtime before and after the reload happens. We take each known @Composable scope and perform a diffing algorithm. For the sake of this example, let’s assume we do change the fontSize() function to now return 72.sp instead of 48.sp.
As readers, we know that this means that the App$Column scope shall be marked as dirty

This becomes pretty clear when looking at the tracked runtime information presented as a tree:
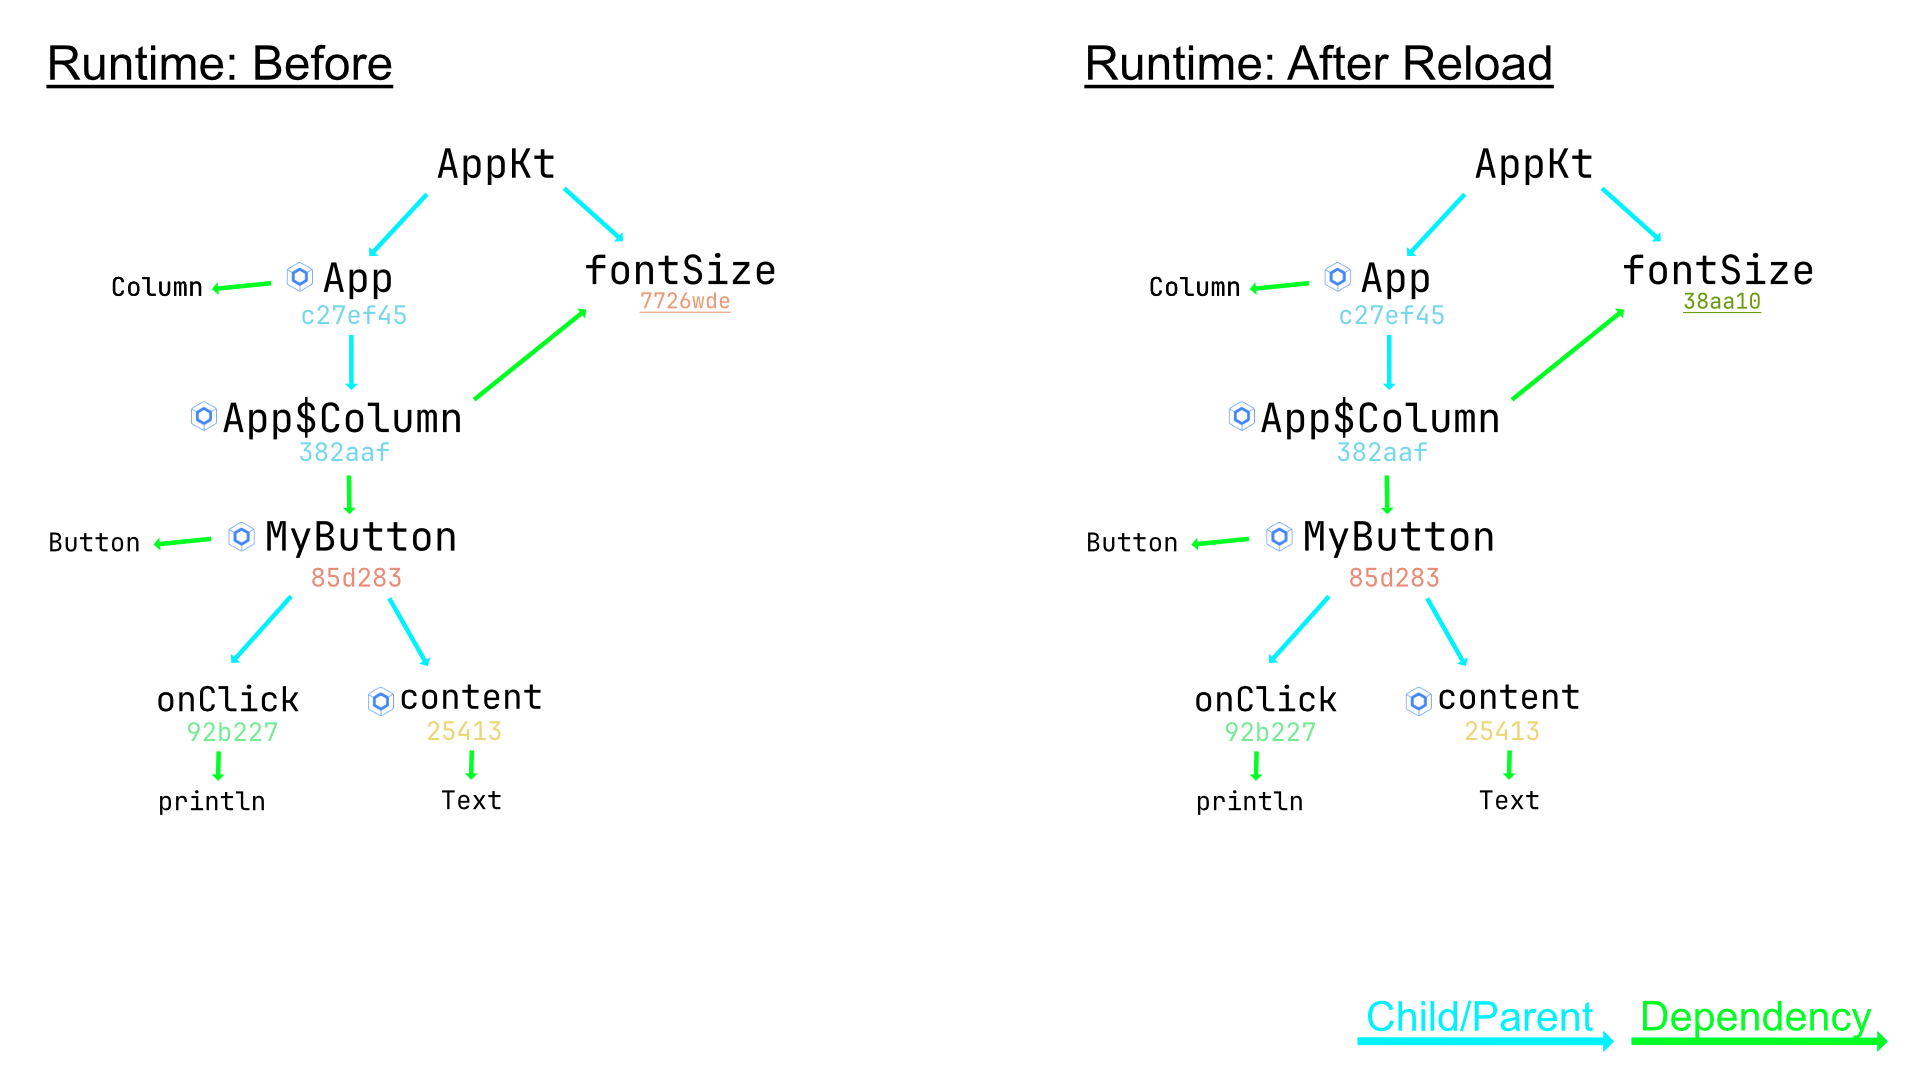
All @Composable scopes are marked with the small Compose logo.
In the example, there are four of them! App, App$Column, MyButton and content. After reloading arbitrary code, any of those scopes could get dirty. There, each scope will be enqueued to check for dirtiness.
But wait, we agreed that the number of @Composable scopes is linearly proportional to the entire codebase in Compose projects. We found the first n 😎
Who is dirty?
Since App$Column calls into the fontSize() function, we know that it has to be marked as dirty, should drop its UI state and re-render. However, we know that keeping the state in other @Composable scopes is totally fine. We can conclude that dirtiness follows only dependency edges and does not cross Child/Parent relationships.
Each scope will now calculate a new hash code, called the “Invalidation Key” by including all transitive dependency scopes. For the sake of simplicity, let’s also assume that dependencies between @Composable functions are also to be ignored.
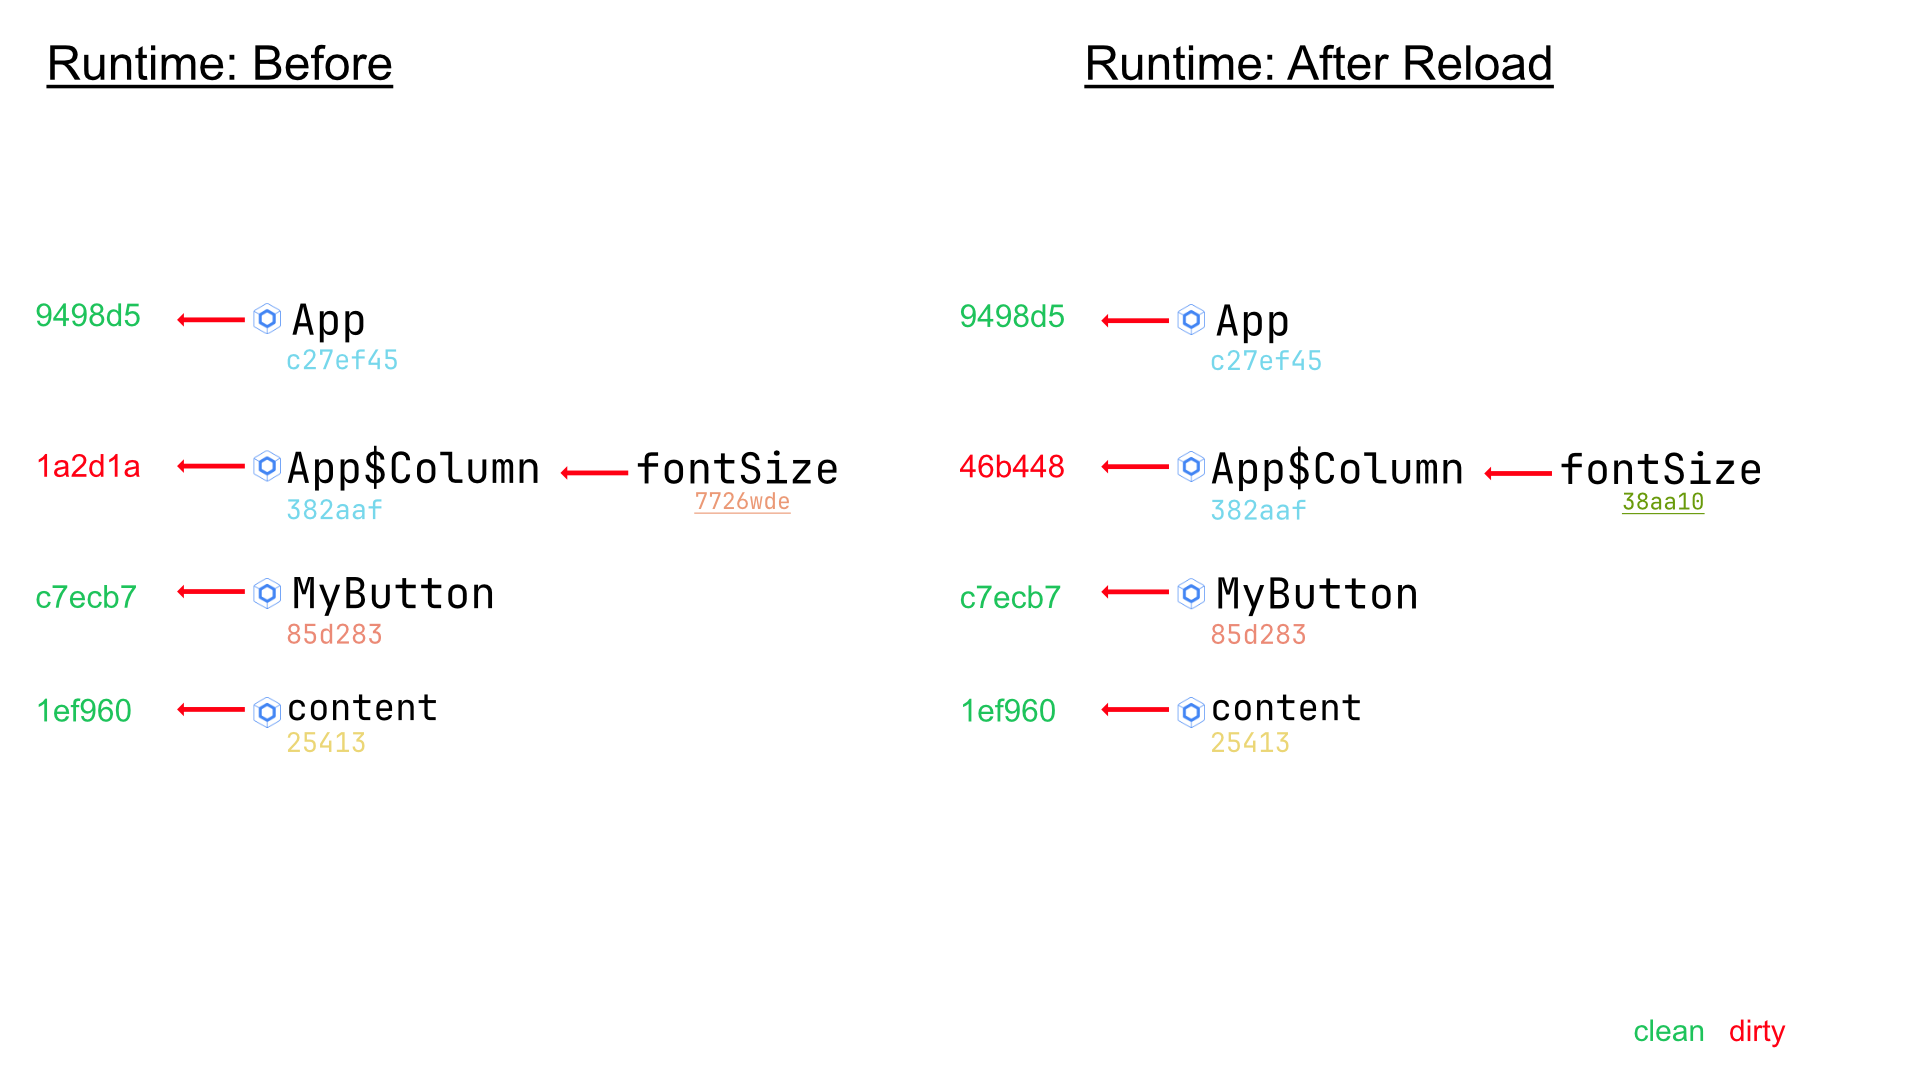
The second ‘n’: Graph traversal
The example above seems easy: Again, for each @Composable scope, we will calculate this new hash code by traversing all transitive dependencies. The above image looks simple and flat because the graph we took as an example is simple: Only a single dependency from Appp$Column to fontSize() which we had to traverse. However, even with this simple code example, the ‘real life’ graph will look much, much more complicated. You see that the fontSize() method also depends on the .sp extension property, the getter of which will bring in more and more dependencies as well.
But how much work will this be for each scope to traverse its dependency graph? Certainly, this depends a lot on the structure of the code and its dependencies. It’s hard to predict how deep the dependency graph will be for each scope. Let’s do a field experiment:
Let’s run a huge application, such as IntelliJ itself, setup Hot Reload, perform a code change, and measure how long the resolution of all scopes will take:
Let’s change a simple String literal and reload: 59ms
Let’s perform some dummy changes in a base module: 53ms
That does not look too bad, right? Unless we realize two things:
When doing the experiment there were only 300
@Composablescopes loaded and the time it will take this algorithm will grow linearly with the number of those. Even having 30K scopes would not be considered a “huge” app and we can expect the algorithm to take ~5s, which is a deal breaker. Note: 30K scopes does not mean 30K@Composablefuncitons. Each function, especially when using control flow, will have multiple child scopes.Those results were only reached by manually disabling one rather important kind of dependency edge:
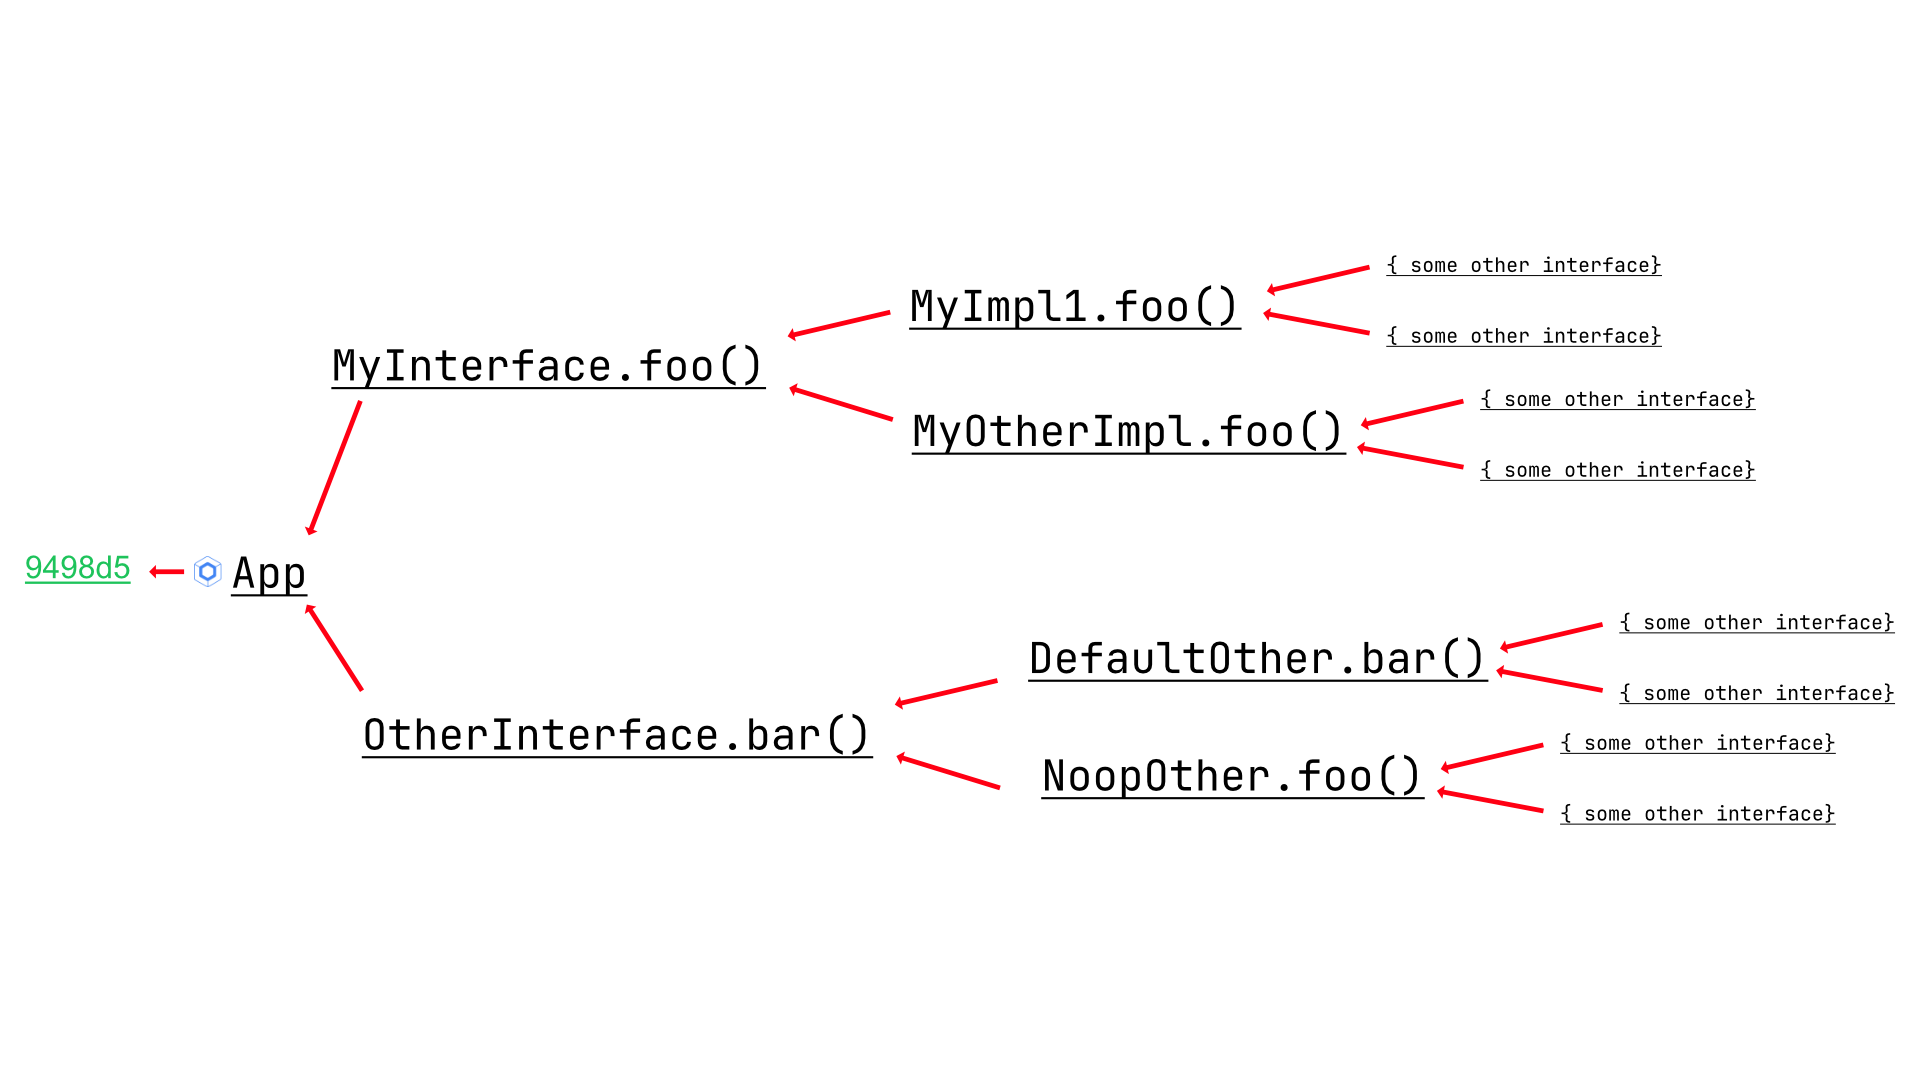
What happens if a function depends on an interface function, or anyopenorabstractfunction for that matter? Then it certainly shall be marked dirty when any of the implementations change. This, however, will bring in many, actually unnecessary nodes in our dependency graph to traverse.
Imagine depending on an interfaceMyInterfaceand it has 100 implementations. You changed one and now all those 99 unnecessary implementations will be part of the dependency graph (and their dependencies as well!). But what happens if those implementations rely on other interfaces with many implementations themselves? This is what I called the ‘super class bomb’. When this happens (and this happens in large projects), then the dependency graph, for each@Composable, is proportional to the size of the code base. Jeez, here we go: We found the secondn, did we?
Let’s re-enable this part of hot reload (virtualMethodResolve) and test IntelliJ changes again:
simple String literal and reload:
I had to cancel this test, because I am impatient as hell. However, my estimate from the progress bar would have been: 225 Minutes 💣🤯some dummy changes in a base module
This one, I was patient enough to wait through: 8m 28 💣 🥺
Note, I was unable to come up with a theory as to why the first ETA is so much higher than the second result. From what we have described about the algorithm, so far, it should not matter where the change is located: We’re doing the same work after all. My best theory is that there might be just one bomb, which takes almost all the time. Maybe If I would have waited just a little bit longer, then we would have seen ~9m as well?
Fighting ‘n’ and ‘n’
The ‘two hashes’ idea, the first hash being only the ‘semantic hash’ of the scope in isolation, the second hash being this ‘invalidation key’ was pretty elegant imho. It served me pretty well in understanding how the system behaved and made it easy to debug. However, we’re certainly doing a lot of work that we do not care about: Who cares about the hash code? All we actually care about is whether or not it has changed or not, right? Equally: When trying to find what is dirty, it seems like the old algorithm was searching for the needle in the haystack… 👀 after throwing it in itself.
See: The runtime knows exactly which classes changed to begin with because the user sent a request to reload a set of particular classes! We know that nothing else could have changed. This information was not used in the algorithm. The direction of following from interfaces to their implementations also is unfavorable. Methods might have many implementations, but we can think of an implementation mostly having one super!
Turnaround: 🎶 Every now and then I get a little bit terrified… 🎤
Let’s build another algorithm, that does not start at the @Composable scopes, but at the classes which the users requested to reload. This number is rather stable (and certainly does not depend on the size of your project, n). We can identify the scopes, inside the ‘to be reloaded’ classes as dirty or not, by comparing their hashes against the previous ones. From here, we do the same walk, but in the inverse direction: We start from what is dirty, find scopes that depend on the dirty scope, mark them as dirty, and repeat!
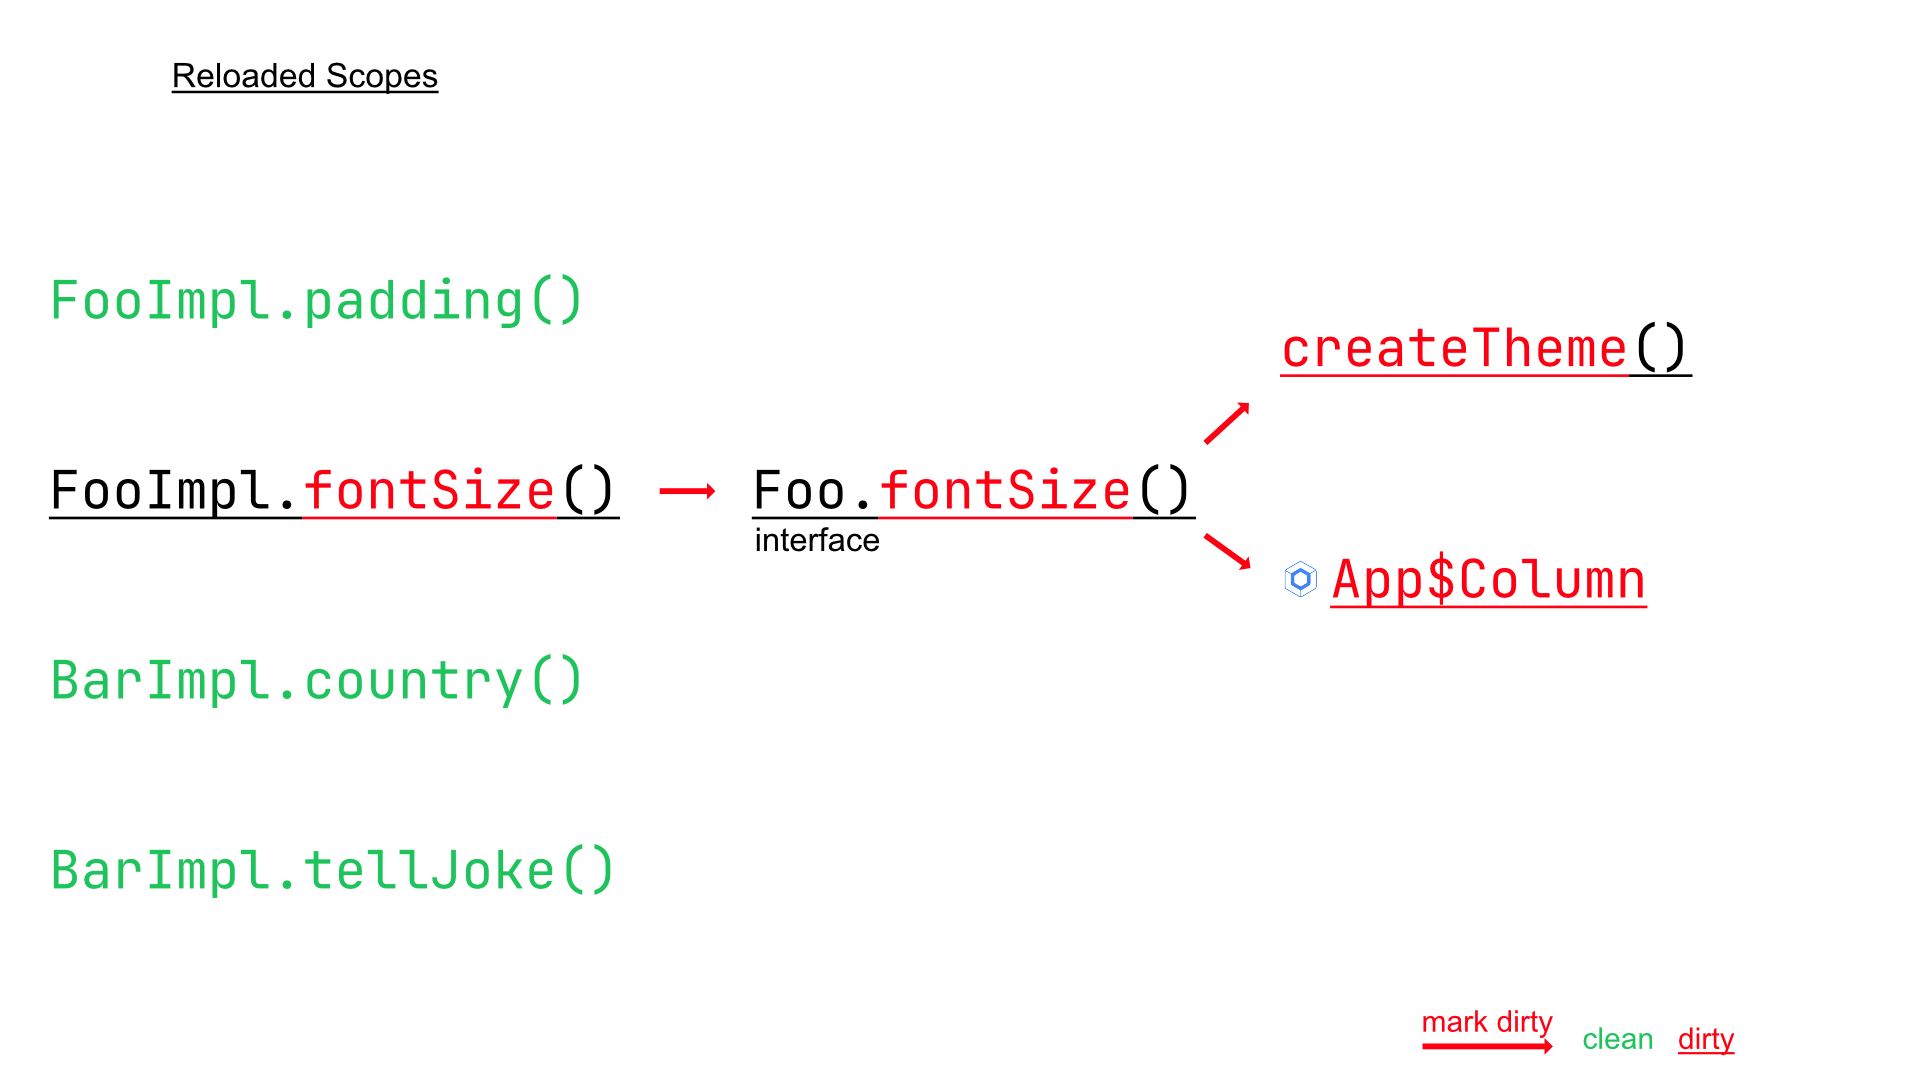
Another crucial difference: Even though we might initially enqueue multiple scopes as ‘dirty’, we still only have to traverse the dependency graph once, instead of doing it for each starting point (previously @Composable scope). One ‘n’ seems to be killed! How about the number of nodes and vertices in this dependency graph? The static dependencies between code stays still the same, however, we drastically reduced the number of edges because of the 1:m relation between super and subclasses! We can straight up follow into the super method and mark it as dirty (compared to walking from one abstract method into all implementations!). This will help significantly, but theoretically, we can still have dependencies inside the code which might require traversing a huge part of the graph!
Turnaround: 🎶 Every now and then I get a little bit nervous … 🎤
Let’s face some emotions: Yes, I am proud that changing an implementation of an interface on which a static field depends, which is used in a @Composable function depends upon will refresh the @Composable . It’s awesome, it’s a nice brag and it makes for cool demos. Simply speaking: I am proud as a developer of how predictable this system would work. But is me being proud of fancy demos really worth following this graph into 15 levels deep? I mean: If the code change did not affect the @Composable scope directly, nor any immediate dependencies of this scope, then it’s pretty fair to say that the state kept in his scope is still OK. No need to invalidate! Therefore, we can stab the remaining potential n by just limiting our ‘mark dirty’ graph walk to a certain depth and calling it a day. We walk 3, 5, and 10 edges: If we have not found any @Composable scope, then fine: Let’s keep it!
Result
There has been a small benchmark written for this composable:
It will compile 1K or 10K synthetic Kotlin source files, which depend on each other, and perform a reload of 10 or 100 classes.

This benchmark at least confirms our suspicion: The number of total classes is irrelevant for this algorithm (first n). If we also accept the fact that during typical development flows the number of classes reloaded is pretty stable and does not depend on n, then we could say that we fully eliminated n: Total number of classes in the project from the equation!
But synthetic benchmarks aside:
Let’s spin up IntelliJ and make the same changes, which previously provoked the ‘super class bomb’!
simple String literal and reload:
previous (ETA) 225 Minutes 💣🤯 → new 500 ussome dummy changes in a base module
previous 8m 28 💣 🥺 → new 18 ms
The new algorithm will be available on 1.0.0-alpha03 , which also reduced the memory footprint of the runtime-tracking significantly.
Subscribe to my newsletter
Read articles from Sebastian Sellmair directly inside your inbox. Subscribe to the newsletter, and don't miss out.
Written by

Sebastian Sellmair
Sebastian Sellmair
Working on Kotlin at JetBrains.