The Role of Excel in Logistics and Transportation Planning for Businesses.
 AKINGBASO GABRIEL BABATUNDE
Introduction.
Efficient logistics and transportation planning are critical components of business success in today’s fast-paced and highly competitive market. Businesses must optimize routes, track shipments, manage inventory, and analyze performance to minimize costs and enhance customer satisfaction. Microsoft Excel, with its versatile analytical and visualization capabilities, continues to be a valuable tool in Business Intelligence (BI) for the logistics and transportation sector.
Excel as a Business Intelligence Tool in Logistics and Transportation.
Business Intelligence (BI) empowers logistics and transportation companies with data-driven insights, and Excel plays a fundamental role in this process. Organizations use Excel to extract, transform, and analyze vast datasets, enabling them to identify patterns and optimize operations. Excel’s compatibility with various data sources, including databases, APIs, and cloud-based solutions, makes it an essential tool for integrating business intelligence into logistics.
Through PivotTables and Power Query, businesses can consolidate shipment data, warehouse reports, and vehicle tracking information to generate insightful dashboards. These capabilities enable managers to make informed decisions regarding route optimization, demand forecasting, and cost reduction strategies. Additionally, Excel’s ability to work with external BI tools, such as Power BI and SQL databases, enhances its role in real-time data analysis and visualization.
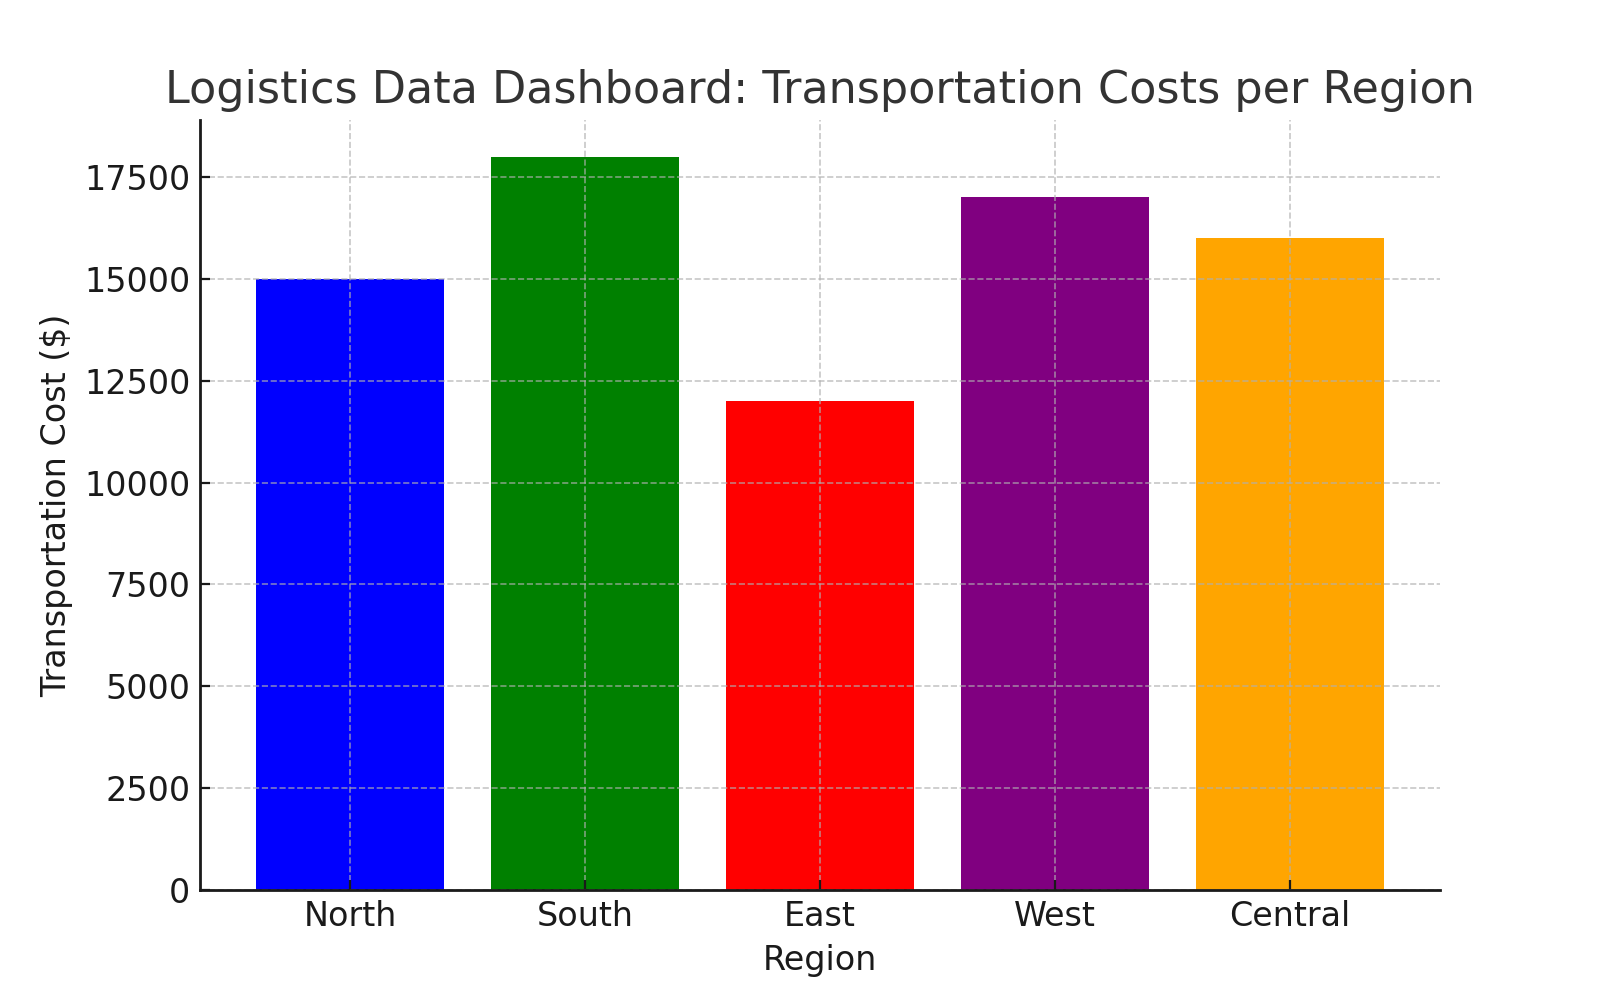
Illustration: Logistics Data Dashboard
A bar chart displaying transportation costs per region, highlighting areas with higher expenses.

Key Features That Make Excel Valuable for Data Analysis in Logistics.
Excel offers a range of advanced features that contribute to efficient logistics and transportation planning. Conditional formatting allows businesses to highlight key performance indicators (KPIs) such as delivery delays, high fuel consumption, or underutilized assets. Functions such as VLOOKUP, INDEX-MATCH, and IF statements facilitate seamless data manipulation, enabling logistics planners to track shipments and inventory with precision.
Advanced charting tools in Excel make it easier to visualize logistics data. Businesses can use heat maps to identify congestion points, bar charts to analyze transportation costs, and trend lines to forecast demand fluctuations. Furthermore, Excel’s Solver and Goal Seek functionalities help logistics professionals determine the most cost-effective delivery routes by solving complex optimization problems.
With Power Pivot, businesses can analyze millions of rows of data, allowing for deeper insights into operational inefficiencies. Excel also supports scenario analysis through data tables and Monte Carlo simulations, enabling companies to predict the impact of fuel price changes, weather disruptions, and seasonal demand variations on transportation costs.
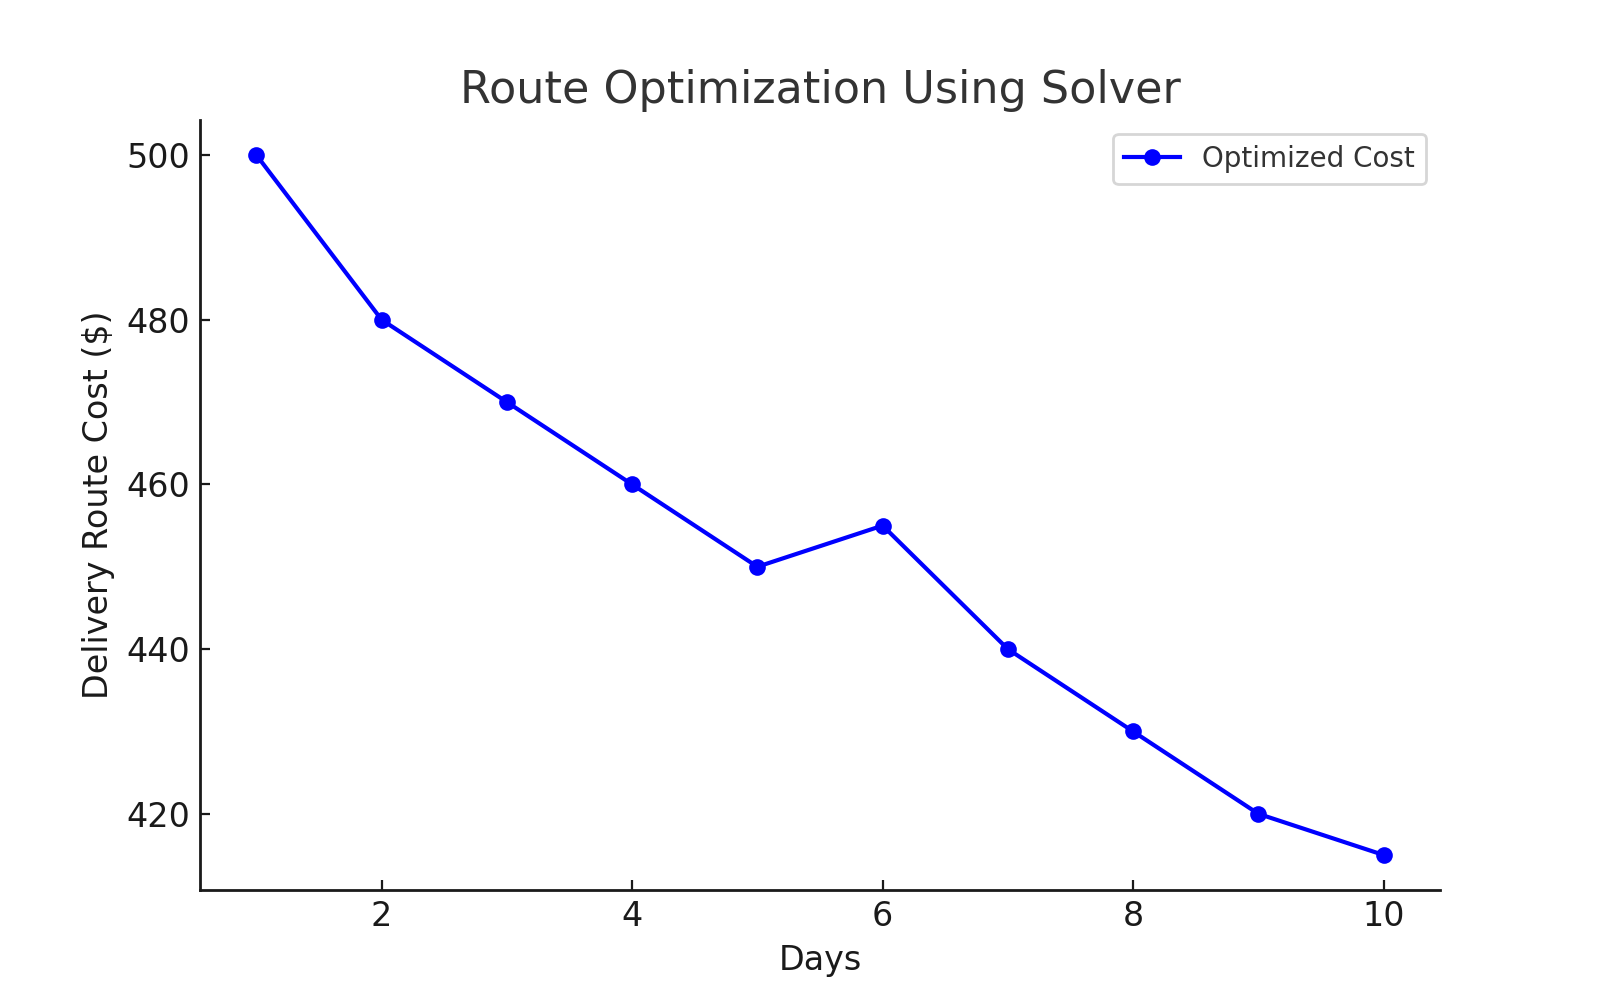
Illustration: Route Optimization Using Solver
A line chart showing optimized delivery routes, minimizing fuel costs and travel time.

Real-World Applications of Excel in Logistics and Transportation Planning.
A leading e-commerce company effectively utilizes Excel to optimize last-mile delivery. By leveraging historical delivery data, they use Excel’s regression analysis to predict delivery times based on traffic conditions and peak hours. This approach helps in reducing delays and improving customer satisfaction.
Similarly, a global supply chain firm integrates Excel with GPS tracking systems to monitor fleet performance. The company consolidates real-time vehicle movement data in Excel dashboards, allowing logistics managers to track fuel efficiency, driver performance, and delivery punctuality. By using Excel’s geospatial mapping capabilities, they identify underperforming routes and adjust logistics strategies accordingly.
Another example is a retail chain that employs Excel for inventory and demand forecasting. By analyzing sales trends and seasonal variations, the company predicts future stock requirements, ensuring that warehouses are adequately stocked while minimizing excess inventory. Excel’s data validation and automation capabilities also help streamline the reordering process, reducing stockouts and overstocking issues.
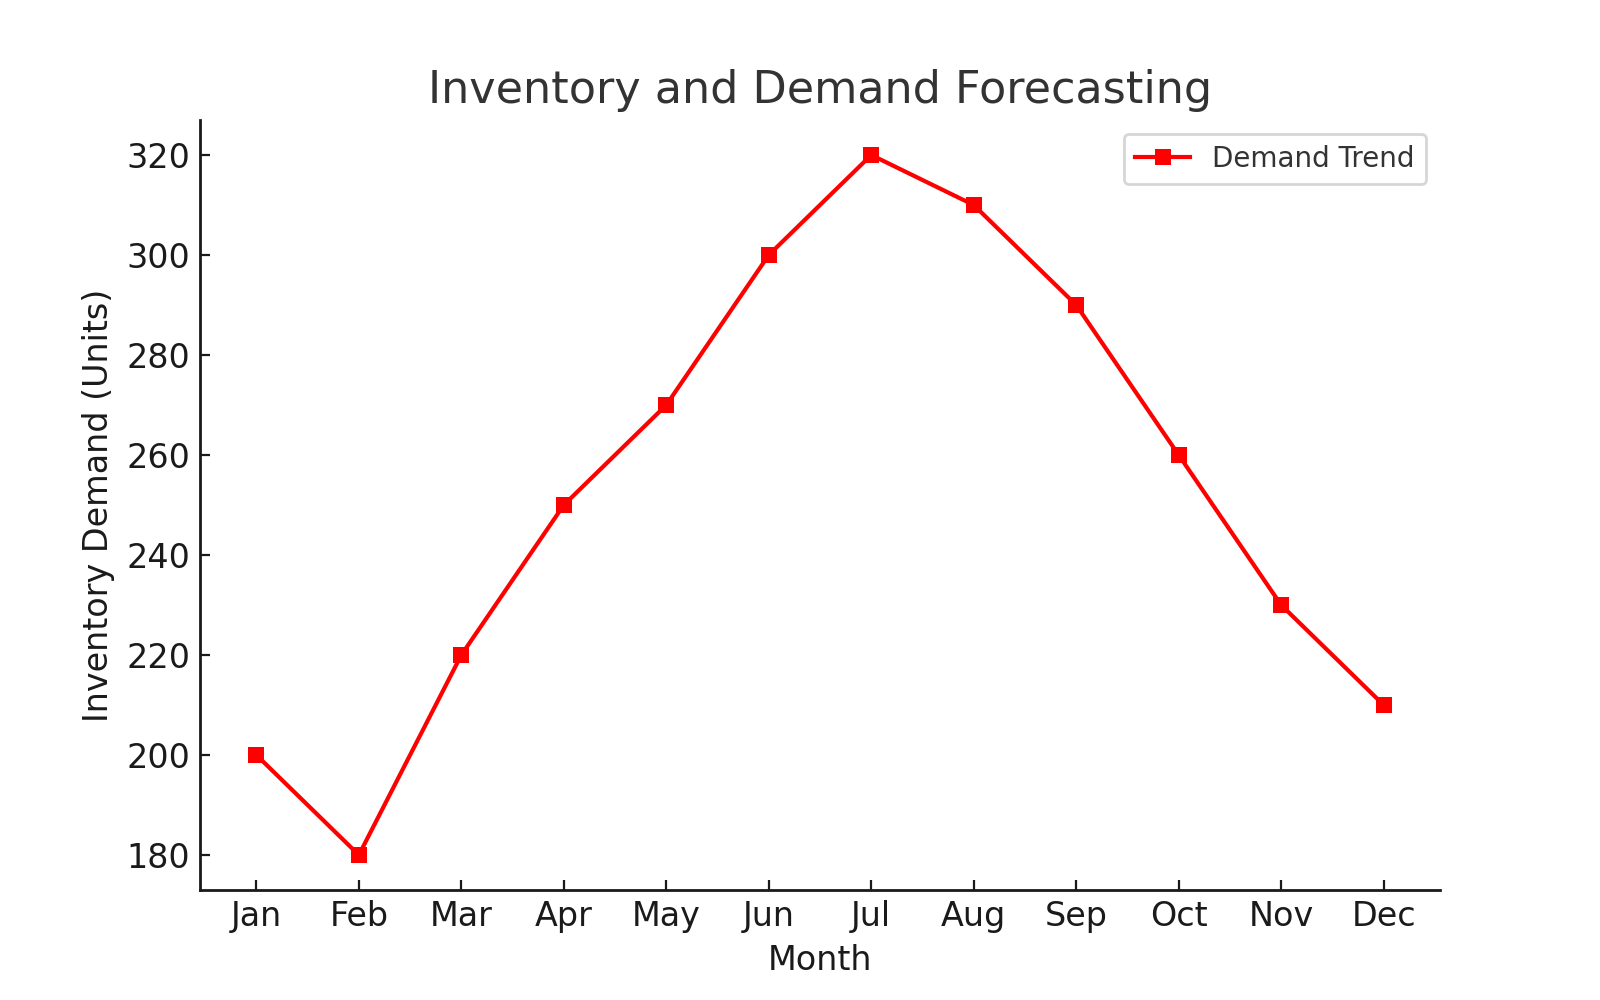
Illustration: Inventory and Demand Forecasting
A line chart illustrating seasonal trends in inventory demand over a 12-month period, highlighting peak sales periods and demand fluctuations.

Industry Trends, Statistics, and the Future of Excel in Logistics.
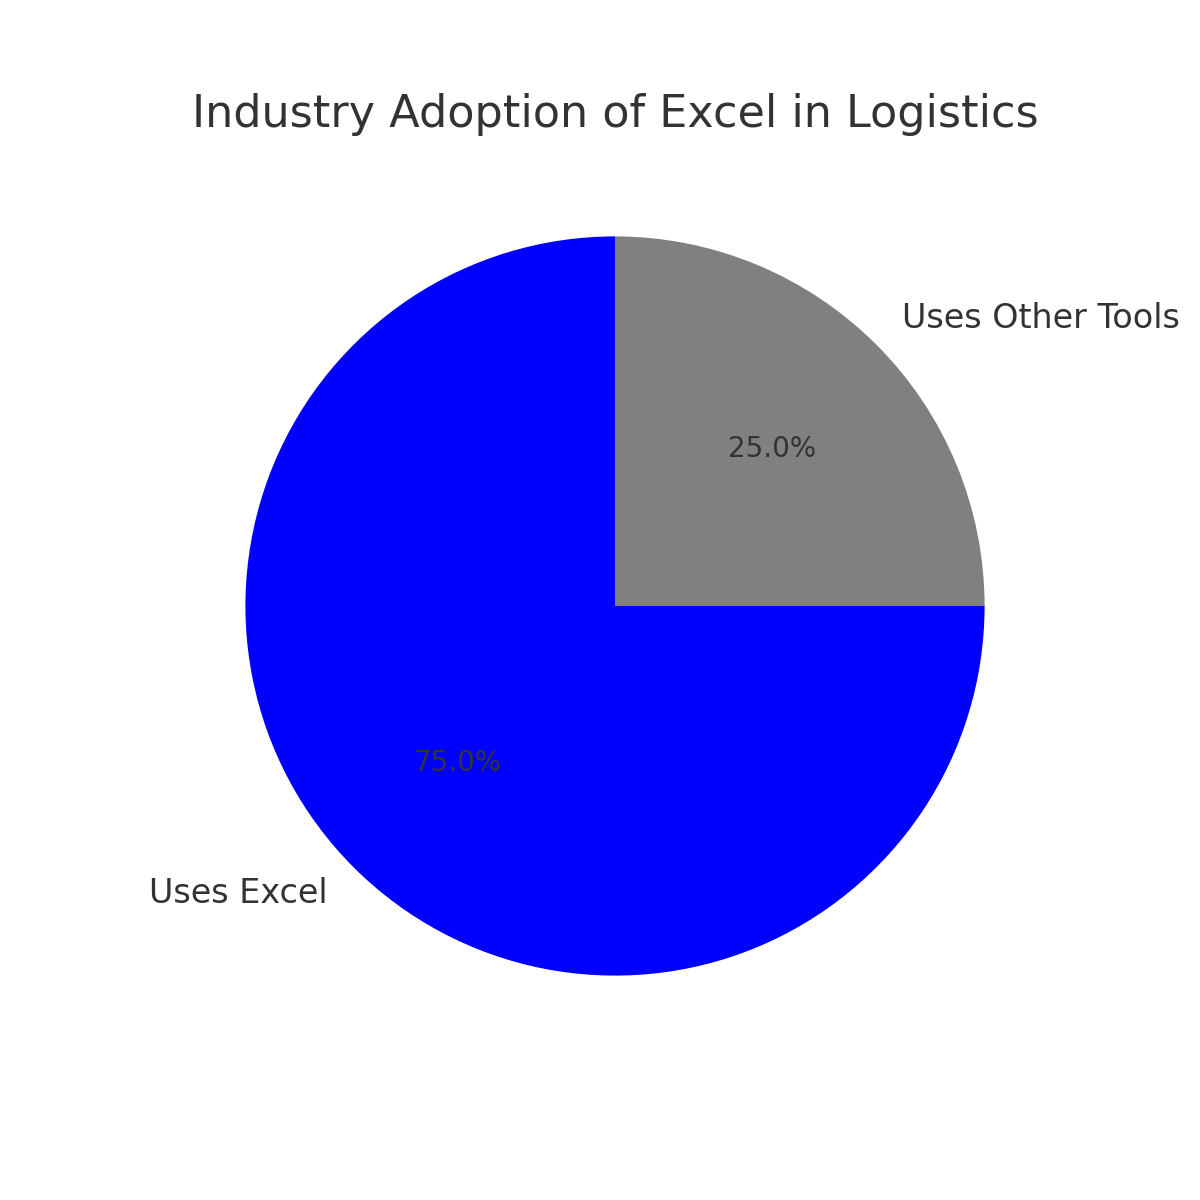
The logistics industry is increasingly becoming data-driven, with digital transformation playing a significant role in improving efficiency. According to industry reports, 75% of logistics firms use spreadsheets for data analysis and reporting. Moreover, with the rise of automation and AI, Excel remains relevant by integrating with AI-powered analytics tools and cloud-based solutions, allowing logistics companies to process data faster and make strategic decisions more effectively.
Recent advancements in Excel, such as dynamic arrays and AI-powered insights, further enhance its usability for logistics. Companies are also incorporating Excel into their Internet of Things (IoT) infrastructure to analyze real-time sensor data from warehouses, vehicles, and distribution centers.
Illustration: Industry Adoption of Excel in Logistics.
A pie chart illustrating the percentage of logistics firms using Excel for data analysis.

Conclusion: The Lasting Impact of Excel on Logistics and Transportation.
Excel continues to play an indispensable role in logistics and transportation planning for businesses worldwide. Its versatility in handling large datasets, performing complex analyses, and visualizing critical logistics metrics ensures that companies can optimize their supply chains efficiently. While new BI tools and AI-powered solutions emerge, Excel remains a foundational element in logistics planning due to its accessibility, adaptability, and integration capabilities. By leveraging Excel’s advanced analytical features, businesses can make data-driven decisions that enhance operational efficiency, reduce costs, and improve overall service delivery in an increasingly digital and fast-moving global economy.
Subscribe to my newsletter
Read articles from AKINGBASO GABRIEL BABATUNDE directly inside your inbox. Subscribe to the newsletter, and don't miss out.
Written by

AKINGBASO GABRIEL BABATUNDE
AKINGBASO GABRIEL BABATUNDE
🚀 Unleashing the Power of Tech, AI & Data! 📊🤖 Hey there! I’m a Data Analyst & Applied Mathematician passionate about making sense of numbers and transforming raw data into powerful insights. With a deep love for Tech, AI & Data, I explore analytics, visualization, and problem-solving to drive innovation. 💡 What You’ll Find Here: 🔹 AI & Machine Learning 🤖 | Data Science 📊 | Tech Trends 🚀 🔹 Business Intelligence 📈 | Data Storytelling 🎨 | Problem-Solving 🧠 💻 My Toolbox: ✅ Microsoft Excel 📊 | Power BI 📈 | PowerPoint 🎤 ✅ MySQL 🛢 | PostgreSQL 🗄 | Python 🐍 ✅ Applied Mathematics 🔢 | Data Visualization 🎨 | Storytelling 📖 Join me on this journey as I decode data, analyze trends, and simplify complex concepts—one post at a time! 🔥📖