Real-Time Elasticsearch-Kibana Logs Monitoring with Microsoft Teams & Slack Alerts
 YOGESH GOWDA G R
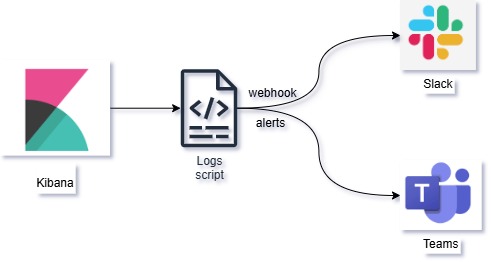
In today's world, it's crucial to monitor your application logs and get alerted about suspicious or critical activities. If you are using Kibana for log monitoring and want to get real-time alerts on Microsoft Teams or Slack, this guide is for you. This script will help you automate log monitoring and send notifications to your desired platform.
Why is this Needed?
When you are monitoring logs from applications, it’s important to be aware of potential security breaches, errors, or unexpected behavior. For example, if your application generates an alert like Elastic-Alert-Critical, you want to be notified immediately so you can take action. This script can be customized to monitor various patterns like Elastic-Alert-High, Elastic-Alert-Medium, etc., based on your requirements.
Prerequisites
Kibana server access to create rules for indexes.
A Kibana instance generating logs at
/var/log/kibana/kibana.logor another location.Microsoft Teams and/or Slack Webhook URL for receiving alerts.
Basic understanding of shell scripting.
Script to Monitor Logs and Send Alerts
Below is the script that monitors your Kibana logs and sends alerts to both Microsoft Teams and Slack. You can choose to remove either part if you only want to use one of them.
#!/bin/bash

# Microsoft Teams Webhook URL
TEAMS_WEBHOOK_URL="https://webltd.webhook.office.com/webhookb2/..."

# Slack Webhook URL
SLACK_WEBHOOK_URL="https://hooks.slack.com/services/XXXXX/XXXXX/XXXXX"

# Log file to monitor
LOG_FILE="/var/log/kibana/kibana.log"

# Function to send message to Microsoft Teams
send_to_teams() {
    local message=$1

    escaped_message=$(echo "$message" | sed 's/\\/\\\\/g' | sed 's/"/\\"/g')

    local payload=$(cat <<EOF
{
    "@type": "MessageCard",
    "@context": "http://schema.org/extensions",
    "summary": "Log Alert",
    "themeColor": "0076D7",
    "title": "Kibana-Alert from prod",
    "text": "$escaped_message"
}
EOF
)

    curl -H "Content-Type: application/json" -d "$payload" $TEAMS_WEBHOOK_URL
}

# Function to send message to Slack
send_to_slack() {
    local message=$1

    local payload=$(cat <<EOF
{
    "text": "$message"
}
EOF
)

    curl -X POST -H "Content-Type: application/json" -d "$payload" $SLACK_WEBHOOK_URL
}

# Monitor log file for patterns

tail -F "$LOG_FILE" | grep --line-buffered -E "Elastic-Alert|Elastic-Alert-Critical|Elastic-Alert-High|Elastic-Alert-Medium" | while read line
    do
        send_to_teams "$line"
        send_to_slack "$line"
    done
Explanation
The script continuously monitors the Kibana log file using
tail -Fand filters lines containing patterns likeElastic-Alert,Elastic-Alert-Critical, etc.It sends notifications to both Microsoft Teams and Slack by making
curlrequests with formatted messages.You can easily customize this to look for other patterns or integrate other tools.
Modify the script to send only Elastic-Alert-Critical to Slack
tail -F "$LOG_FILE" | grep --line-buffered -E "Elastic-Alert-Critical" | while read line
    do
         send_to_slack "$line"
    done
Creating a Background Service
If you want this script to run continuously, even after a reboot, you can create a systemd service.
sudo vim /etc/systemd/system/kibana-alert.service
Add the following content:
[Unit]
Description=Kibana Log Monitoring Service
After=network.target

[Service]
ExecStart=/bin/bash /path/to/your-script.sh
Restart=always

[Install]
WantedBy=multi-user.target
Enable and Start the Service
sudo systemctl daemon-reload
sudo systemctl enable kibana-alert.service
sudo systemctl start kibana-alert.service
Checking Service Status
sudo systemctl status kibana-alert.service
Customization Tips
If you only want to use Microsoft Teams or Slack, simply remove the corresponding part of the script.
For example, if you want to match other critical tags like
Elastic-Alert-Critical, just add them to thegrepcommand as shown above.
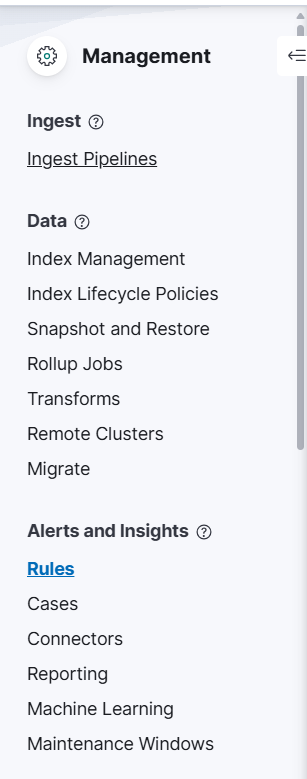
Steps to Add Rules in Kibana Server UI
Log in to Kibana
Open your browser and go to the Kibana URL (e.g.,http://localhost:5601).Navigate to Stack Management
Click on the menu icon (☰) in the top-left corner.
Go to "Stack Management" under the "Management" section.

Create Detection Rules
Click on "Alerts and Insights".
Go to "Rules".
Create a New Rule
Click the "Create new rule" button.
Choose the type of rule you want to create. For example:
"Custom Query" if you want to search logs with specific keywords like
Elastic-AlertorElastic-Alert-Critical."Threshold" if you want alerts triggered when specific conditions are met.
I am selecting
Elasticsearch query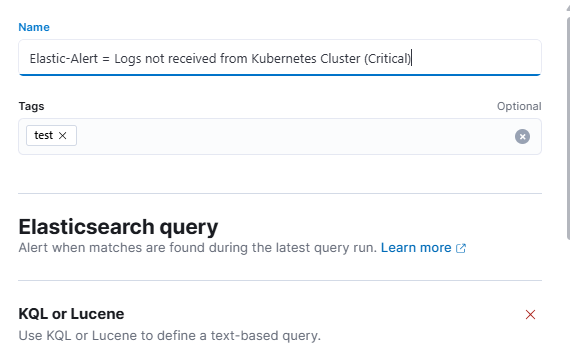
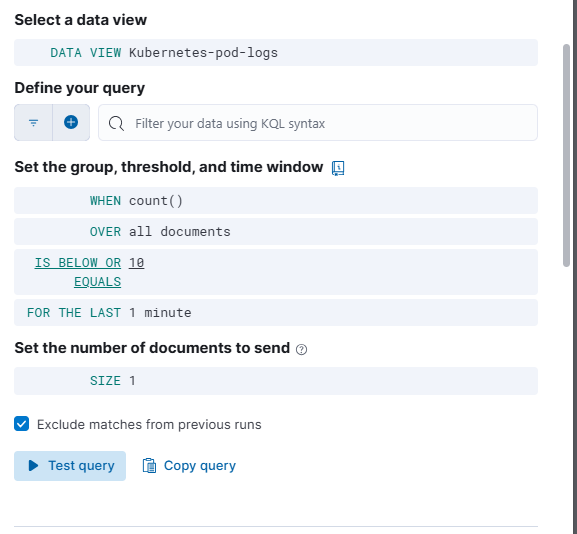
Define the Rule
Rule Name: Give your rule a meaningful name, like
Elastic-Alert-Detection.Index pattern: Select your Kibana index pattern, usually
filebeat-*orlogstash-*.
Custom Query: Add your query, e.g.,
kqlCopyEditmessage: "Elastic-Alert" OR message: "Elastic-Alert-Critical"Rule Schedule: Set how often the rule will check for alerts (e.g., every 1 minute).
Set Up Actions (Optional)
You can add actions to trigger when a rule matches.
For example, you can send notifications to an email, webhook, or other services.
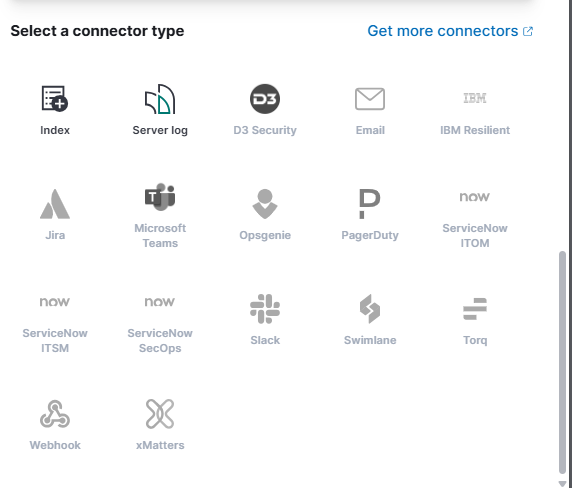
Select the connector type.
Select the connector type as Server log.
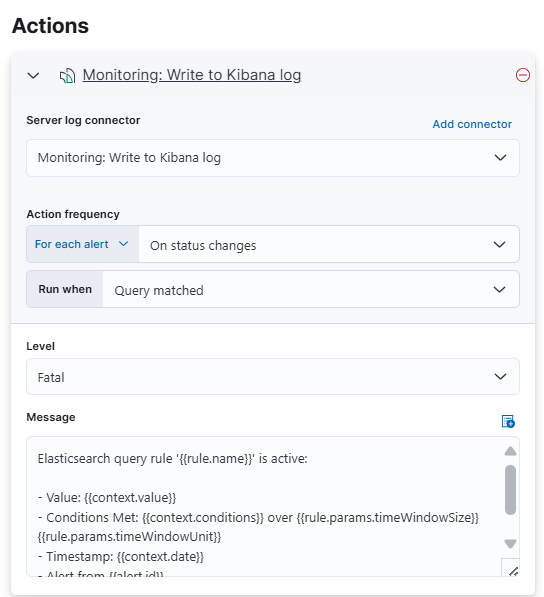
Review and Create
- Review your configuration and click on "Create rule".
Monitor and Test
Go to "Detections & Alerts" to monitor triggered alerts.
Test by generating logs with the keywords you set in the rule.
Feel free to copy this script and make changes according to your requirements. If you face any issues or need help setting this up, drop a comment below! 😊
Useful Links
Subscribe to my newsletter
Read articles from YOGESH GOWDA G R directly inside your inbox. Subscribe to the newsletter, and don't miss out.
Written by

YOGESH GOWDA G R
YOGESH GOWDA G R
As a passionate DevOps Engineer with 3+ years of experience, I specialize in building robust, scalable, and secure infrastructures. My expertise spans Kubernetes, Jenkins, Docker, AWS, Ansible, Flask, Apache, Nginx, Kibana, Uyuni, Percona PMM, MySQL, and more.