Unlocking Customer Insights: How Clustering Helps Banks Target the Right Customers
 Alok Gupta
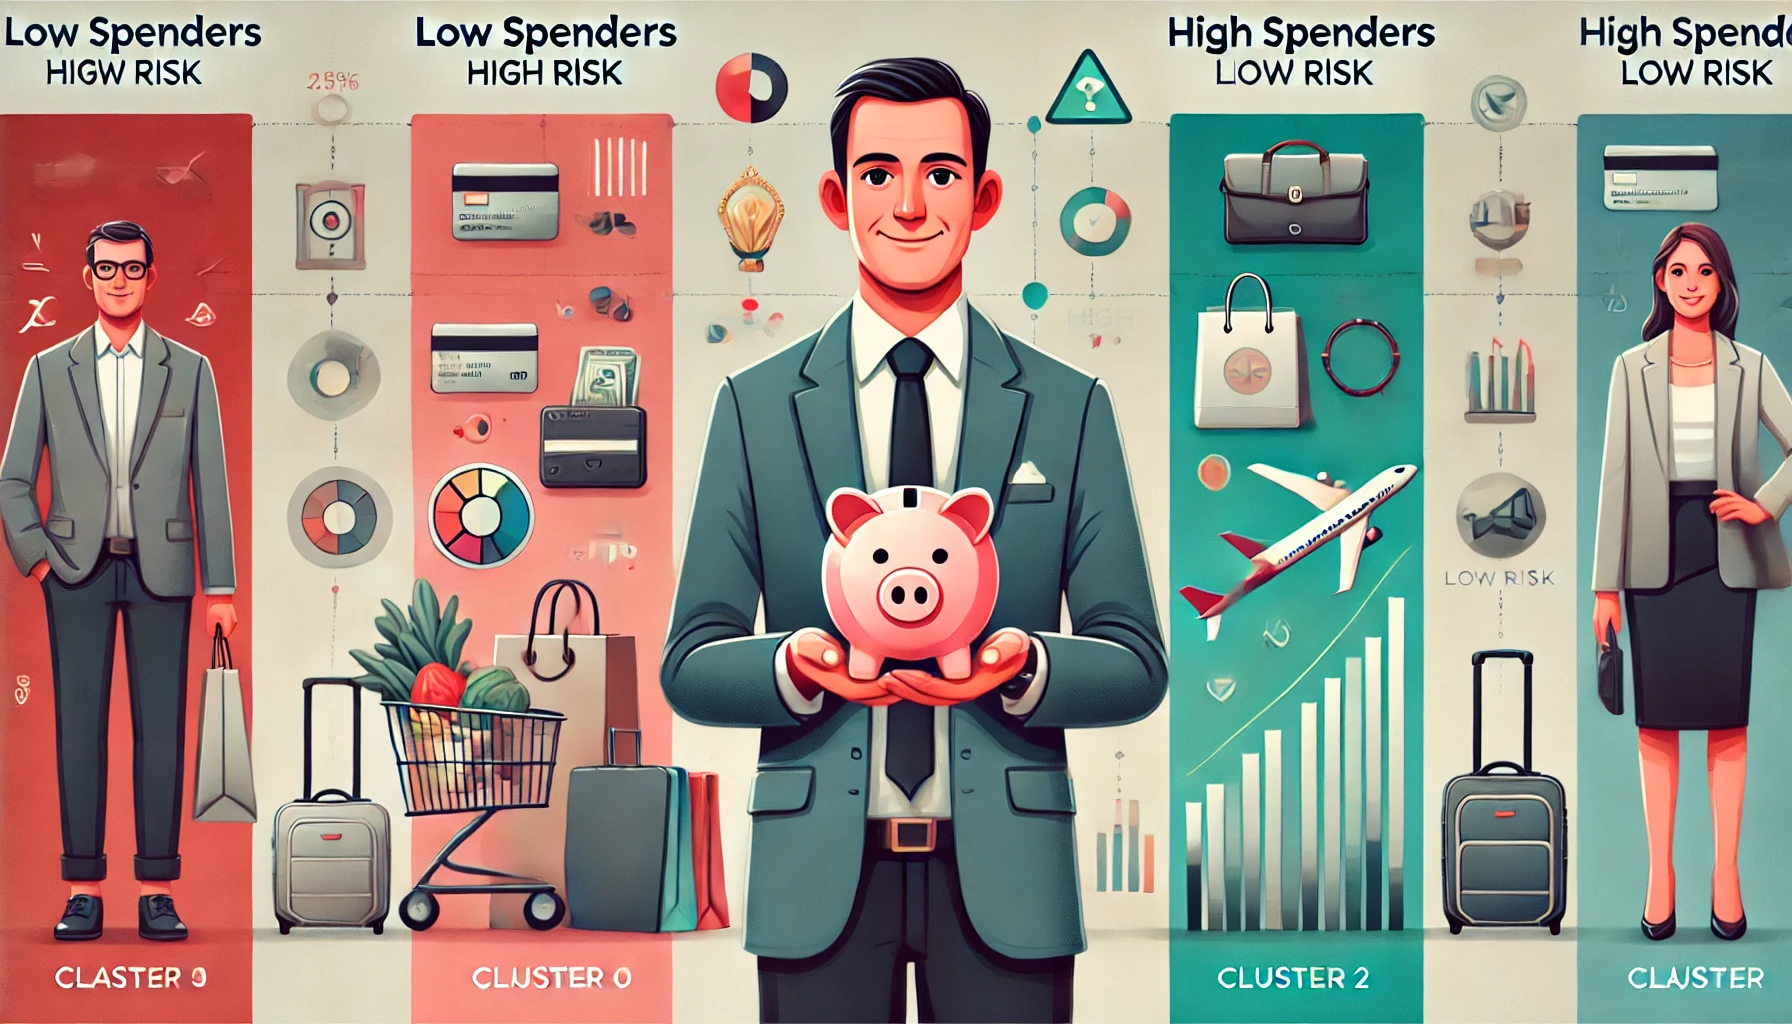
Introduction: Why Clustering Matters for Banks
Hey there, data science enthusiasts! Imagine you’re running a bank and need to decide which customers to target with a premium credit card offer versus a budget-friendly loan scheme. How do you make that call? As a data science lover who enjoys blogging, I recently worked on a fascinating task called "Bank Data Clustering", where I used clustering techniques to help a bank segment its customers for smarter marketing. In this blog, I’ll take you through the project, break down the concepts with a real-life example, and show how clustering can transform banking strategies—whether you’re in a bustling city or a small town.
Let’s set the scene with an example from Bengaluru, India, where I live. Meet Anjali, a tech professional from Whitefield who loves splurging on gadgets at VR Bengaluru, and Rahul, a small business owner in Koramangala who’s more cautious with his spending, often sticking to essentials at local stores. A bank wants to tailor its offers for both—maybe a premium credit card for Anjali and a budget-friendly loan for Rahul. But how does the bank figure out who’s who? That’s where clustering comes in! In this project, I analyzed a dataset of 210 bank customers, focusing on their spending habits, credit limits, and payment behaviors. Using clustering techniques like hierarchical and K-means clustering, I grouped these customers into distinct segments. Let’s dive into the journey and see how data science can make banking more personalized.
Step 1: Understanding the Data with Exploratory Data Analysis (EDA)
What We Did:
The first step in any data science project is to explore the data. I had a dataset with 210 customers and 7 variables:
spending: Amount spent per month (in 1000s of dollars, but let’s think in INR—multiply by 83 for a rough conversion to rupees).
advance_payments: Cash paid in advance (in 100s).
probability_of_full_payment: Likelihood of paying the full credit card bill.
current_balance: Balance left in the account (in 1000s).
credit_limit: Credit card limit (in 10000s).
min_payment_amt: Minimum payment made monthly (in 100s).
max_spent_in_single_shopping: Maximum amount spent in one purchase (in 1000s).
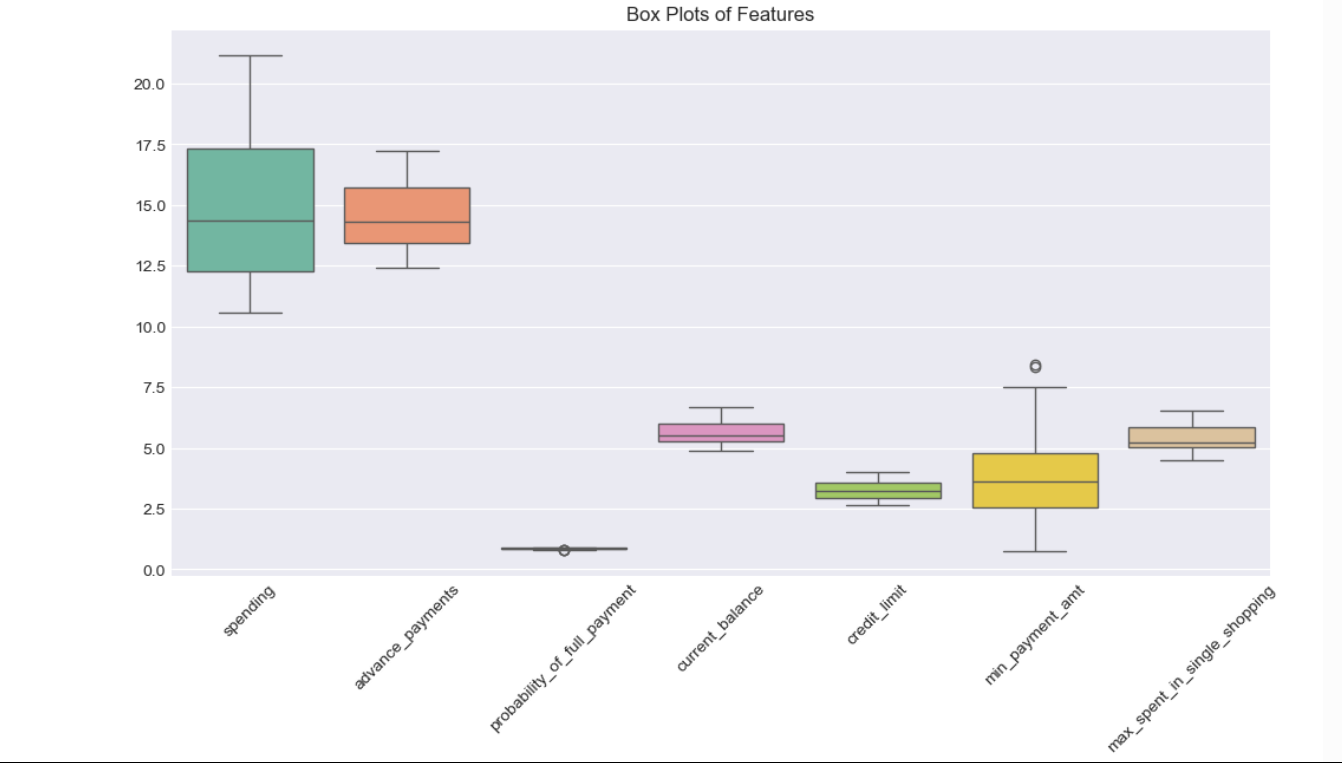
I started with Exploratory Data Analysis (EDA) to uncover patterns. I checked for missing values (none - great!), summarized the data, and looked for outliers using box plots. I also plotted distributions of each variable and checked correlations using pair plots and heatmaps.
Key Insights
The average monthly spending was 14.85 (around ₹12.33 lakh in INR), with some customers spending as high as ₹17.58 lakh.
The probability_of_full_payment averaged at 0.87, meaning most customers are reliable payers.
I found strong correlations between variables like spending and credit_limit (0.97), but min_payment_amt was negatively correlated with probability_of_full_payment (-0.33). This suggests that customers with higher minimum payments are less likely to clear their dues fully.
Real-Life Connection
Think of Anjali and Rahul from our example. Anjali might be spending around ₹15 lakh monthly (converted from the dataset’s 18.37), with a high credit limit and a good track record of paying her bills. Rahul, on the other hand, might spend only ₹9.8 lakh (converted from 11.87) and struggle with higher minimum payments, making him less likely to pay his full bill. EDA helps the bank spot these differences early- Anjali could be a prime candidate for a premium offer, while Rahul might need a more affordable one.
Step 2: Why Scaling the Data Is Crucial
What We Did:
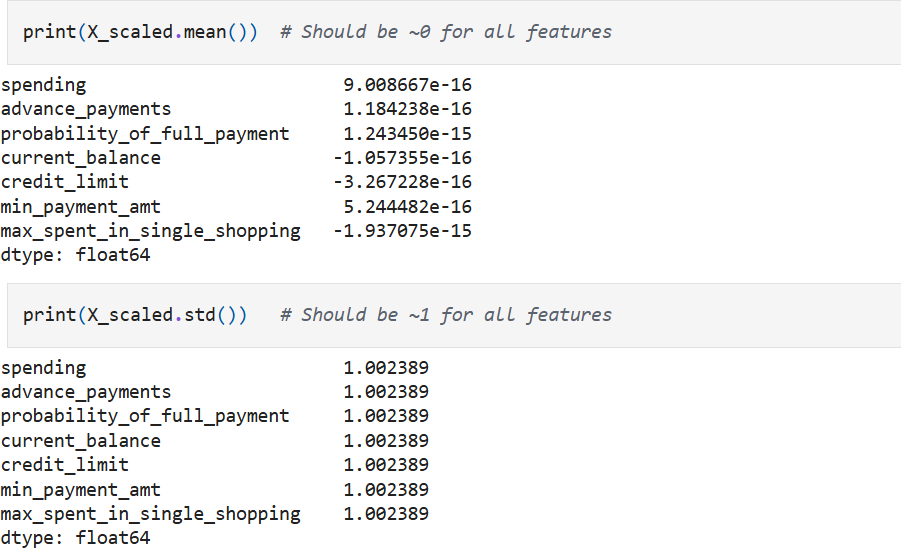
Before clustering, I scaled the data using StandardScaler from Python’s sklearn library.
# Importing StandardScaler
from sklearn.preprocessing import StandardScaler

# Extract features (all columns)
X = df

# Scale the data
scaler = StandardScaler()
X_scaled = scaler.fit_transform(X)

# Convert back to DataFrame for easier handling (optional)
X_scaled = pd.DataFrame(X_scaled, columns=X.columns)
This step ensures all variables are on the same scale (mean = 0, standard deviation = 1).
Why It Matters
Clustering algorithms like K-means and hierarchical clustering rely on calculating distances between data points. If the data isn’t scaled, variables with larger ranges (like spending, ranging from 10.59 to 21.18) would dominate over smaller ones (like probability_of_full_payment, ranging from 0.81 to 0.92). Scaling ensures fairness—every variable gets an equal say in forming clusters.
Real-Life Connection
Imagine a bank trying to group its customers without scaling. Anjali’s high spending might make her seem “farther” from Rahul in the data, even if their payment behaviors are similar in other ways. Scaling ensures the bank focuses on meaningful patterns—like whether both are reliable payers—rather than just their spending amounts.
Step 3: Hierarchical Clustering—Finding Patterns the Traditional Way
What We Did:
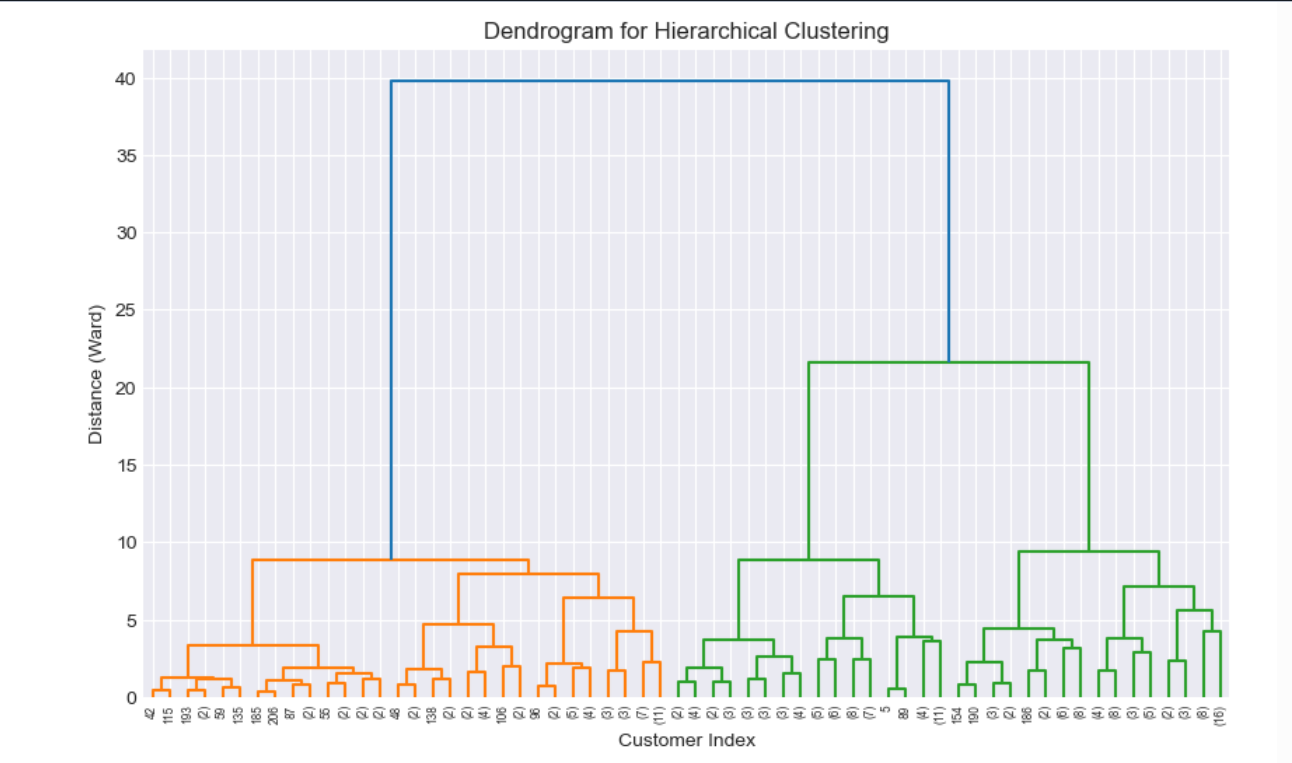
I applied hierarchical clustering using Ward’s method, which minimizes within-cluster variance. I plotted a dendrogram to decide the number of clusters and settled on 3 clusters based on the vertical distances in the dendrogram. The silhouette score for this clustering was 0.393, indicating decent separation.
The Clusters
Cluster 0 (Moderate Spenders, Low Risk): 73 customers with average spending of ₹12.29 lakh, a high probability of full payment (0.879), and low minimum payments (₹21,912).
Cluster 1 (High Spenders, Low Risk): 70 customers spending ₹15.25 lakh on average, with the highest probability of full payment (0.884) and a credit limit of ₹30.54 lakh.
Cluster 2 (Low Spenders, High Risk): 67 customers with the lowest spending (₹9.85 lakh), a lower probability of full payment (0.848), and high minimum payments (₹40,836).
Real-Life Connection
In our example, Cluster 1 might include customers like Anjali, who can afford big purchases and pay reliably, while Cluster 2 might have folks like Rahul, who spend less and struggle with payments—possibly due to financial constraints. Cluster 0 represents the middle ground: customers who spend moderately and manage their finances well. Hierarchical clustering helps the bank see these distinct groups and plan tailored strategies.
Step 4: K-Means Clustering—Refining the Segments
What We Did:
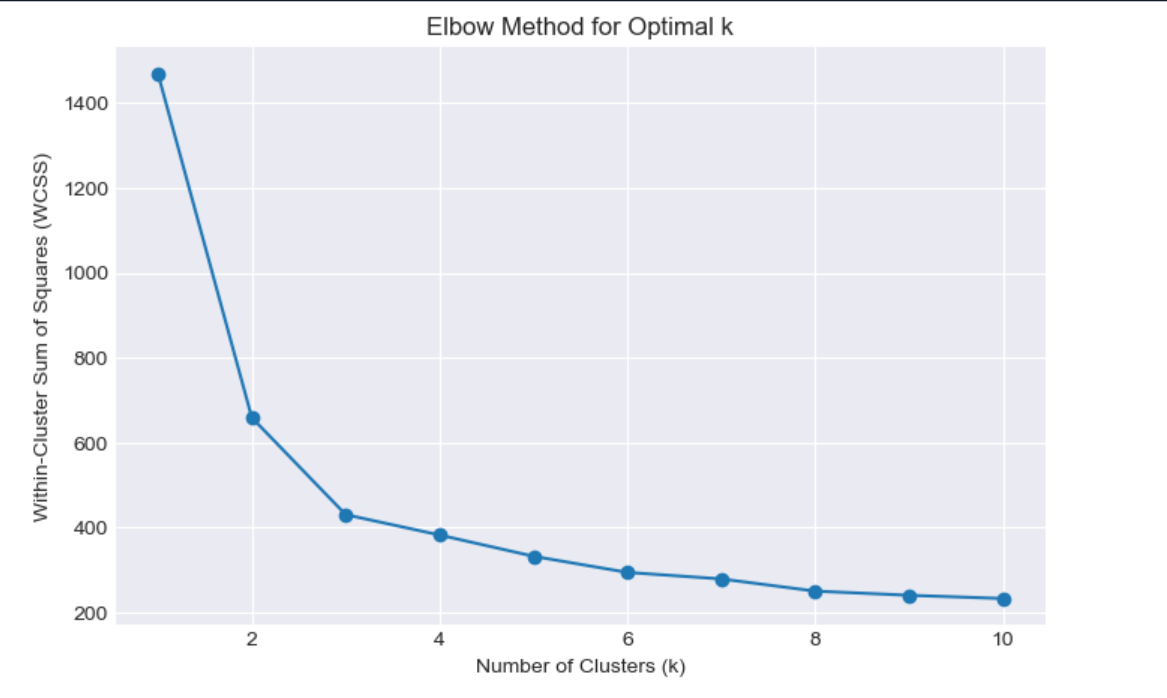
Next, I used K-means clustering, a popular method for grouping data. I used the elbow method (plotting Within-Cluster Sum of Squares) and silhouette scores to choose the number of clusters. The elbow plot showed a bend at k=3, and the silhouette score for k=3 was 0.401 (slightly better than hierarchical clustering). So, I went with 3 clusters.
The Clusters
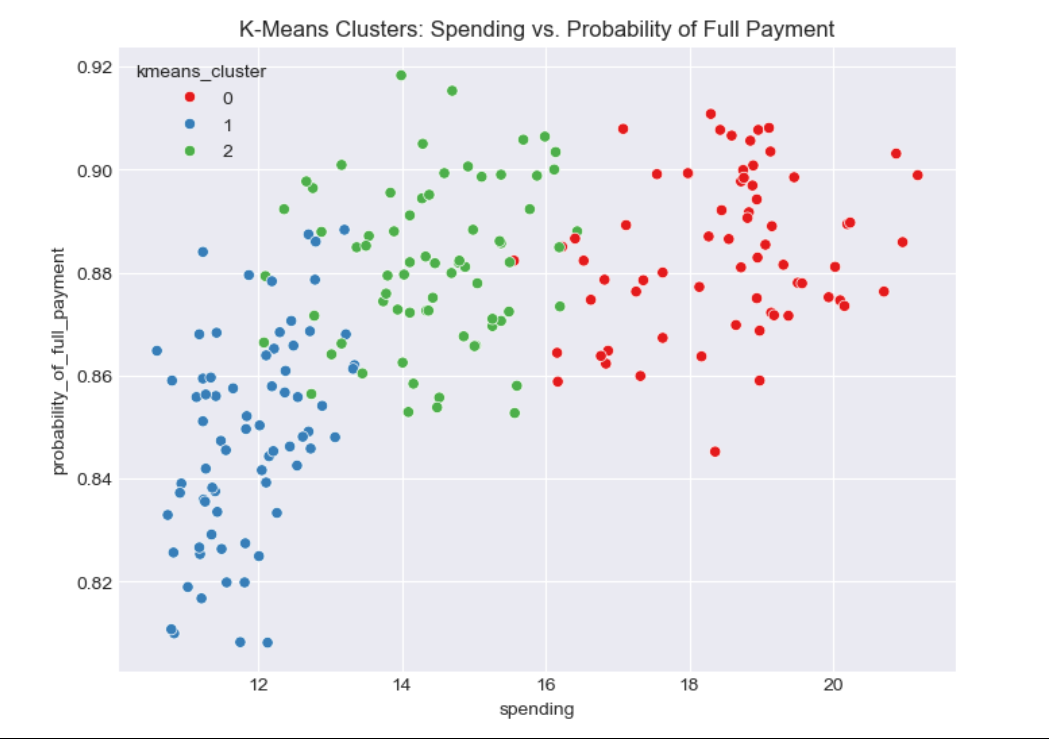
Cluster 0 (Low Spenders, High Risk): 67 customers, spending ₹9.85 lakh, with a low probability of full payment (0.848) and high minimum payments (₹40,836).
Cluster 1 (High Spenders, Low Risk): 72 customers, spending ₹15.25 lakh, with a high probability of full payment (0.884) and a credit limit of ₹30.54 lakh.
Cluster 2 (Moderate Spenders, Low Risk): 71 customers, spending ₹12.29 lakh, with a good probability of full payment (0.879) and low minimum payments (₹21,912).
Real-Life Connection
These clusters align closely with hierarchical clustering but offer a refined view. Cluster 1 might be customers like Anjali, who can handle big purchases—like a new iPhone during a festive sale—while Cluster 0 could include people like Rahul, who spend less and might miss payments due to financial strain. Cluster 2 might be middle-class families spending moderately and managing their finances well. K-means clustering gives the bank a clearer, more actionable segmentation.
Step 5: Turning Clusters into Business Strategies
What We Did:
Finally, I used the K-means clusters to create customer profiles and recommend tailored strategies for the bank.
Cluster Profiles and Recommendations
Cluster 0 (Low Spenders, High Risk):
Profile: These customers spend the least (₹9.85 lakh), have the lowest credit limit (₹23.66 lakh), and struggle with payments (probability of full payment: 0.848).
Strategy: Offer budget-friendly promotions, like discounts on essentials at a local supermarket. Monitor their credit usage closely and provide financial literacy workshops to help them manage debt.
Engagement: Introduce small cashback offers on everyday transactions—like grocery shopping—to encourage spending without risk.
Cluster 1 (High Spenders, Low Risk):
Profile: These are the big spenders (₹15.25 lakh), with high credit limits (₹30.54 lakh) and a great payment record (0.884).
Strategy: Target them with premium offers, such as exclusive credit card benefits or higher credit limits for shopping at luxury stores. Promote high-end products, like a vacation package during a festive season.
Upselling: Offer complementary products, such as travel insurance for their next trip, or bundle deals on electronics at a major retailer.
Loyalty Programs: Launch a tiered loyalty program with perks like free airport lounge access.
Cluster 2 (Moderate Spenders, Low Risk):
Profile: These customers spend moderately (₹12.29 lakh), have a decent credit limit (₹26.81 lakh), and are reliable payers (0.879).
Strategy: Offer balanced promotions, like festive discounts on mid-range purchases. Provide financing options for items like a new two-wheeler during a major festival.
Engagement: Encourage more spending through referral programs—maybe a small voucher for referring a friend to the bank’s credit card.
Credit Limit Increase: Gradually increase their credit limit to encourage bigger purchases, as they’ve shown financial stability.
Real-Life Connection
Let’s revisit Anjali and Rahul during a festive season like Diwali. For Cluster 1, the bank might send Anjali an offer for a 10% discount on gold jewelry at a premium store in Bengaluru, knowing she can afford it and will pay back. For Cluster 0, they might offer Ravi a 5% cashback on grocery shopping at a local store in Koramangala, encouraging small, safe transactions. For Cluster 2, the bank could promote a zero-interest EMI on a new TV, appealing to their moderate spending habits. Clustering ensures every customer gets an offer that fits their lifestyle.
Conclusion: The Power of Clustering for Banks
This project showed me how powerful clustering can be for banks, helping them understand their customers—whether they’re big spenders or cautious savers. By using hierarchical and K-means clustering, I segmented customers into three distinct groups: low spenders with high risk, high spenders with low risk, and moderate spenders with low risk. These insights allow the bank to craft personalized strategies, from premium deals for big spenders to budget-friendly offers for those who need them most.
As a data science enthusiast, I find it exciting to see how these techniques can make a real difference in our daily lives. The next time you get a credit card offer while sipping coffee at a café, you’ll know there’s a good chance data science - and maybe clustering - was behind it! What do you think about using data to personalize banking? Drop your thougThts in the comments - I’d love to hear from you! Thankyou!!!
Subscribe to my newsletter
Read articles from Alok Gupta directly inside your inbox. Subscribe to the newsletter, and don't miss out.
Written by
Alok Gupta
Alok Gupta
I’m an aspiring web developer keen on learning new things. I’m dedicated to keeping up to date with the latest stuffs in web development. I always lookout for chances to grow and learn. When I’m not coding, I enjoy reading about India’s fascinating history. It helps satisfy my curiosity and teaches me about the diverse India.