A Guide to Observability: Using Prometheus and Grafana with Django notes-app
 Nikitha Jain
Table of contents
- What is Observability?
- Benefits of Observability:
- let’s start monitoring our Django notes-app application:
- Step:1 - Docker Installation
- Step:2 - Docker-compose for django notes-app
- Step-3: Write Docker-compose.yml file for cadvisor
- Step-4: Write Docker-compose.yml file for Prometheus
- Step-5: Write Docker-compose.yml file for Node-exporter
- Step-6: Write Docker-compose.yml file for Grafana
- Step-7: Visualize it through the available Grafana Templates
- Step-6: Add Loki and Promtail config to the Docker-compose.yml file
- **
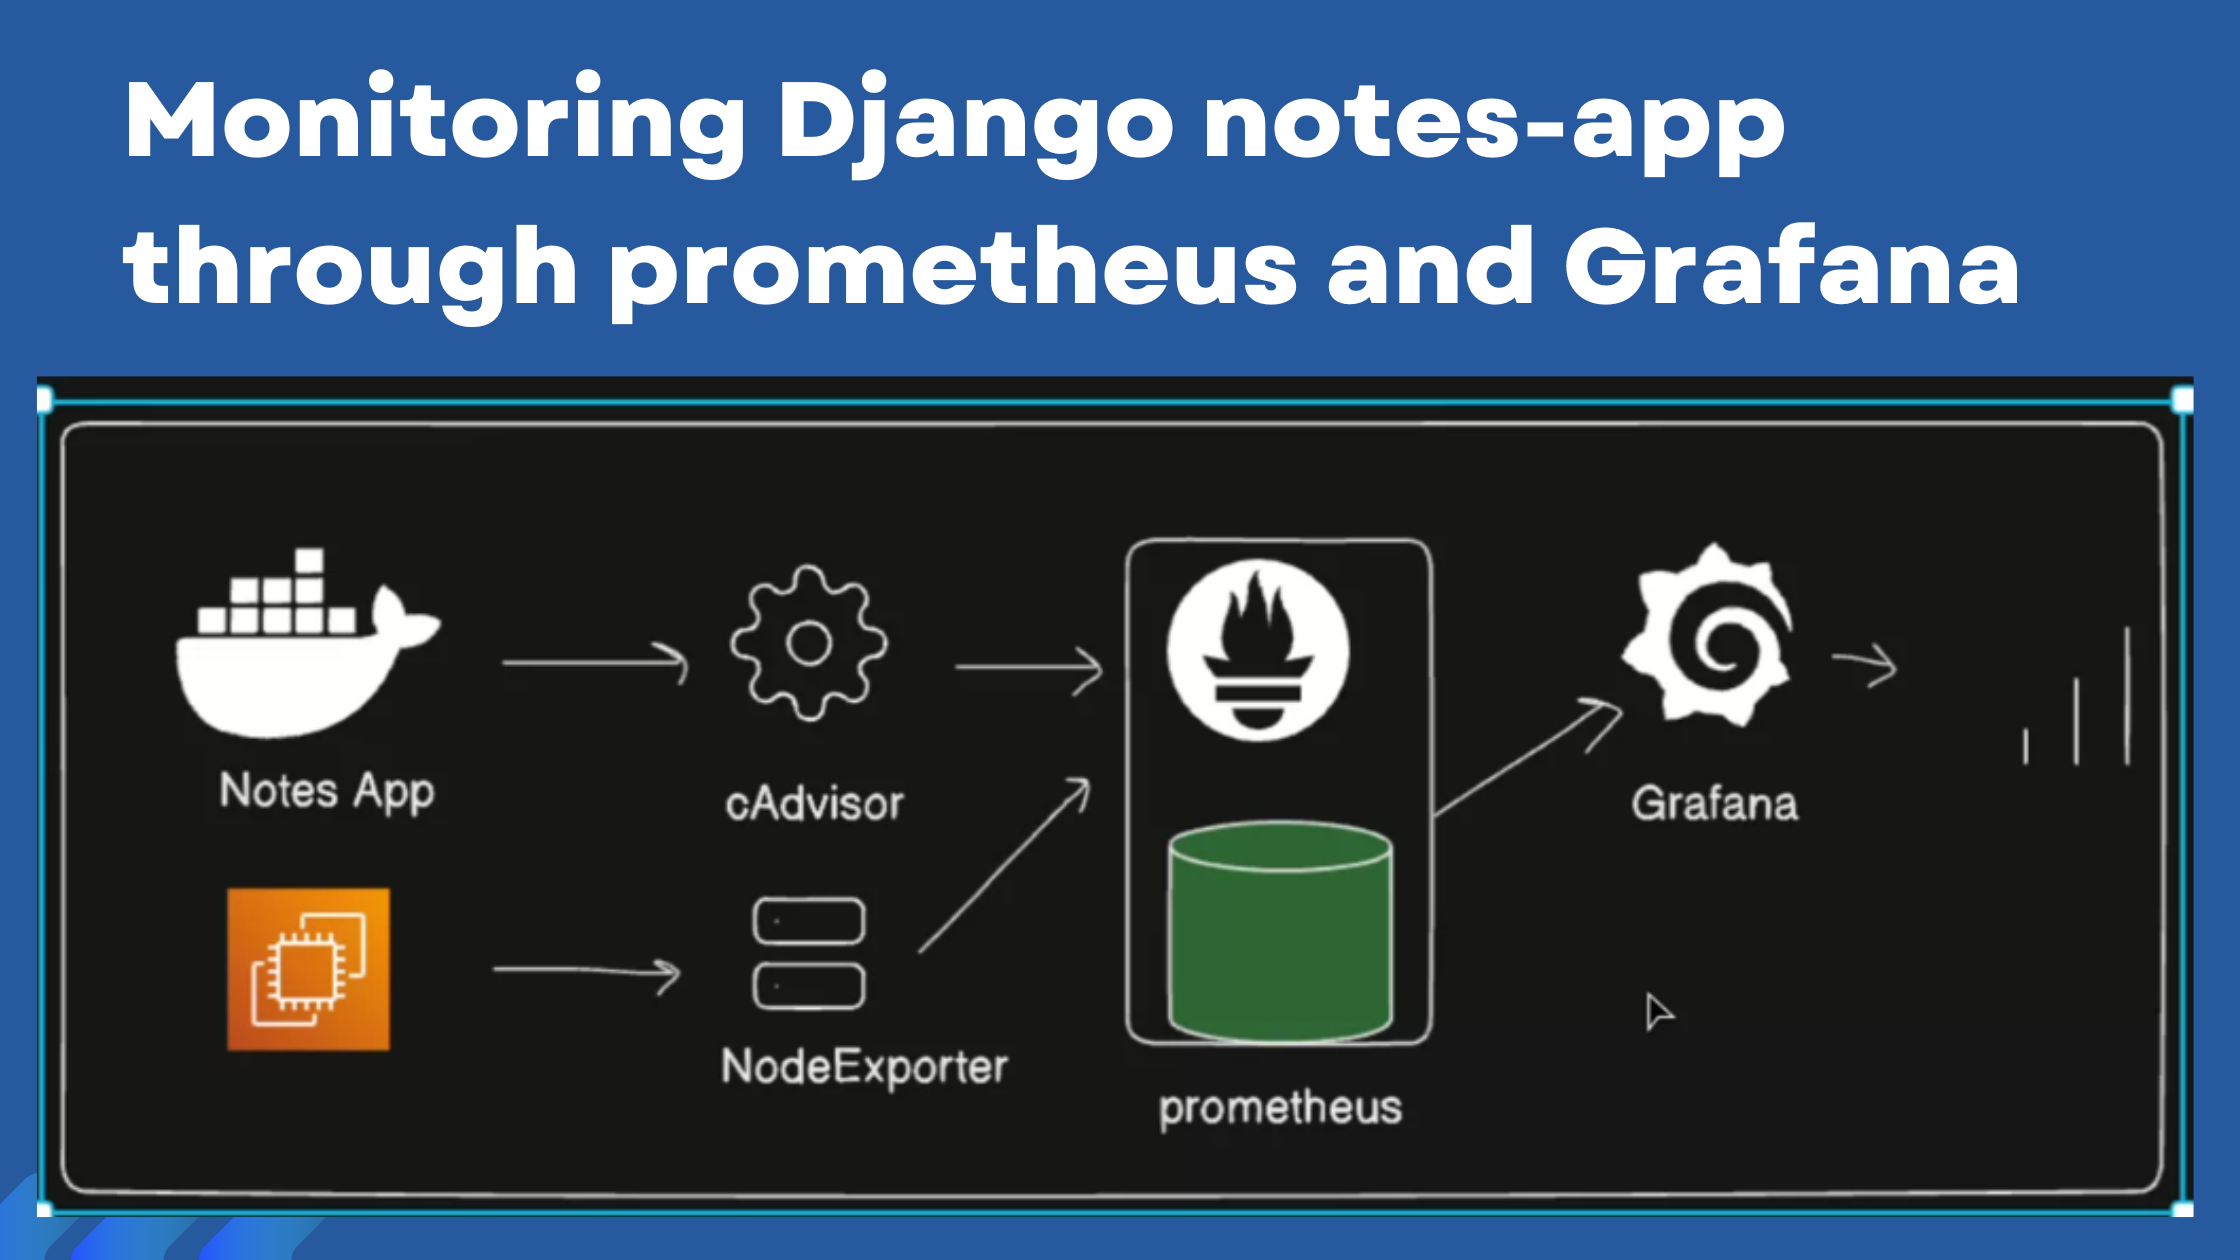
We need to understand the importance of observability tools that we use in DevOps, mostly to immediately see if any potential risks through visual representation.
What is Observability?
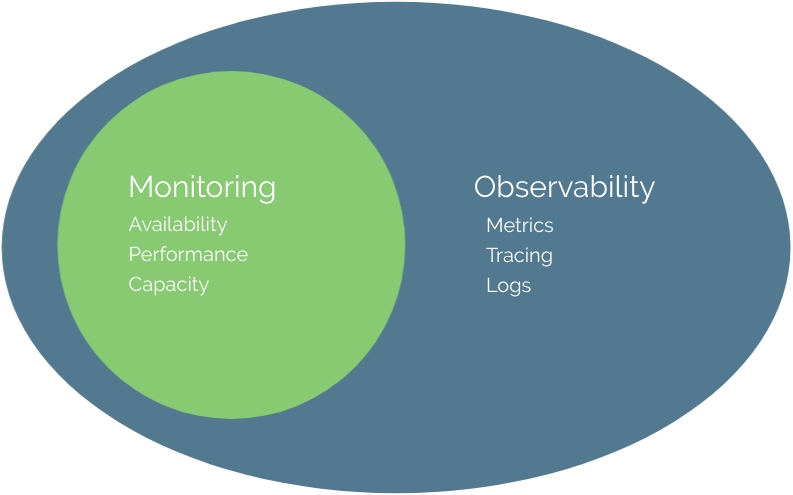
Observability is the practice of monitoring and understanding the internal workings of a system by collecting and analyzing data like metrics, logs, and traces. These data help teams see how the system behaves, identify issues, and make informed decisions.
Observability is powered by three primary pillars:
Metrics: Quantitative data (e.g., CPU usage, memory consumption, response time) that gives insights into the system's health.
Logs: Detailed, timestamped records of events or actions that happen within a system, useful for troubleshooting.
Traces: Data that shows the journey of a request or transaction as it moves through different services in a distributed system, helping identify bottlenecks.
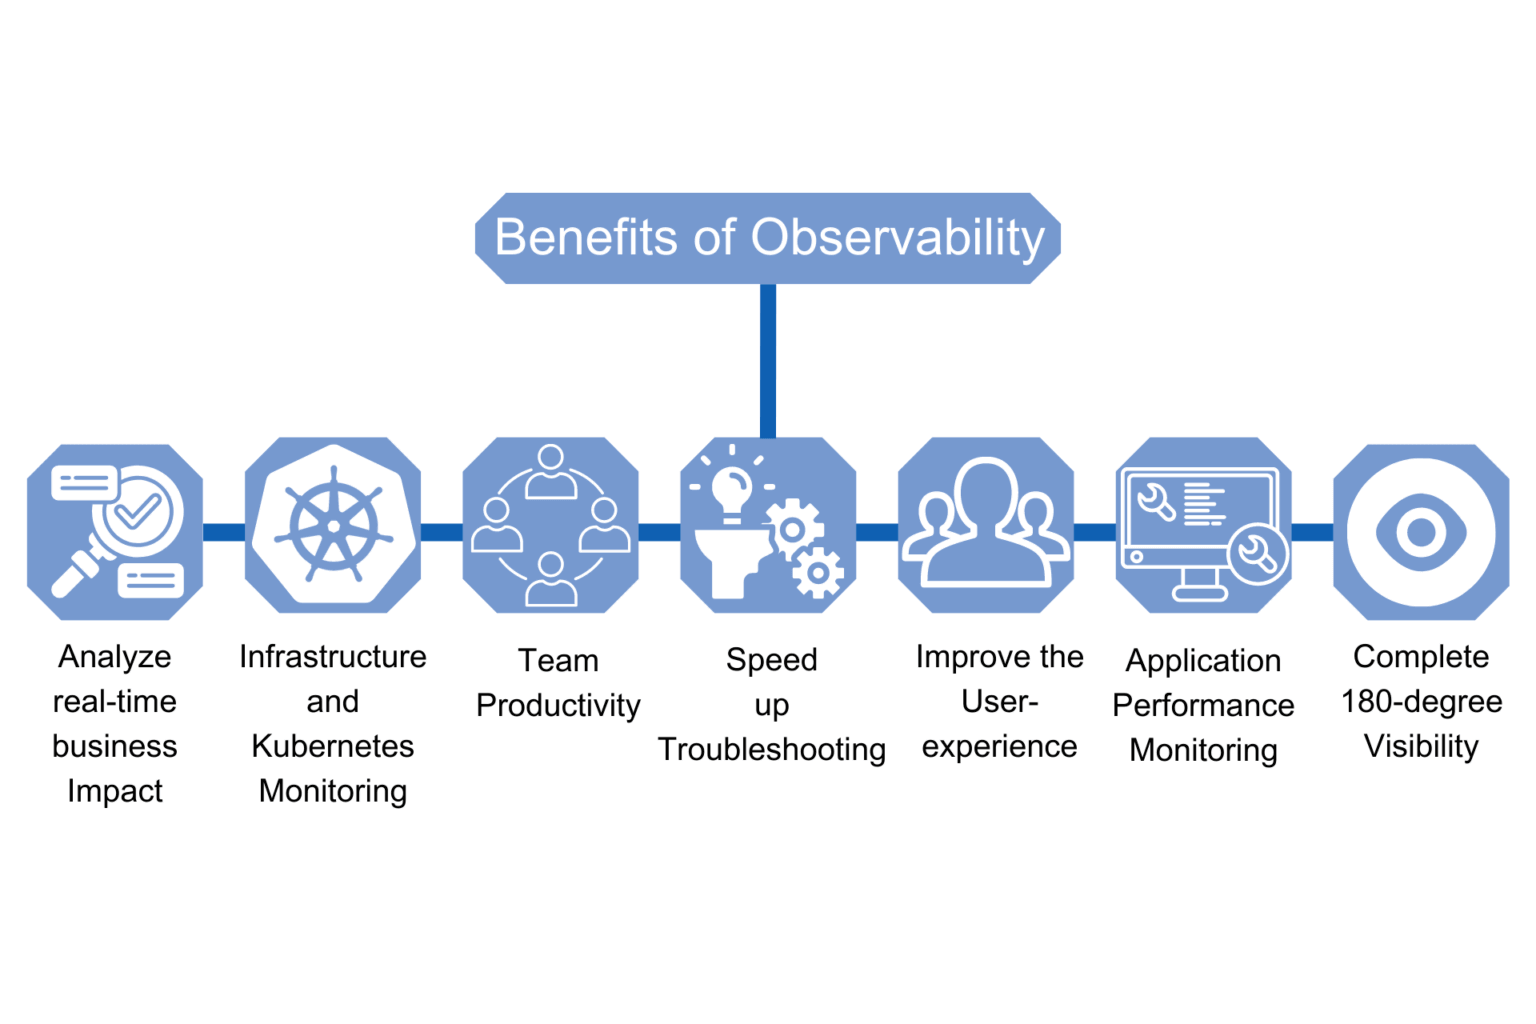
Benefits of Observability:
let’s start monitoring our Django notes-app application:
Create an EC2 instance of t2.large with 20GB memory with ubuntu image. Launch the instance,
After Launching the instance connect it with SSH , then install docker.
Docker is the pre-requisite for the monitoring tools like prometheus.
Step:1 - Docker Installation
sudo apt-get install docker.io
sudo apt install docker-compose
sudo usermod -aG docker $USER
newgrp docker
docker --version
docker-compose version
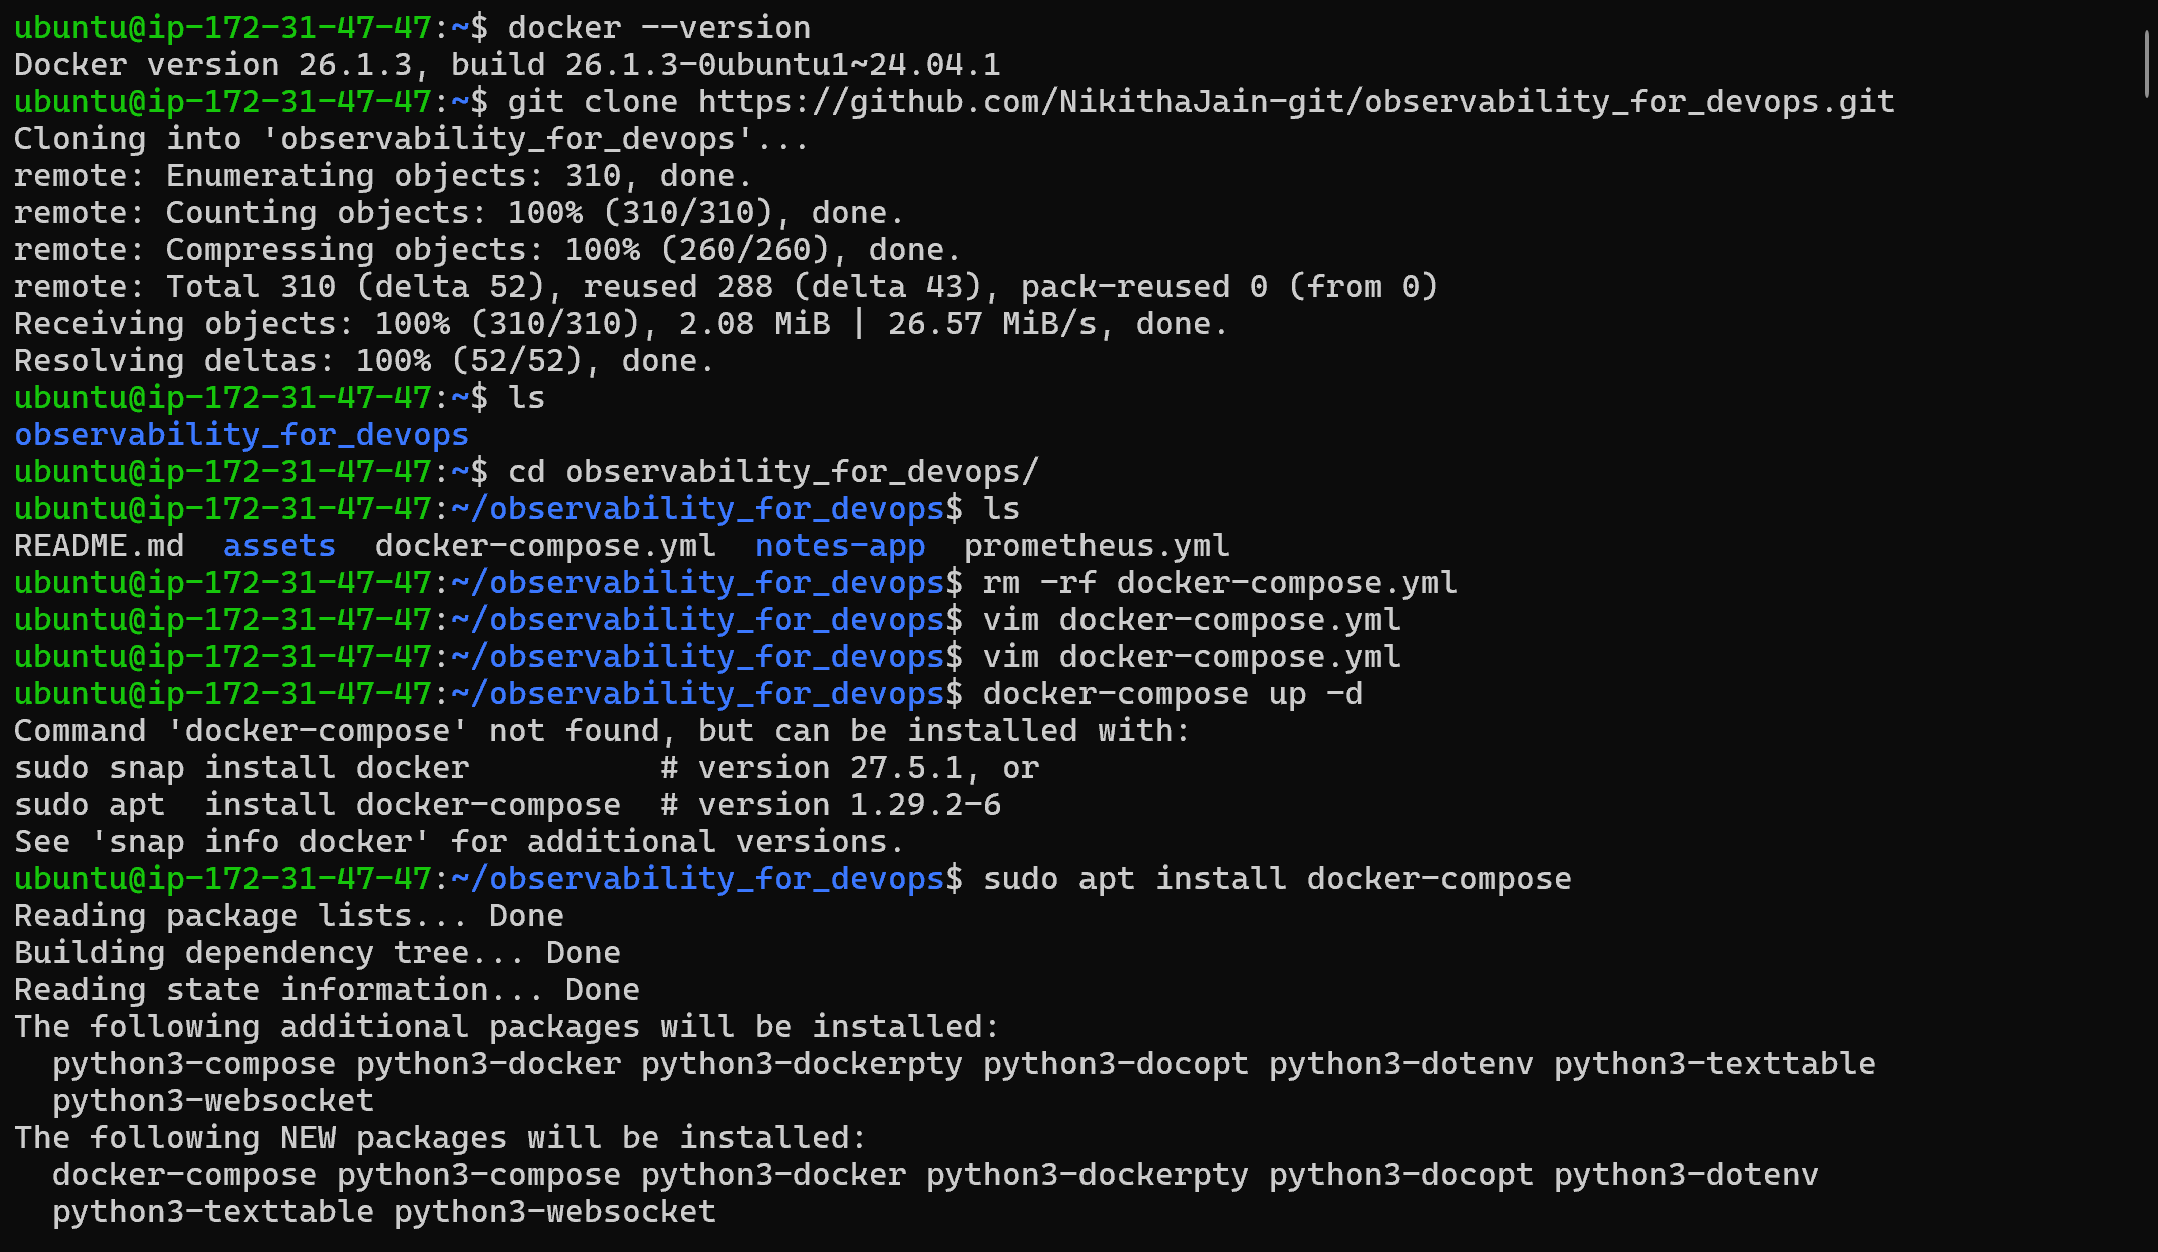
Use the above commands to install and configure the docker.
Now clone the git repo,
https://github.com/NikithaJain-git/observability_for_devops.git
and delete docker.compose.yml and prometheus.yml files for your practice and understanding.
Step:2 - Docker-compose for django notes-app
Now, lets write the docker compose for django notes-app
services:

  notes-app:
    build:
      context: ./notes-app
    ports:
      - "8000:8000"
    container_name: notes-app
    networks:
      - monitoring
    volumes:
      - ./notes-app:/app
    restart: always
networks:
  monitoring:
    driver: bridge
After writing this docker-compose.yml, use these commands:
docker compose up -d
docker ps
docker images

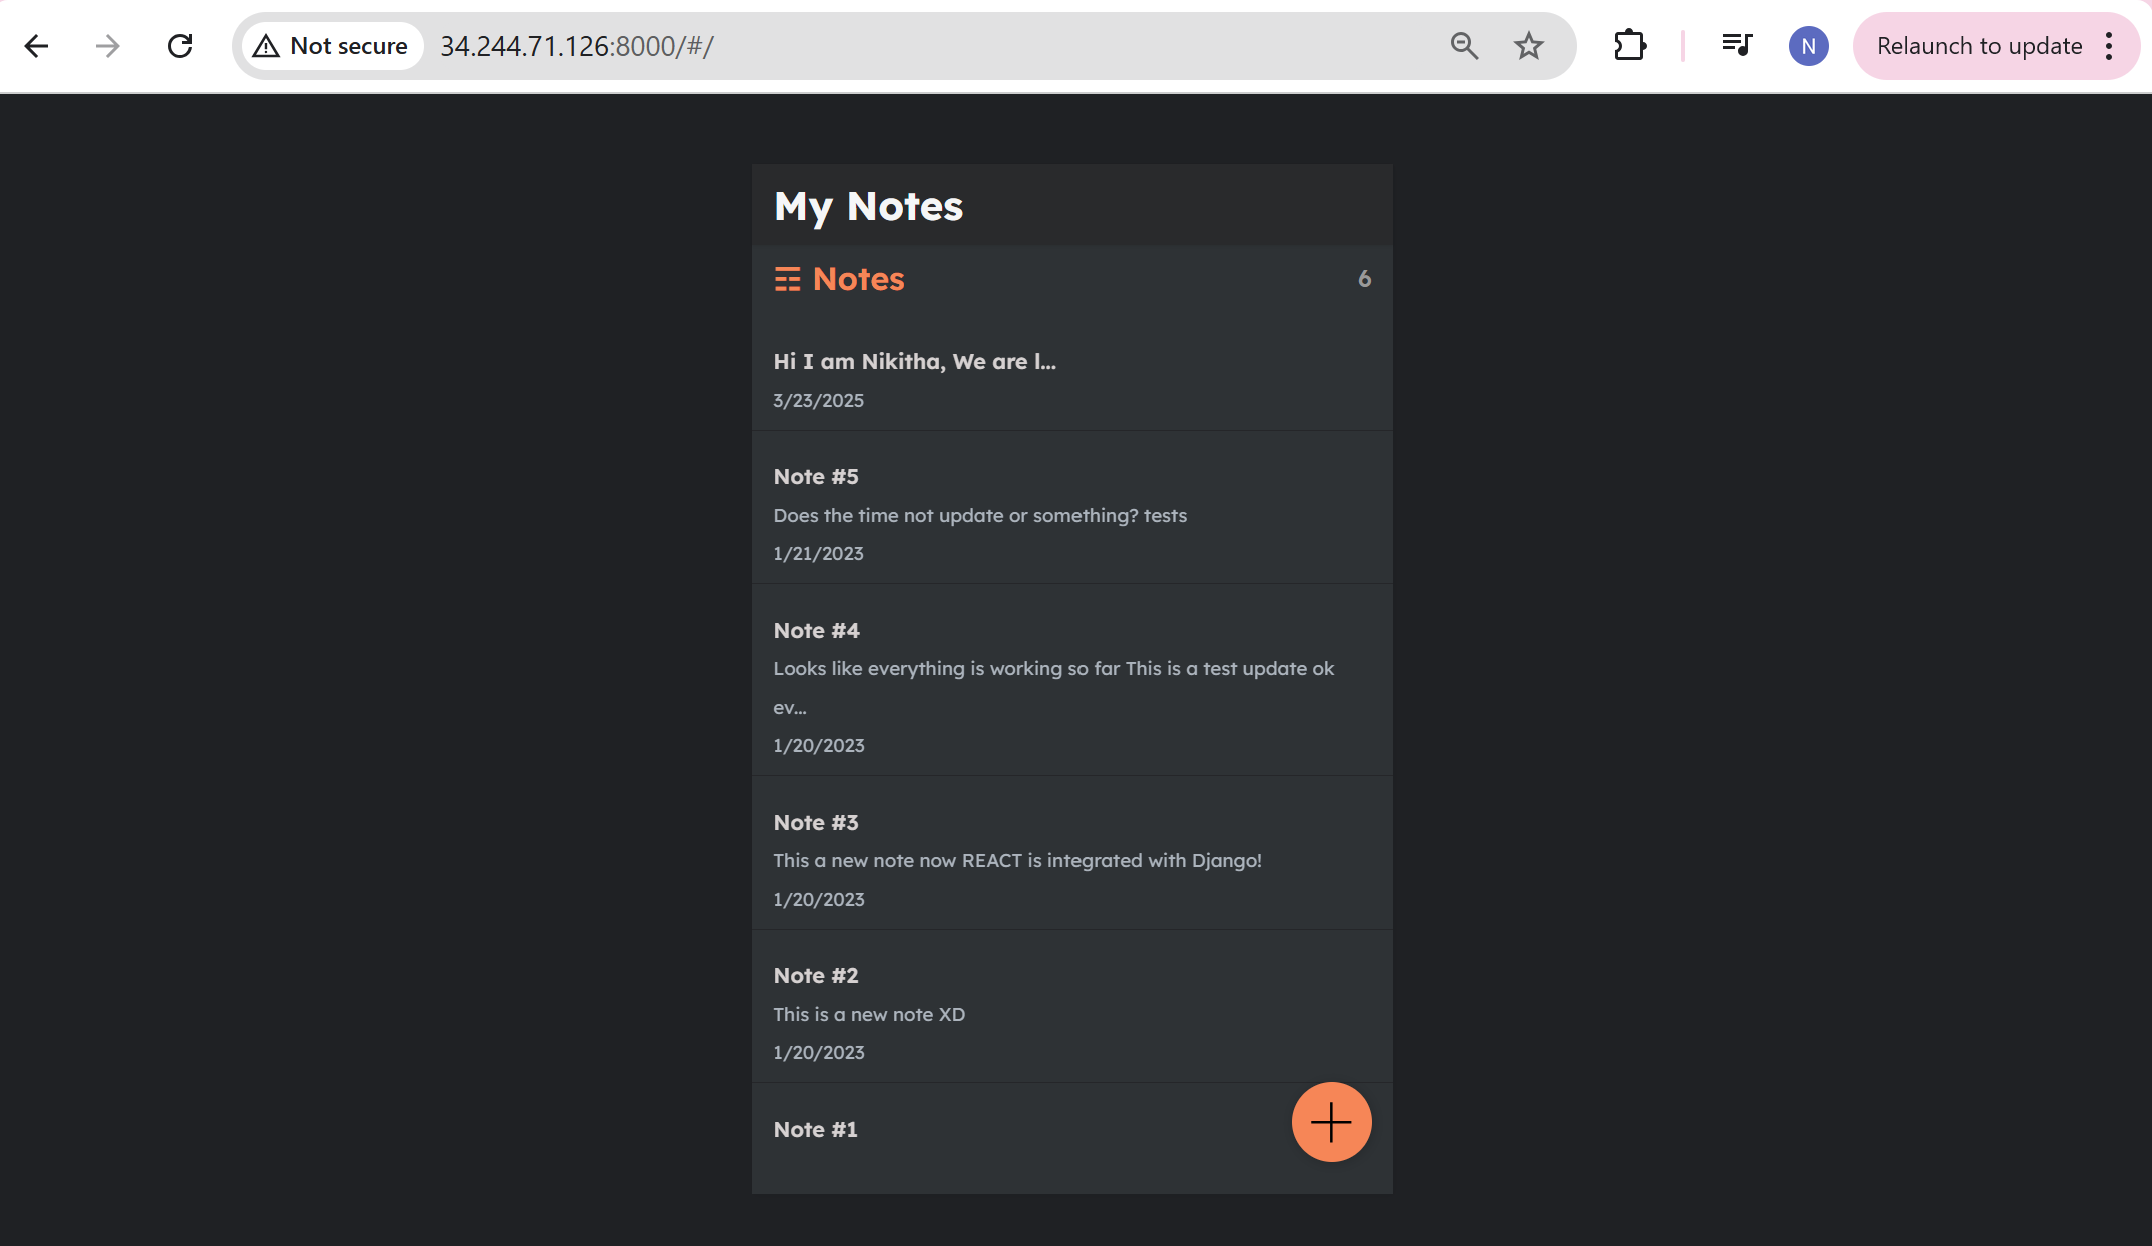
Try accessing the django notes-app through browser of your choice, as shown below with your public ip:8000
Open the port “8000” in the security group before accessing it.
Step-3: Write Docker-compose.yml file for cadvisor
  cadvisor:
    image: gcr.io/cadvisor/cadvisor:latest
    container_name: cadvisor
    ports:
    - 8080:8080
    volumes:
    - /:/rootfs:ro
    - /var/run:/var/run:rw
    - /sys:/sys:ro
    - /var/lib/docker/:/var/lib/docker:ro
    networks:
      - monitoring
    depends_on:
    - redis
  redis:
    image: redis:latest
    container_name: redis
    ports:
    - 6379:6379
now again use the below docker-compose commands,
docker compose down
docker compose up -d
docker ps
docker images
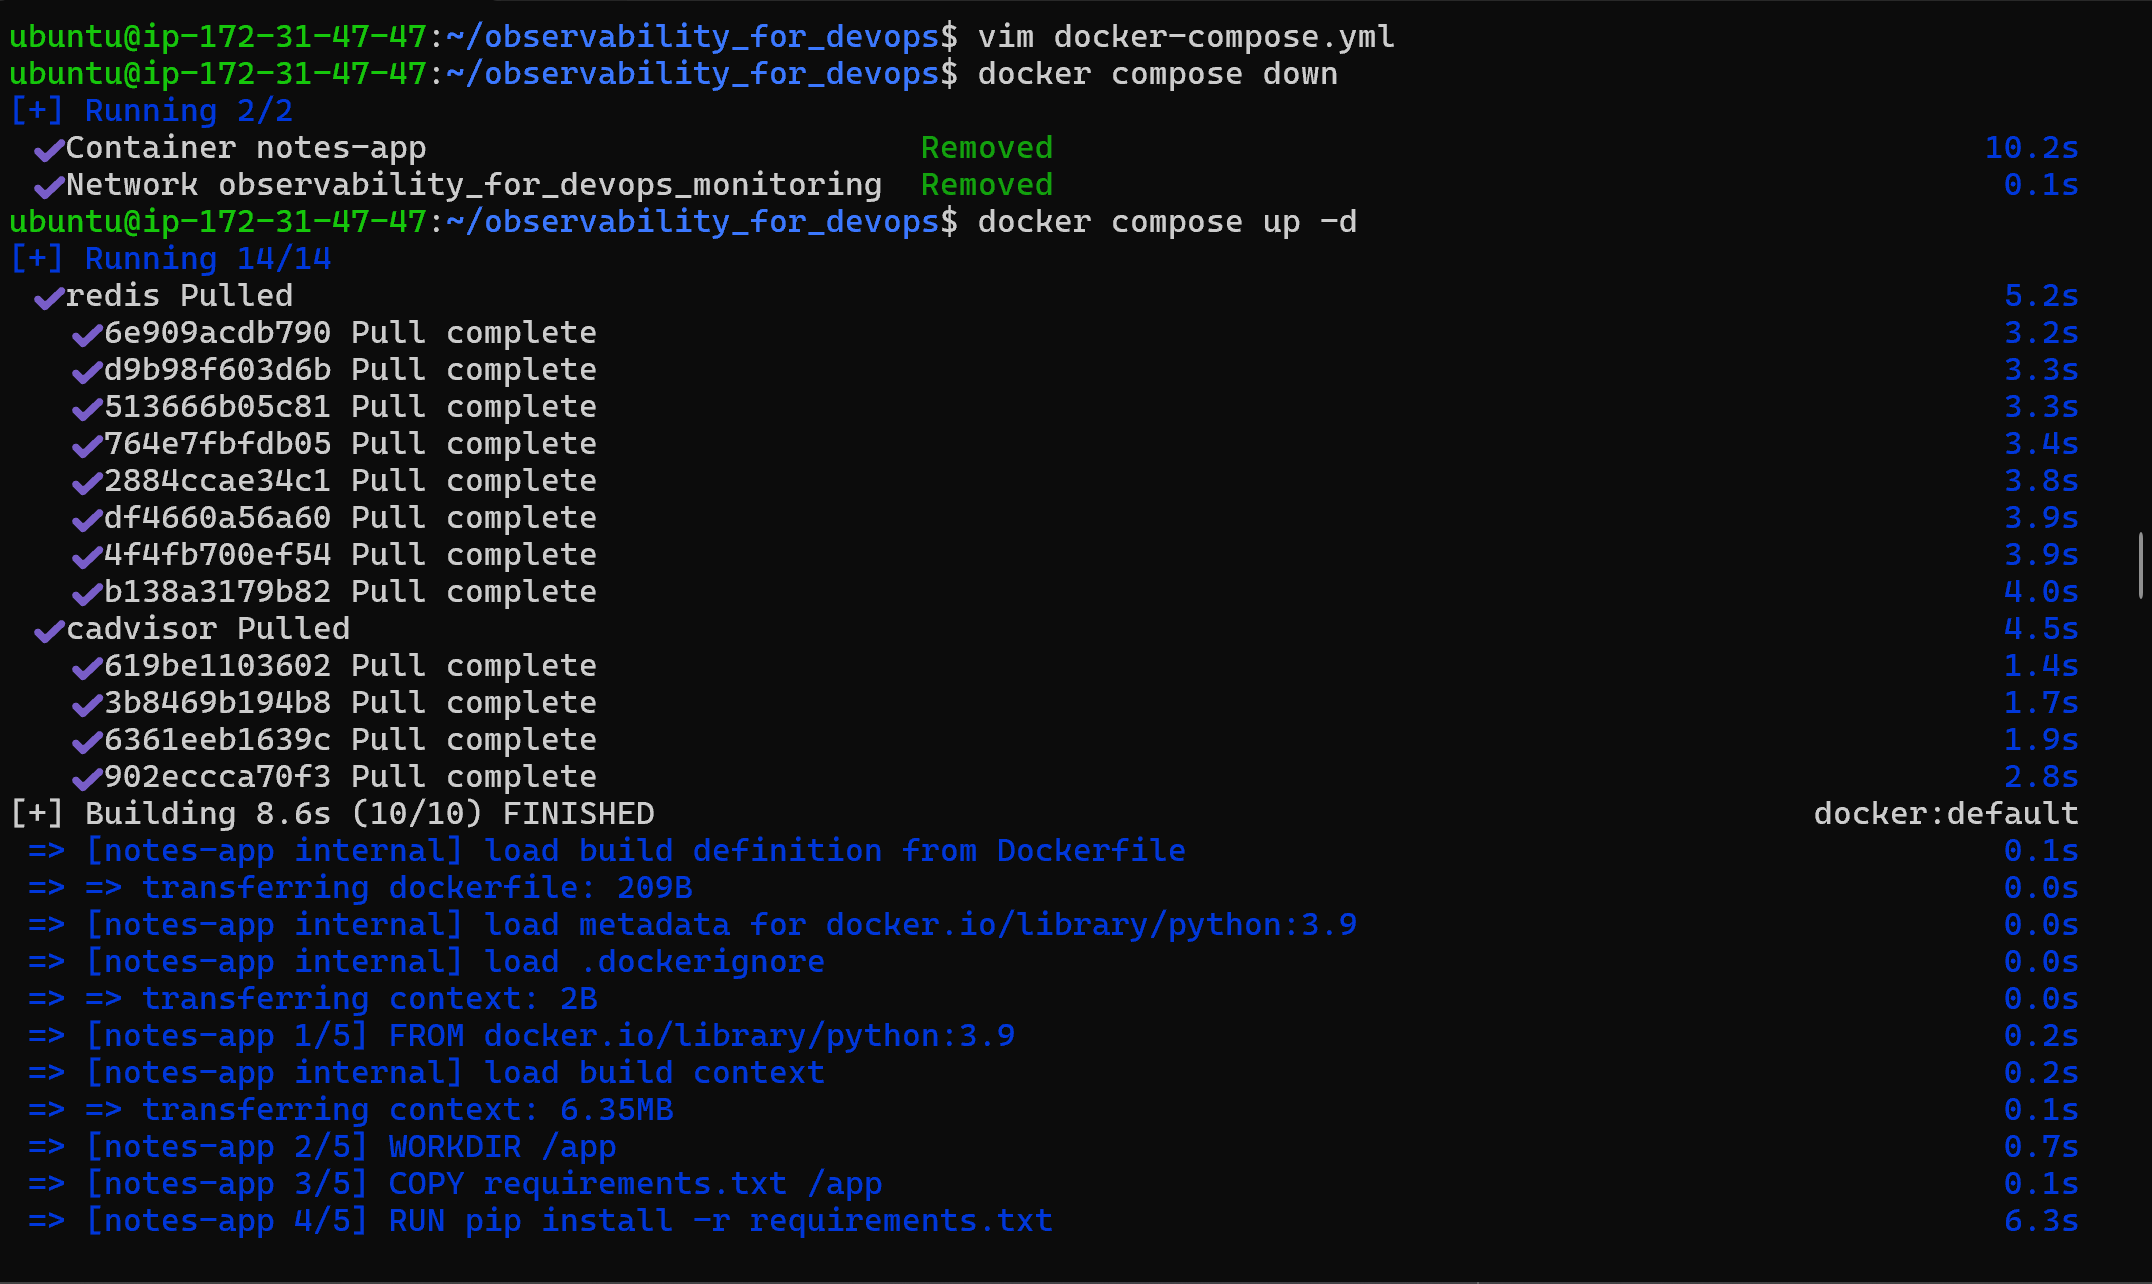
Here it pulls the image for redis and cadvisor as shown in the image below as cadvisor depends on redis

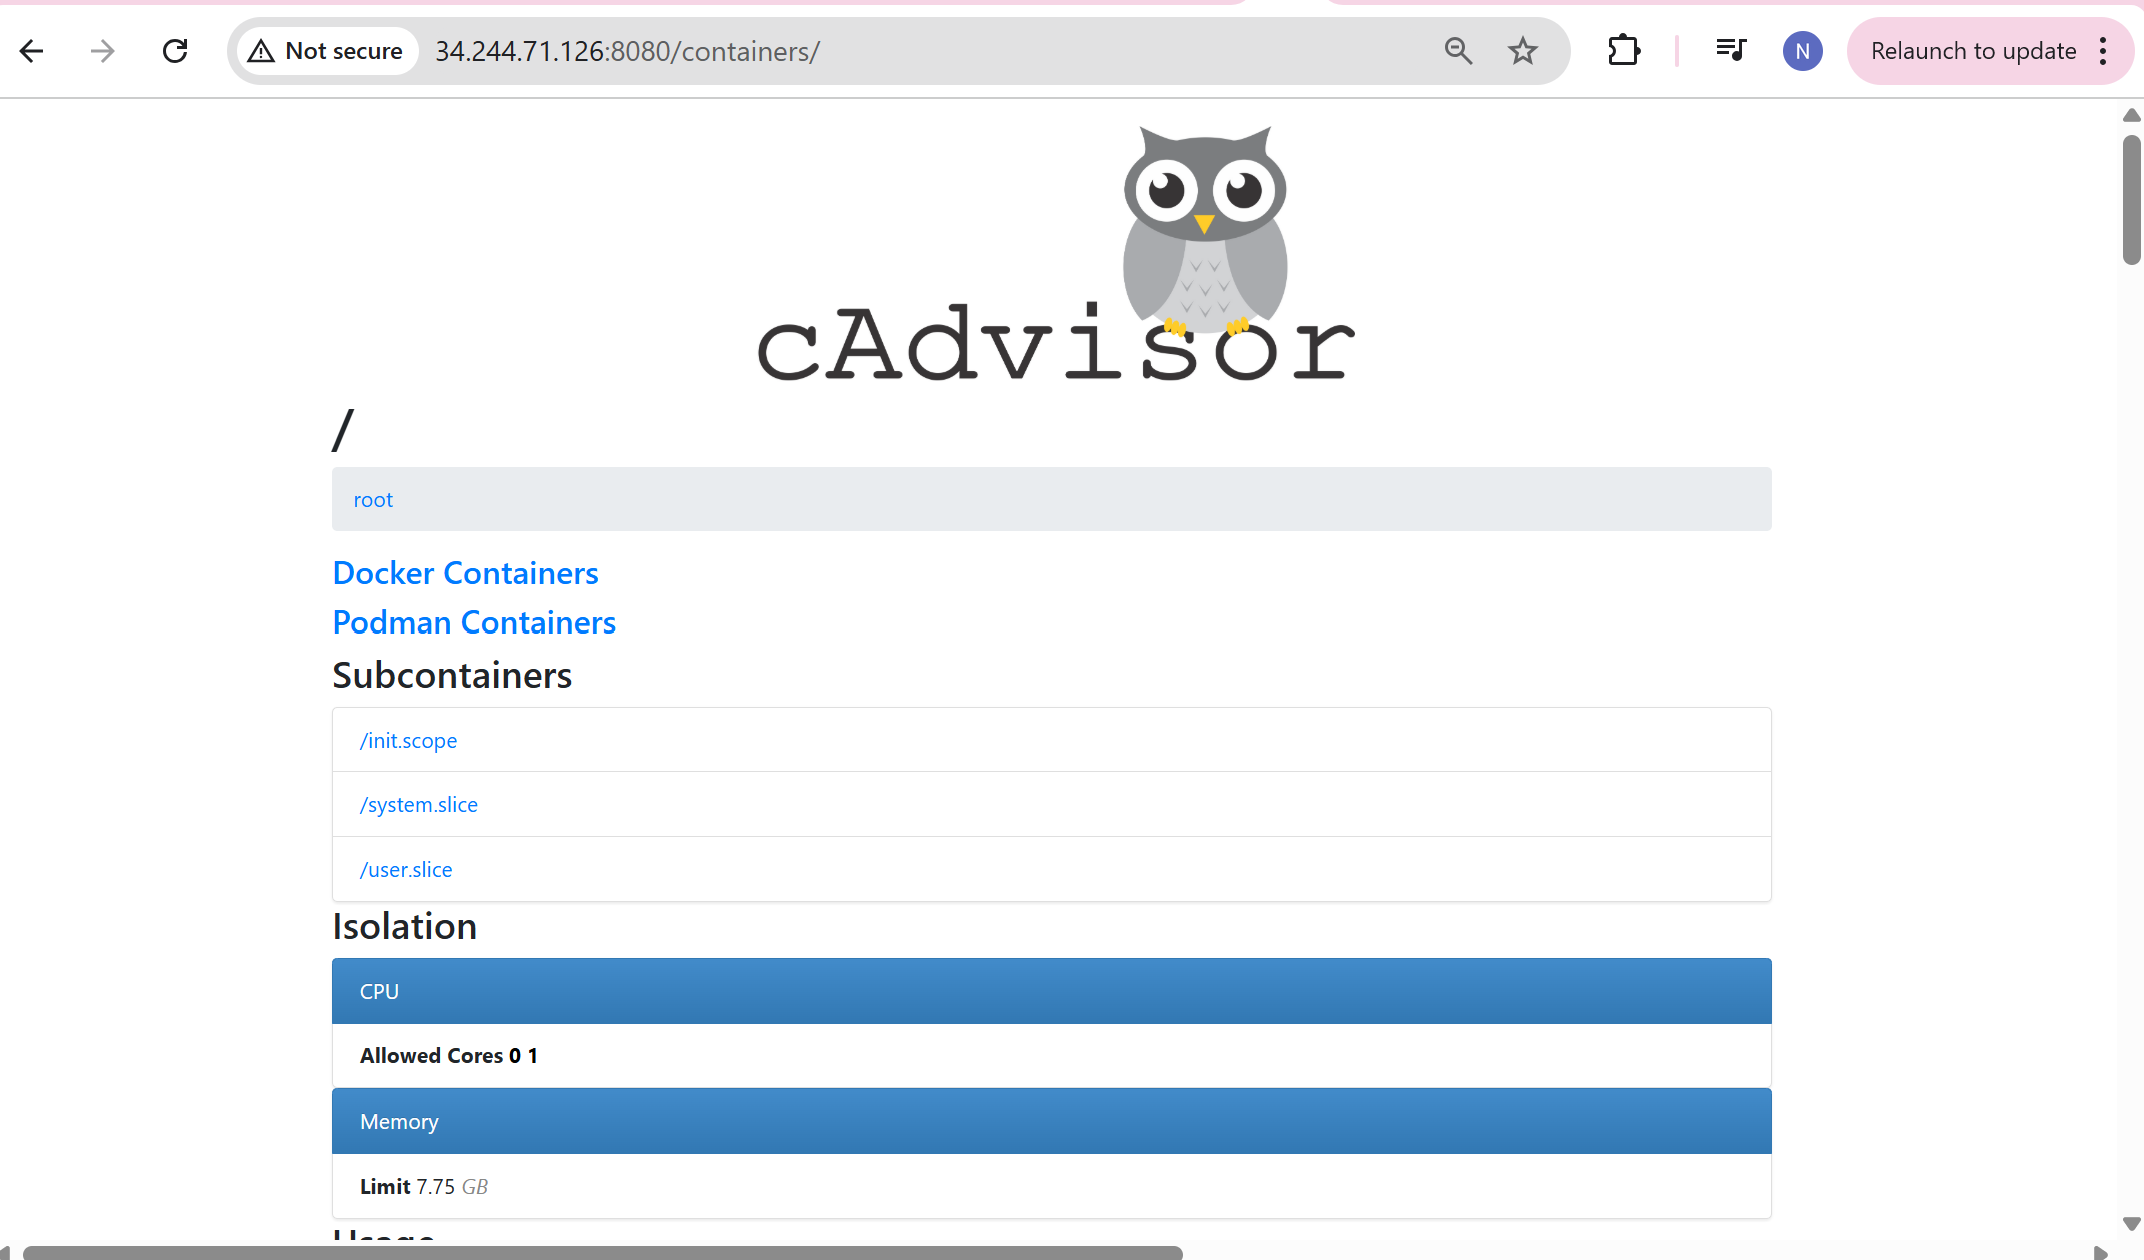
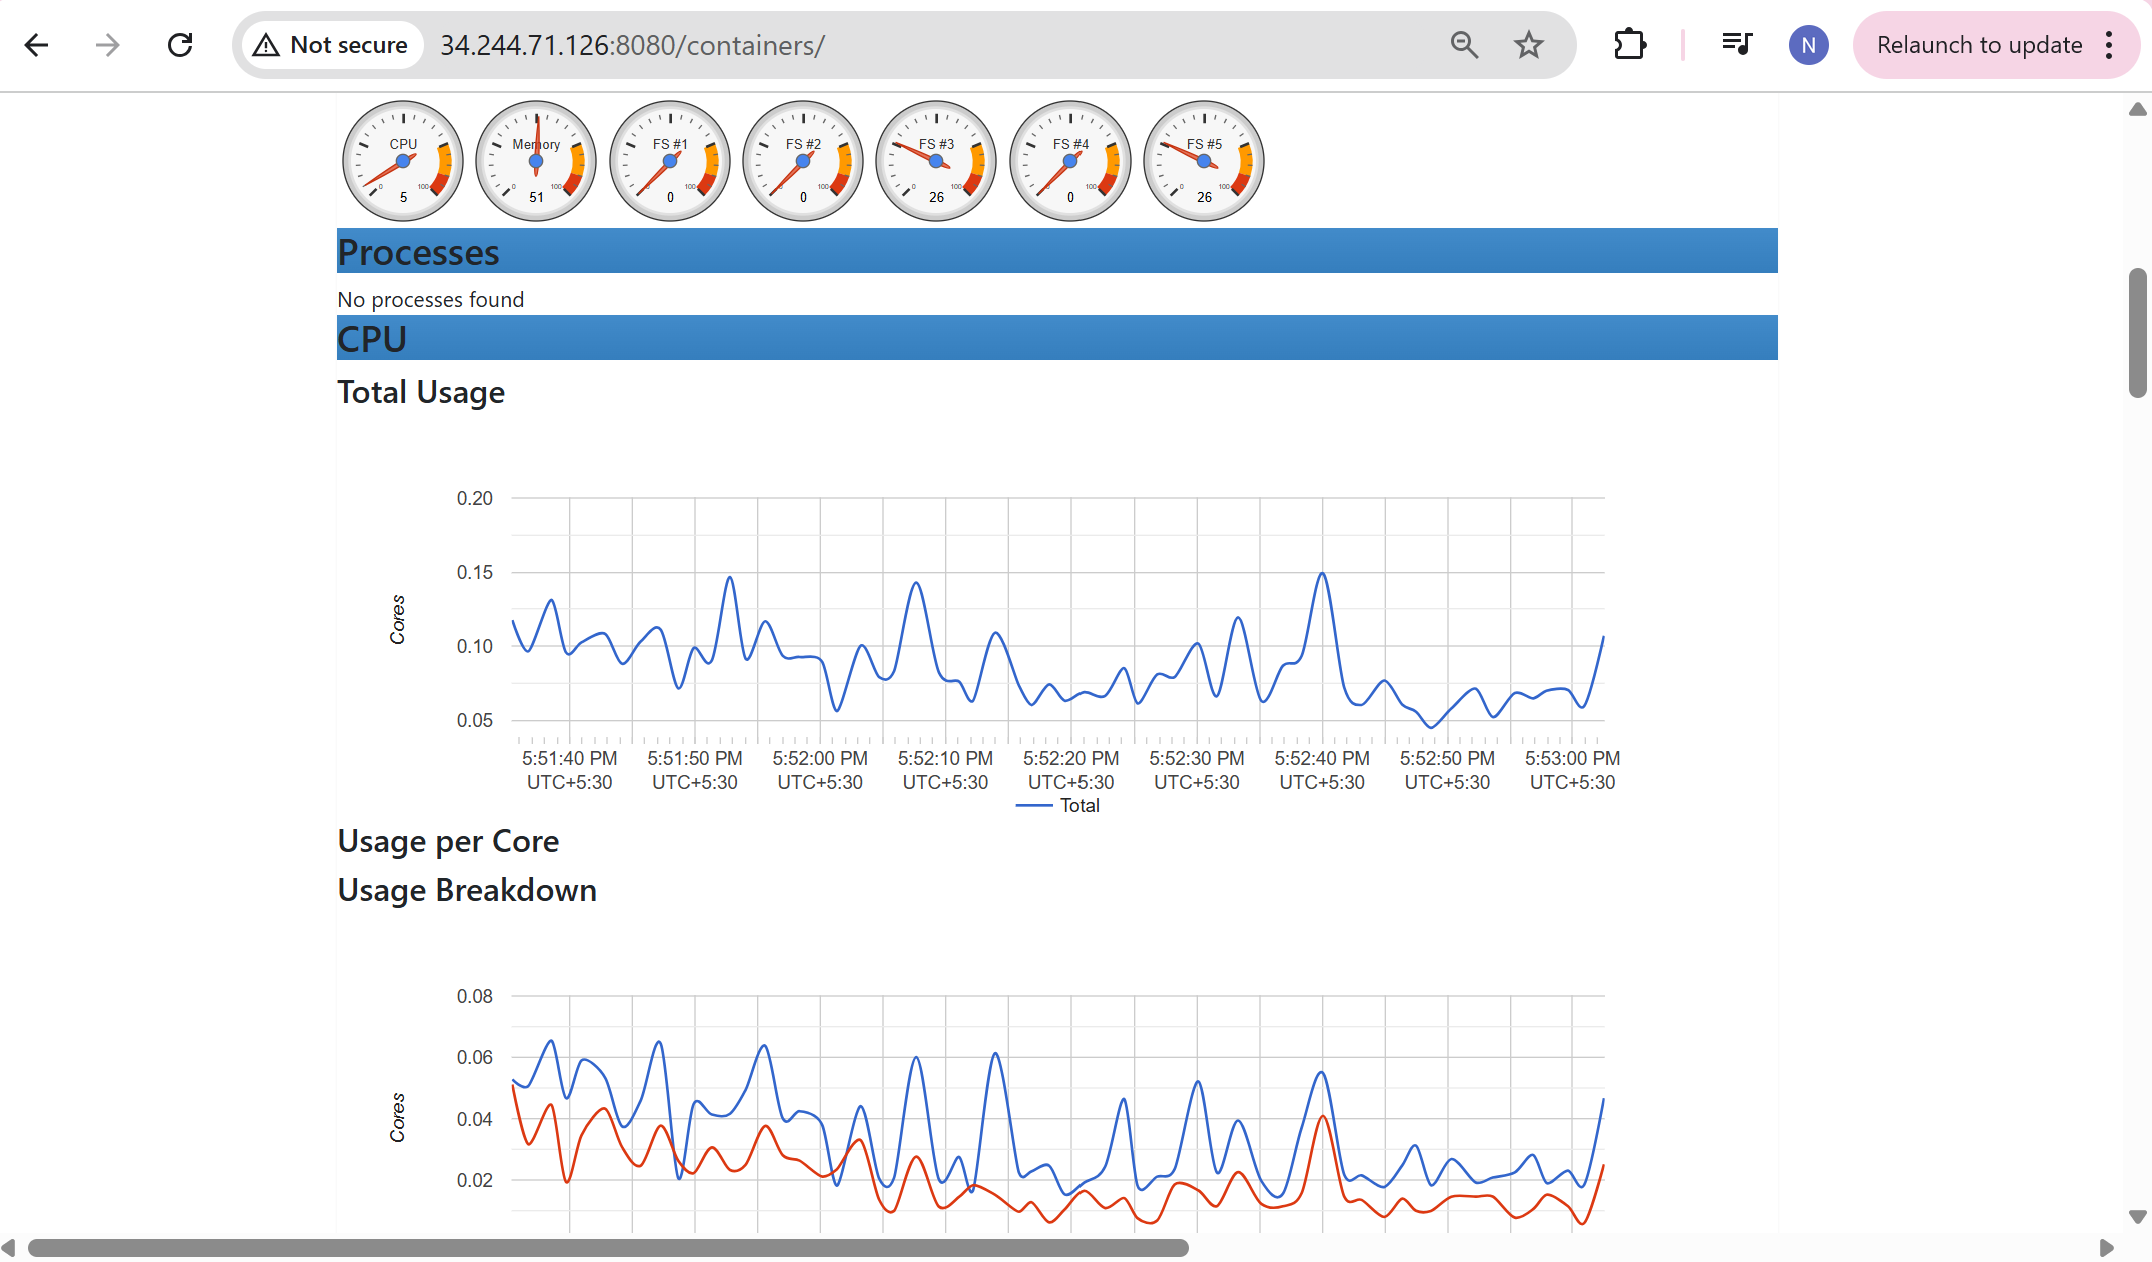
Once the container is running, use the public ip:8080
Open the port “8080” in the security group before accessing it.
Step-4: Write Docker-compose.yml file for Prometheus
prometheus:
    image: prom/prometheus:latest
    container_name: prometheus
    restart: unless-stopped
    volumes:
      - ./prometheus.yml:/etc/prometheus/prometheus.yml
      - prometheus_data:/prometheus
    command:
      - '--config.file=/etc/prometheus/prometheus.yml'
      - '--storage.tsdb.path=/prometheus'
      - '--web.console.libraries=/etc/prometheus/console_libraries'
      - '--web.console.templates=/etc/prometheus/consoles'
      - '--web.enable-lifecycle'
    ports:
      - "9090:9090"
    expose:
      - 9090
    networks:
      - monitoring
volumes:
  prometheus_data: {}
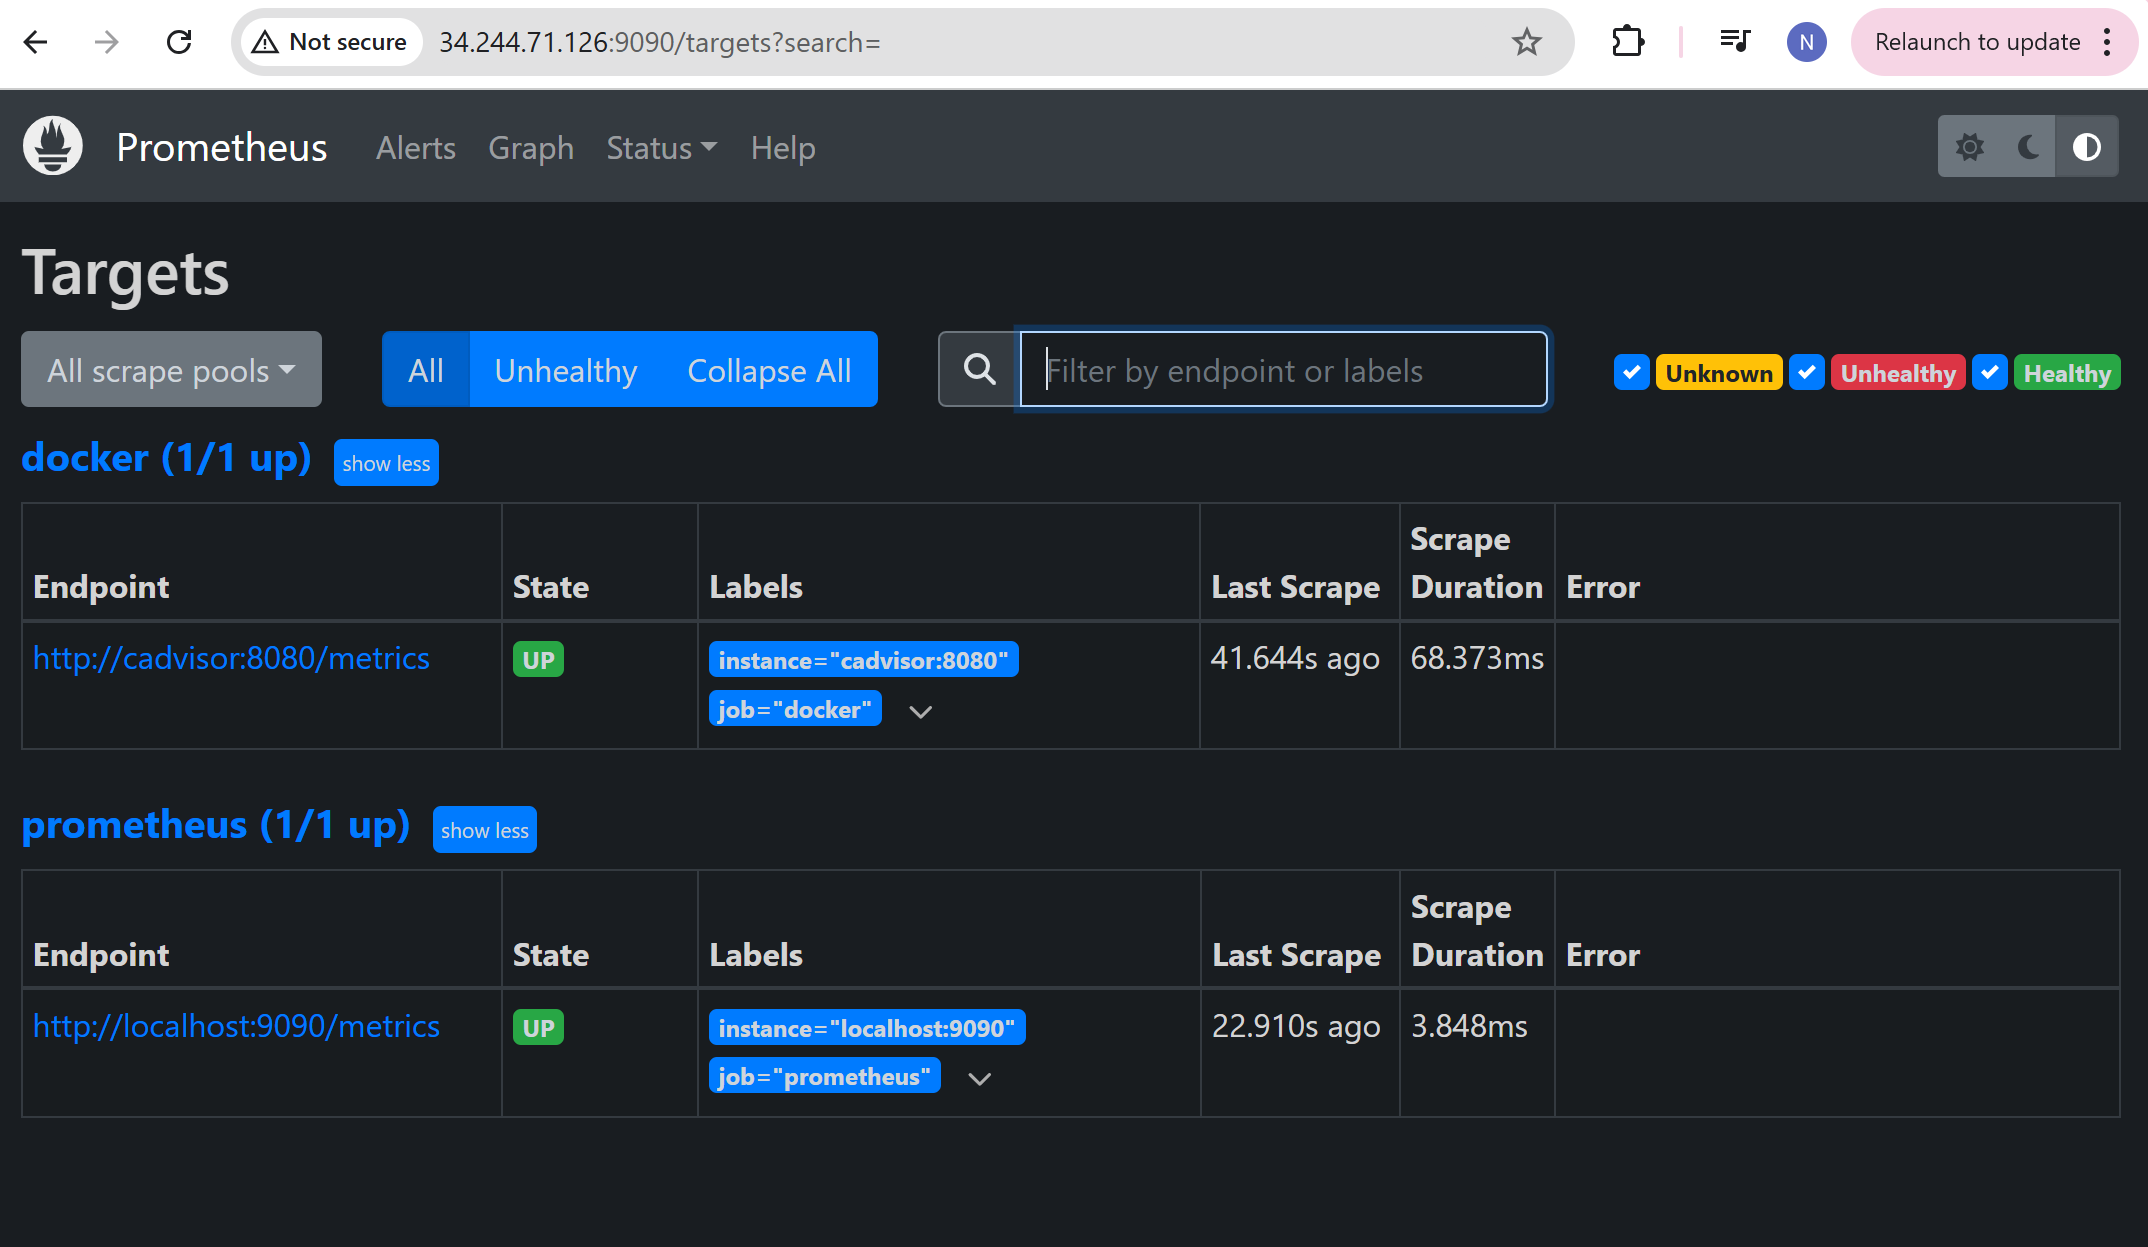
now, write the below prometheus.yml file for connecting the containers together using container name for cadvisor and prometheus as shown below,
Open the port “9090” in security group and access it through browser as below,
global:
  scrape_interval: 1m

scrape_configs:
  - job_name: 'prometheus'
    scrape_interval: 1m
    static_configs:
      - targets: ['localhost:9090']

  - job_name: 'docker'
    scrape_interval: 1m
    static_configs:
      - targets: ['cadvisor:8080']
Step-5: Write Docker-compose.yml file for Node-exporter
  node-exporter:
    image: prom/node-exporter:latest
    container_name: node-exporter
    restart: unless-stopped
    volumes:
      - /proc:/host/proc:ro
      - /sys:/host/sys:ro
      - /:/rootfs:ro
    command:
      - '--path.procfs=/host/proc'
      - '--path.rootfs=/rootfs'
      - '--path.sysfs=/host/sys'
      - '--collector.filesystem.mount-points-exclude=^/(sys|proc|dev|host|etc)($$|/)'
    ports:
      - "9100:9100"
    expose:
      - 9100
    networks:
      - monitoring
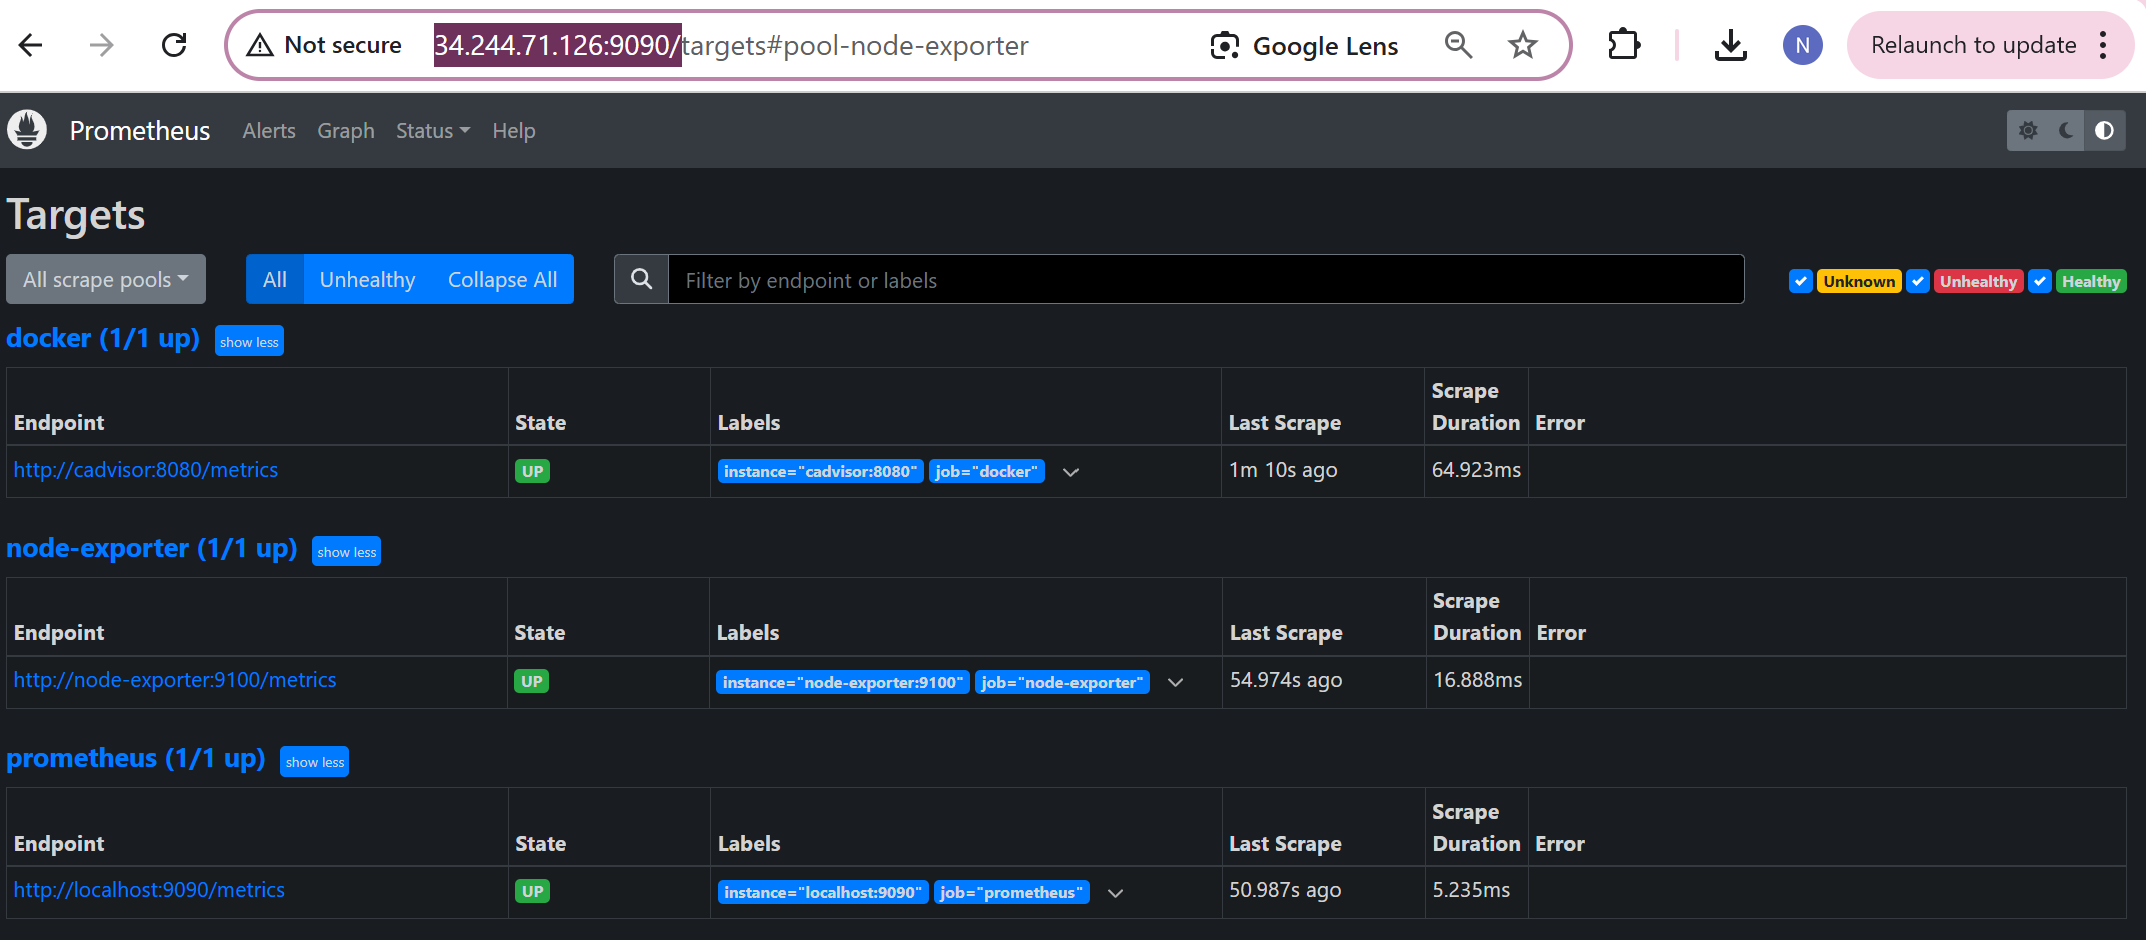
and add the container name of Node-exporter to the prometheus and cadvisor in the prometheus.yml
global:
  scrape_interval: 1m

scrape_configs:
  - job_name: 'prometheus'
    scrape_interval: 1m
    static_configs:
      - targets: ['localhost:9090']

  - job_name: 'docker'
    scrape_interval: 1m
    static_configs:
      - targets: ['cadvisor:8080']

  - job_name: 'node-exporter'
    scrape_interval: 1m
    static_configs:
      - targets: ['node-exporter:9100']
now use the below docker-compose commands,
docker coompose down
docker compose up -d
docker ps
docker images

#if any error or any issue check the logs of the container
docker logs <dockercontainer_id>
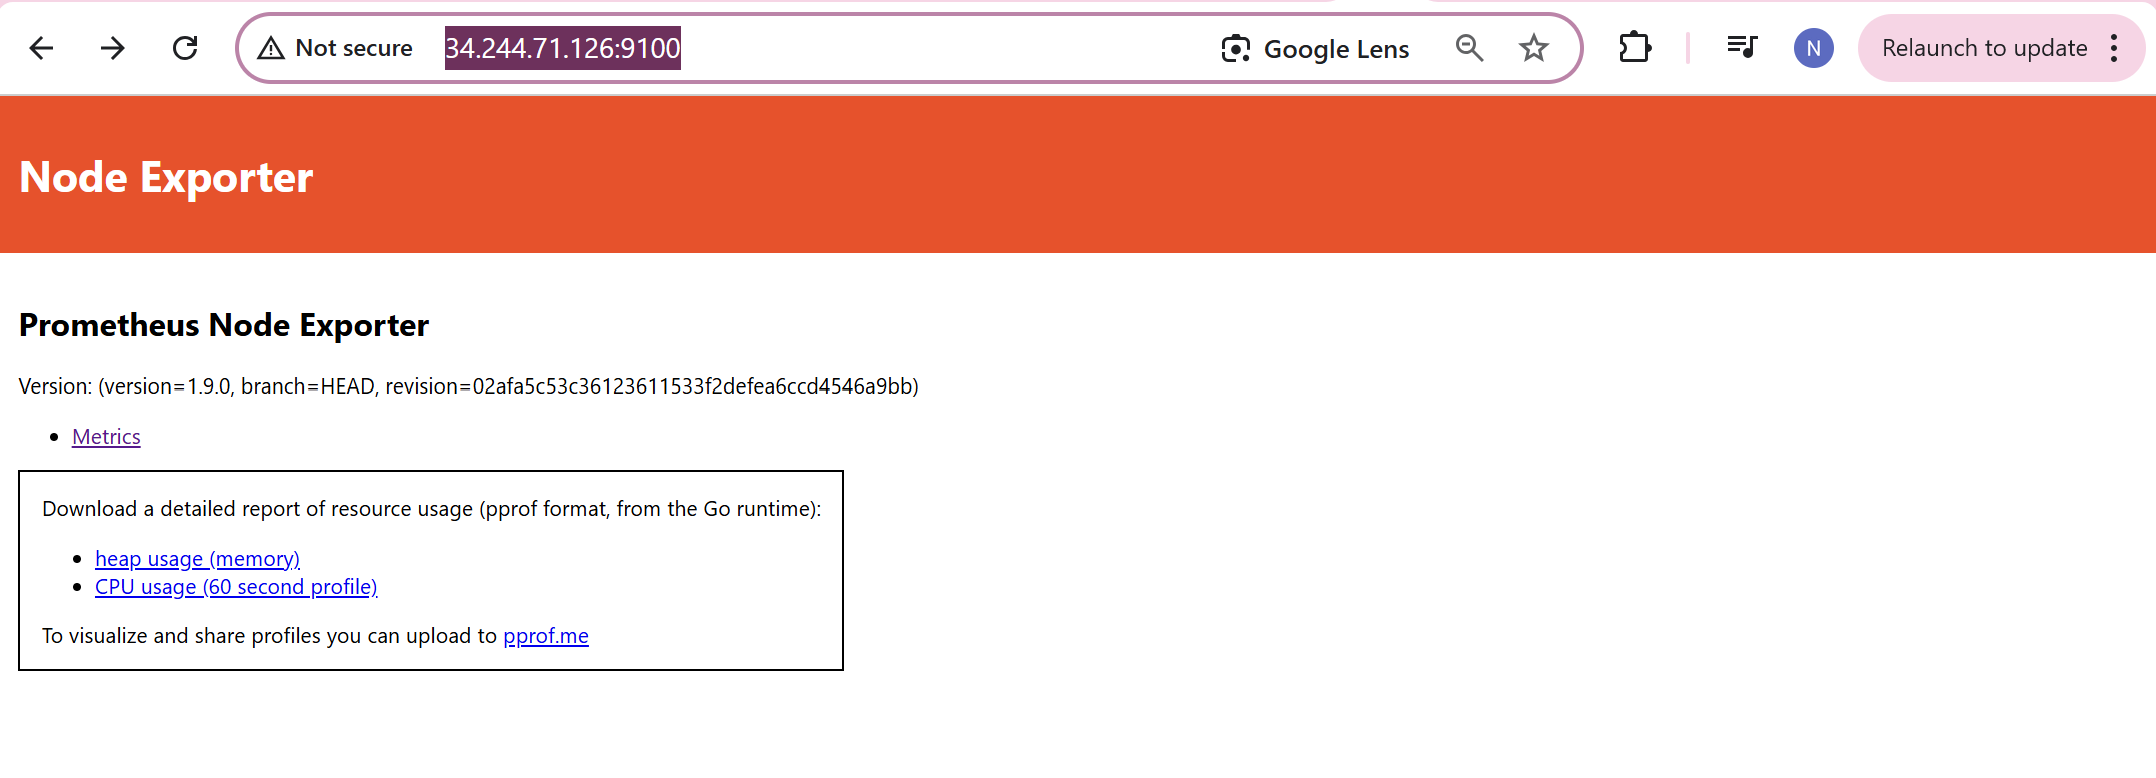
Once the container is running, use the public ip:9100
Open the port “9100” in the security group before accessing it.
Step-6: Write Docker-compose.yml file for Grafana
  grafana:
    image: grafana/grafana-enterprise
    container_name: grafana
    restart: unless-stopped
    ports:
      - '3000:3000'
    volumes:
      - grafana-storage:/var/lib/grafana
    networks:
      - monitoring
    depends_on:
      - prometheus
volumes:
   grafana-storage: {}
Use the same docker commands as we do and open security port “3000” for Grafana as below,
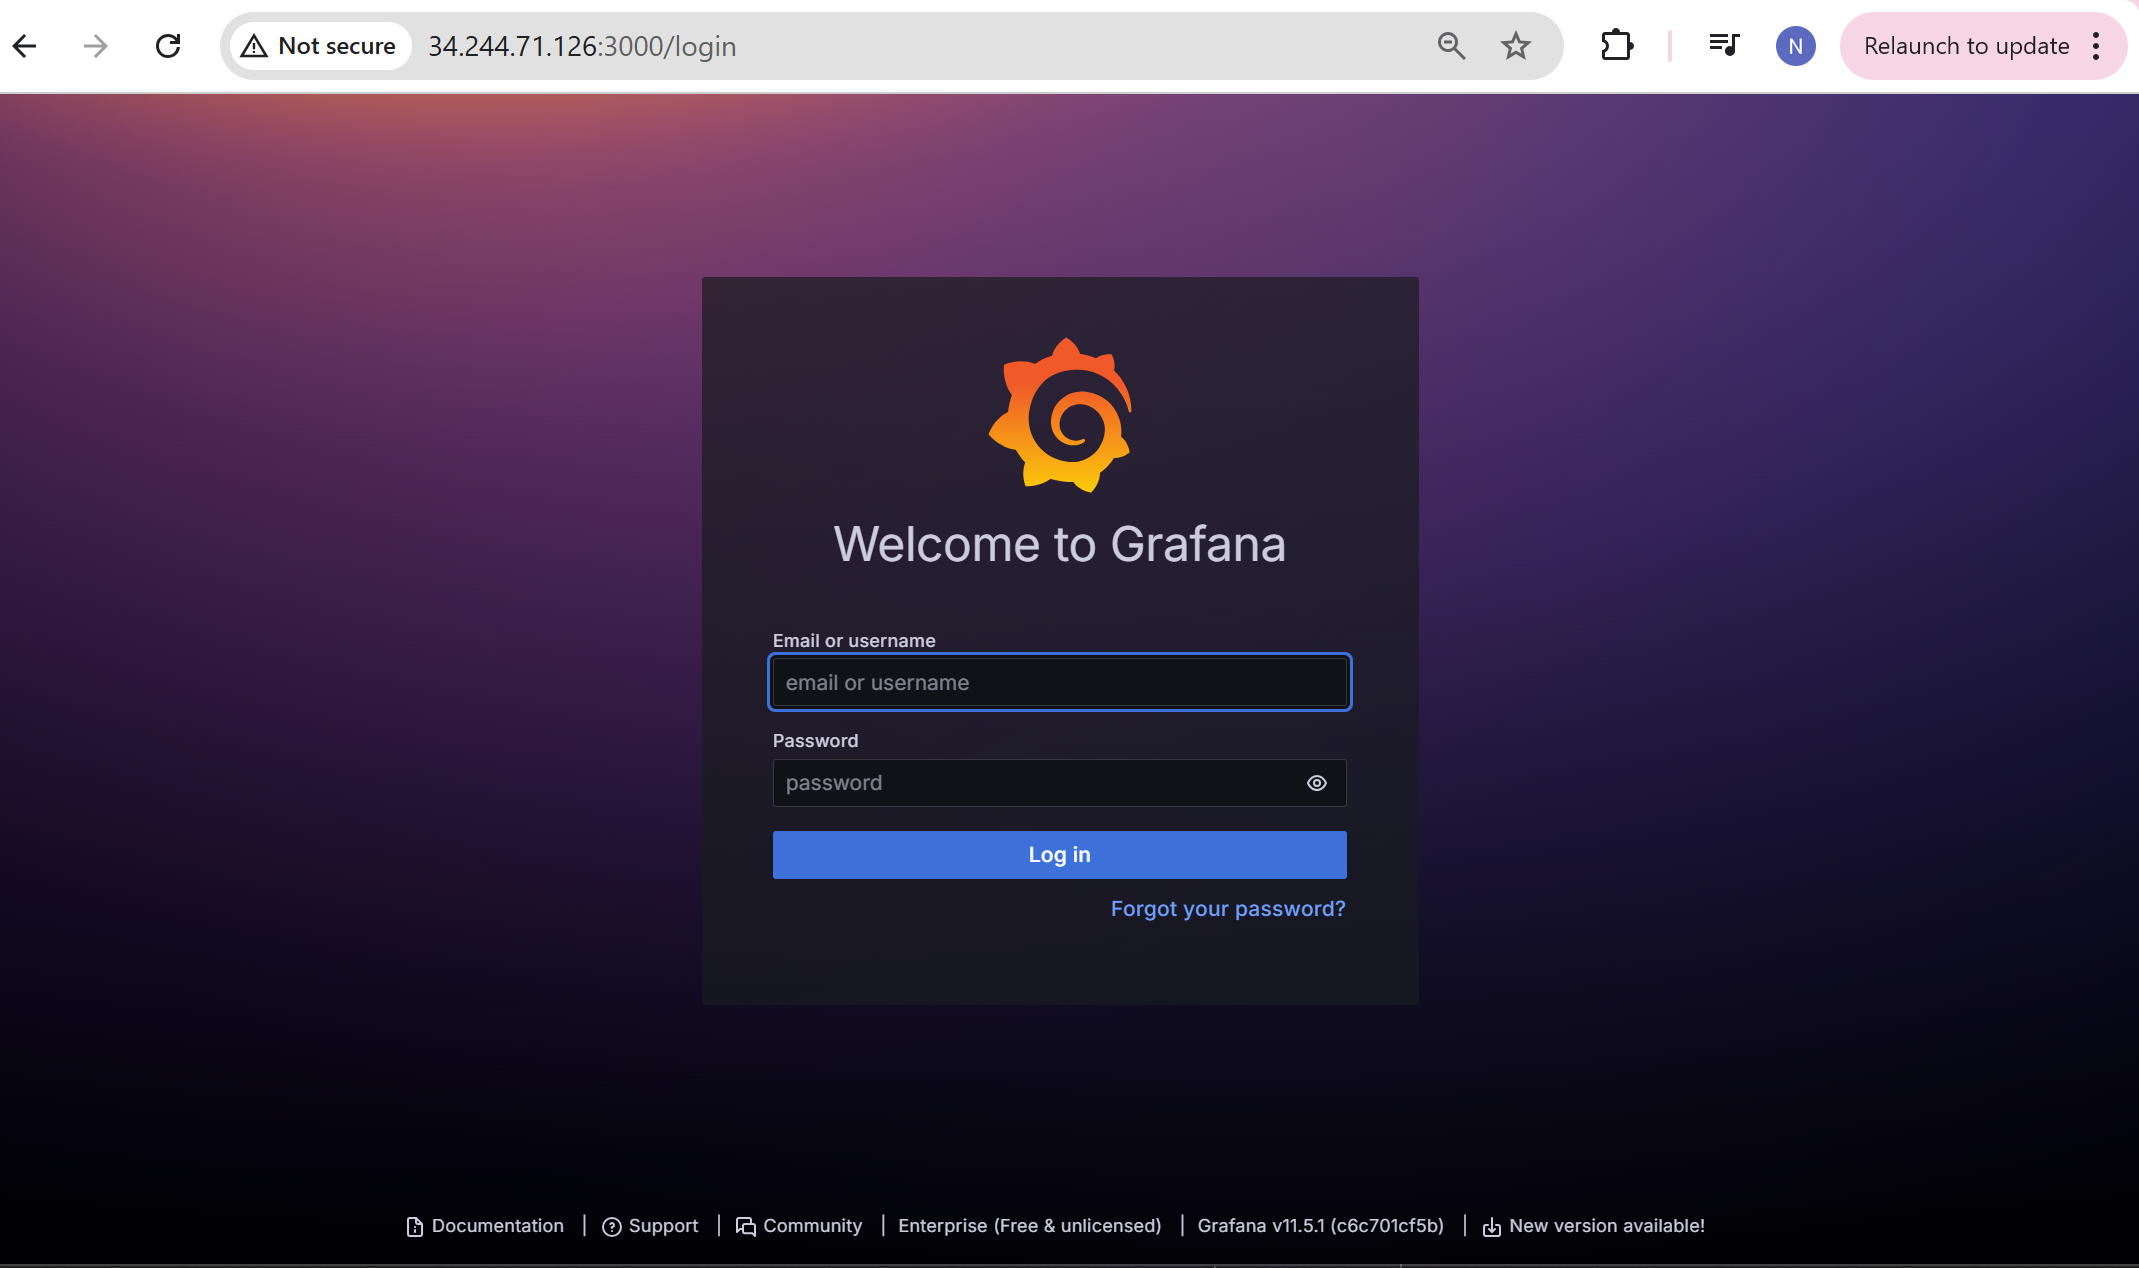
Once you login into Grafana, you can see the Welcome to Grafana as below,
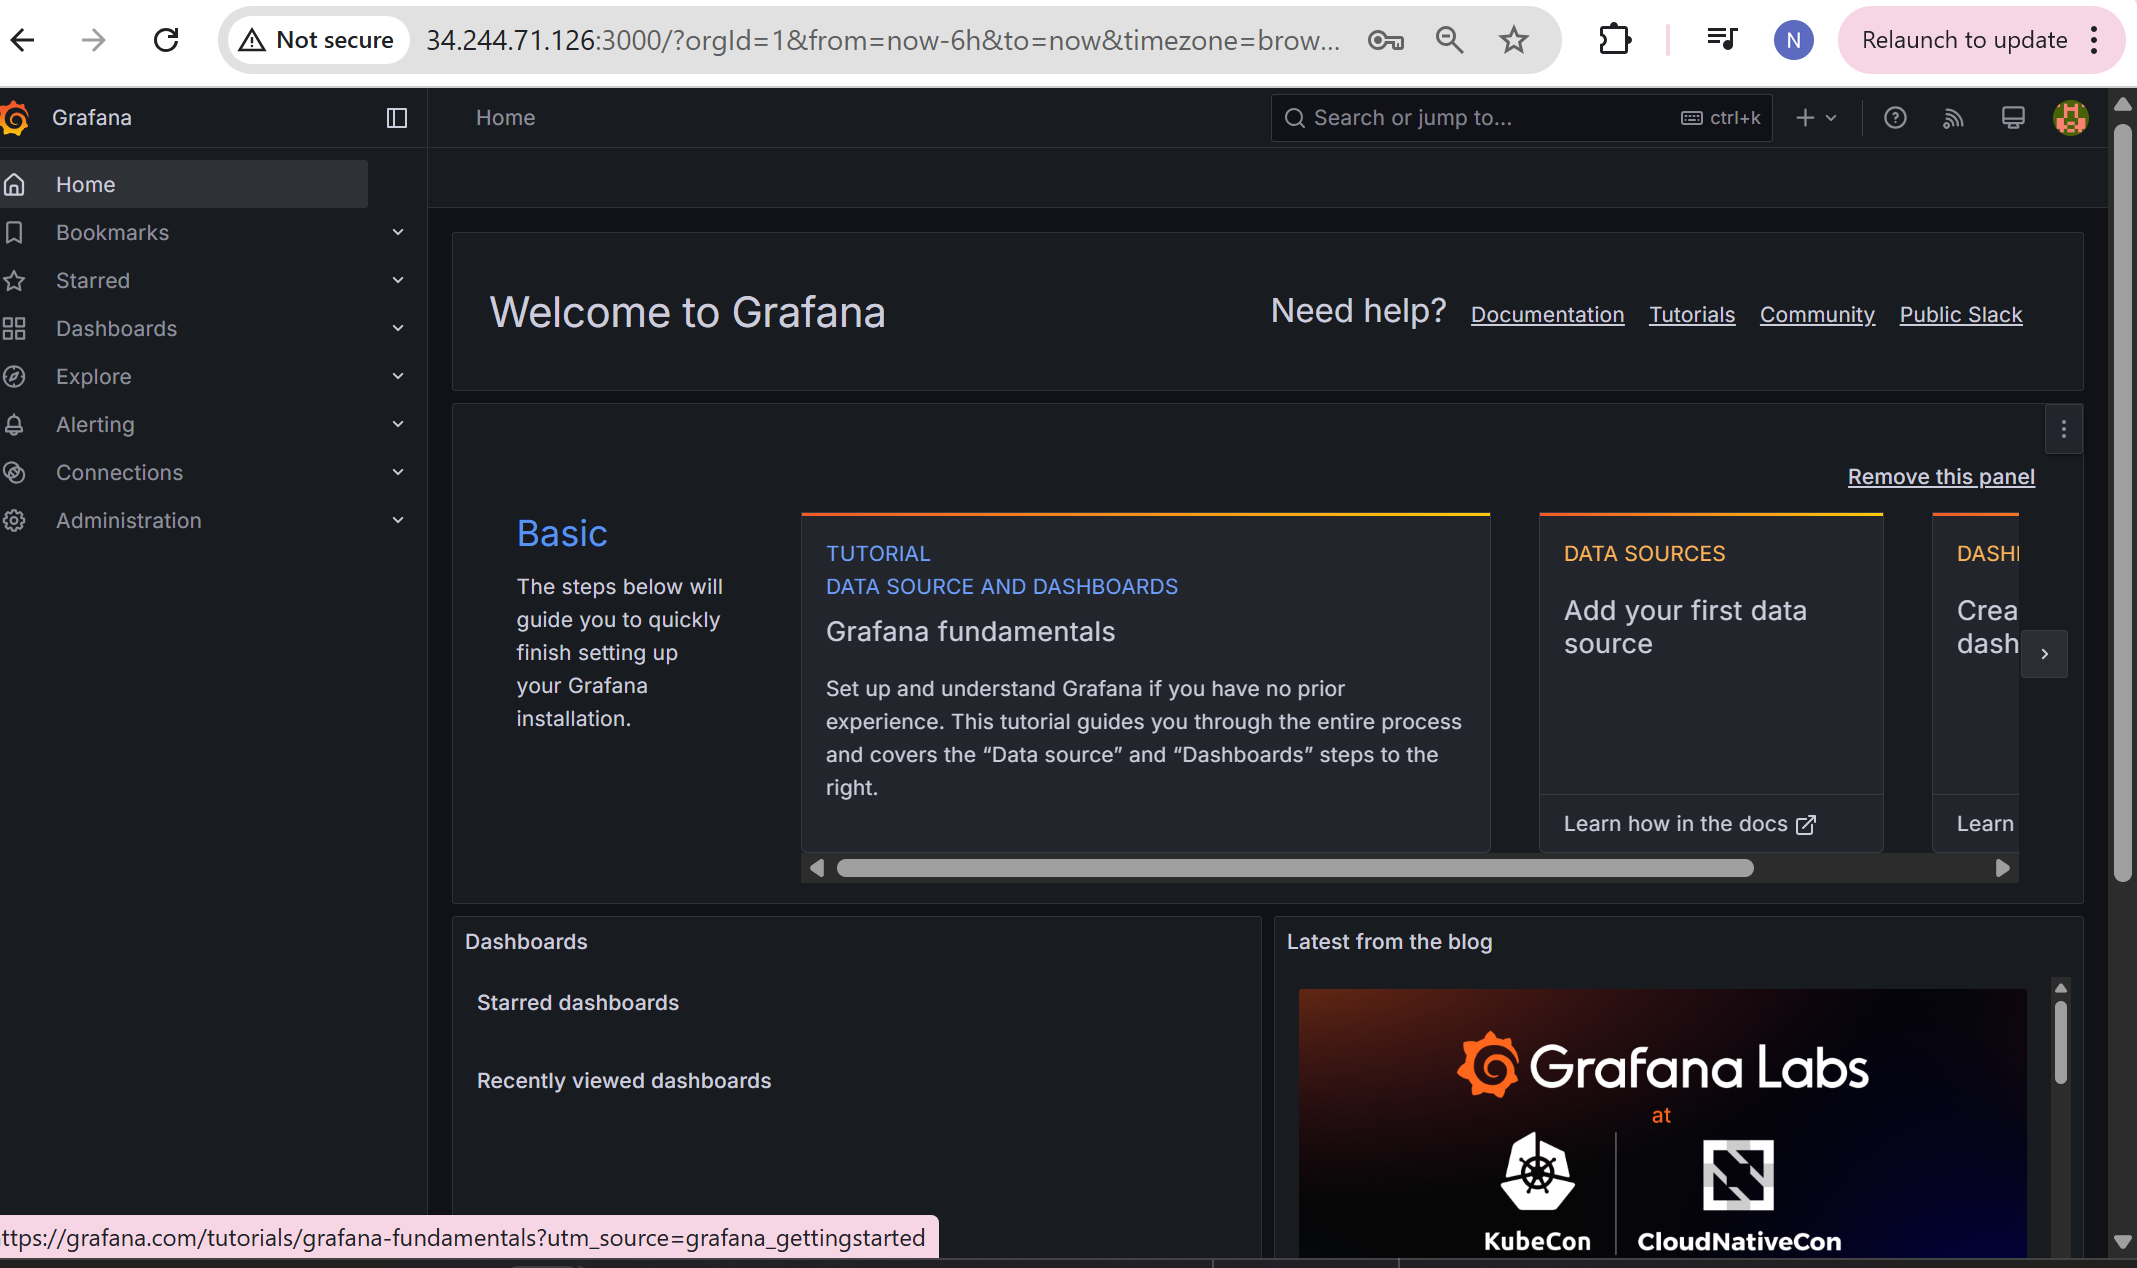
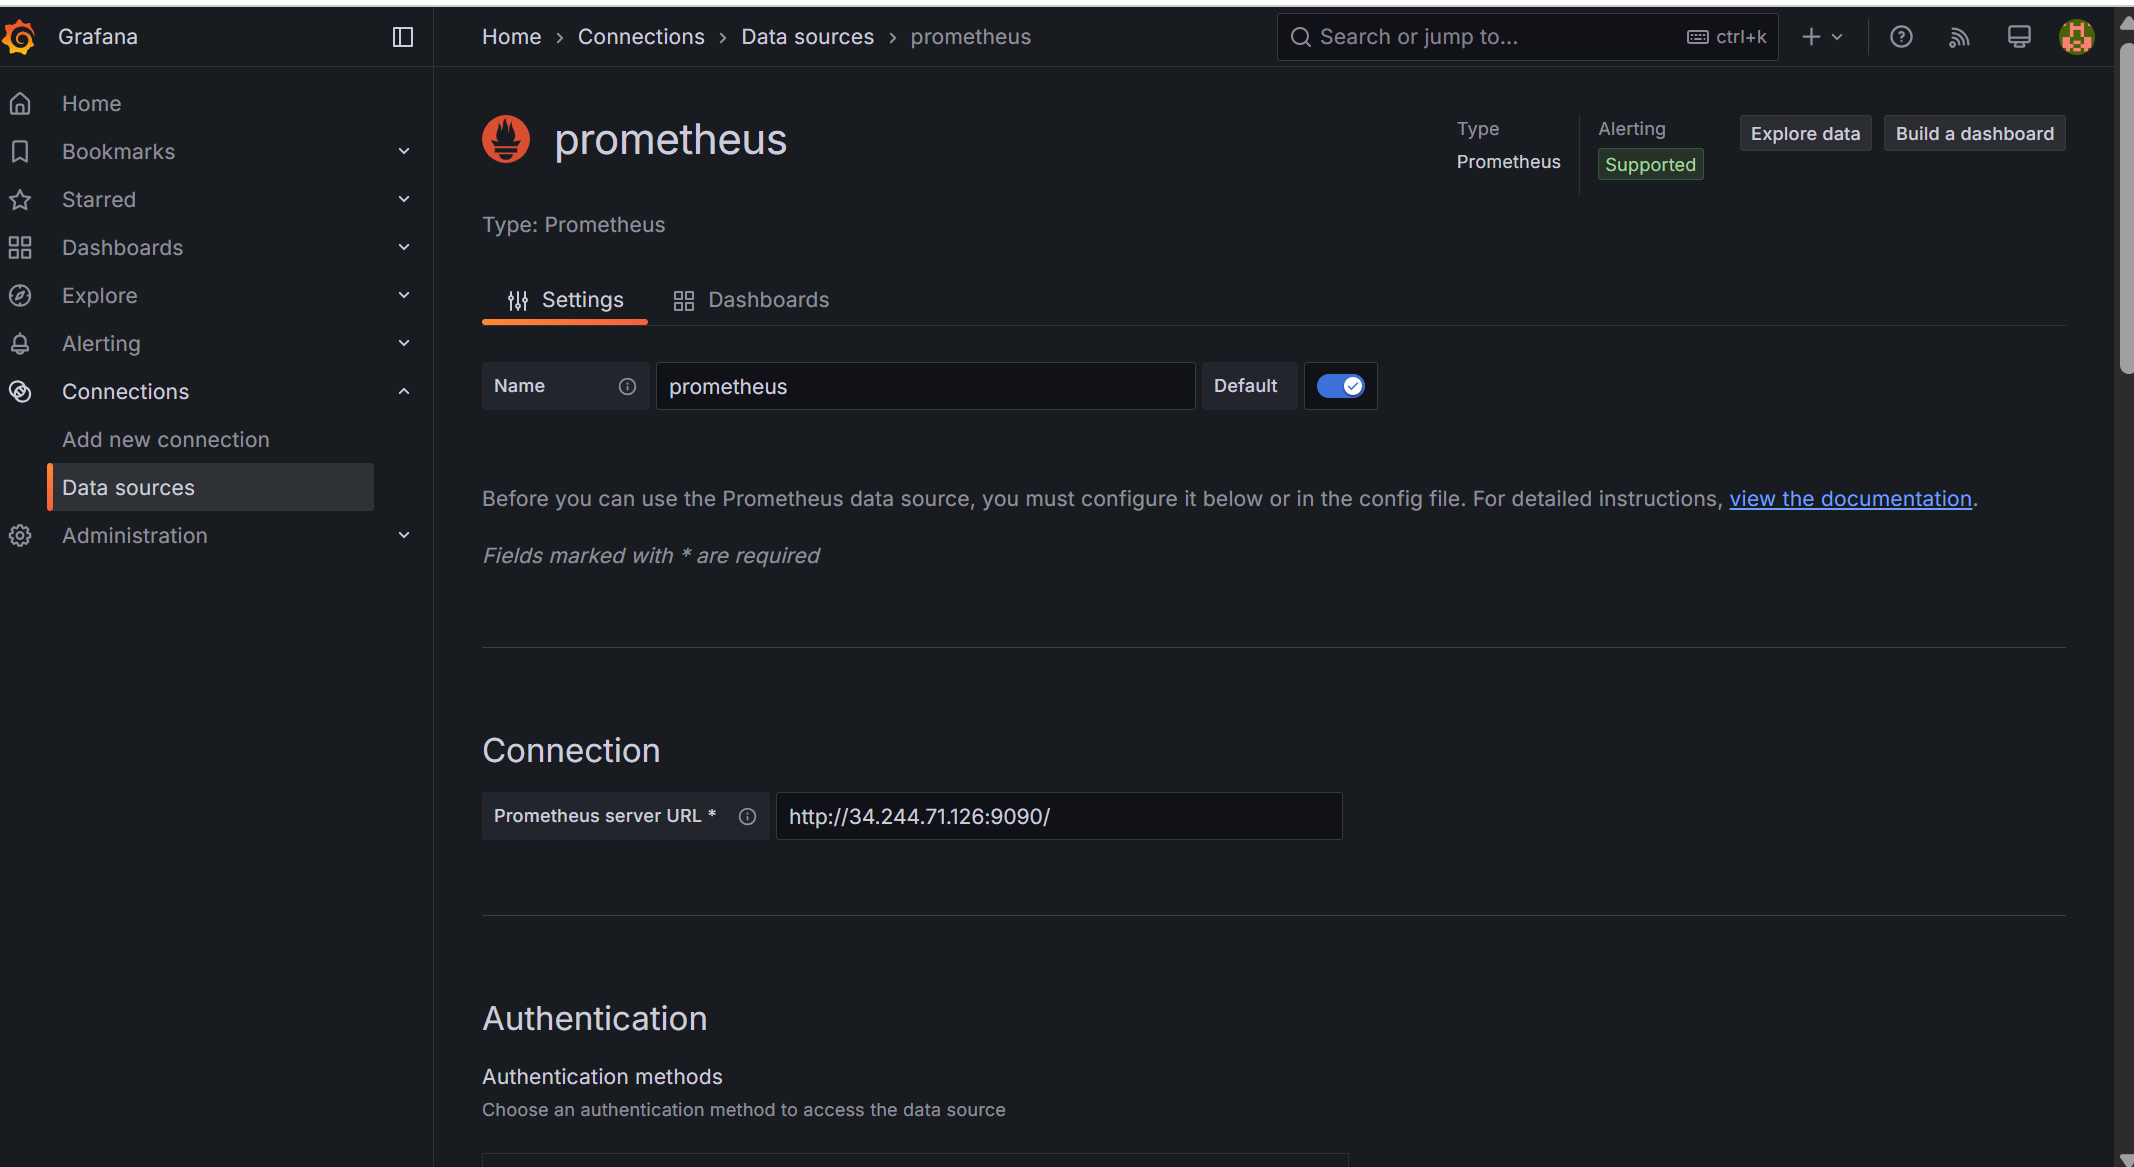
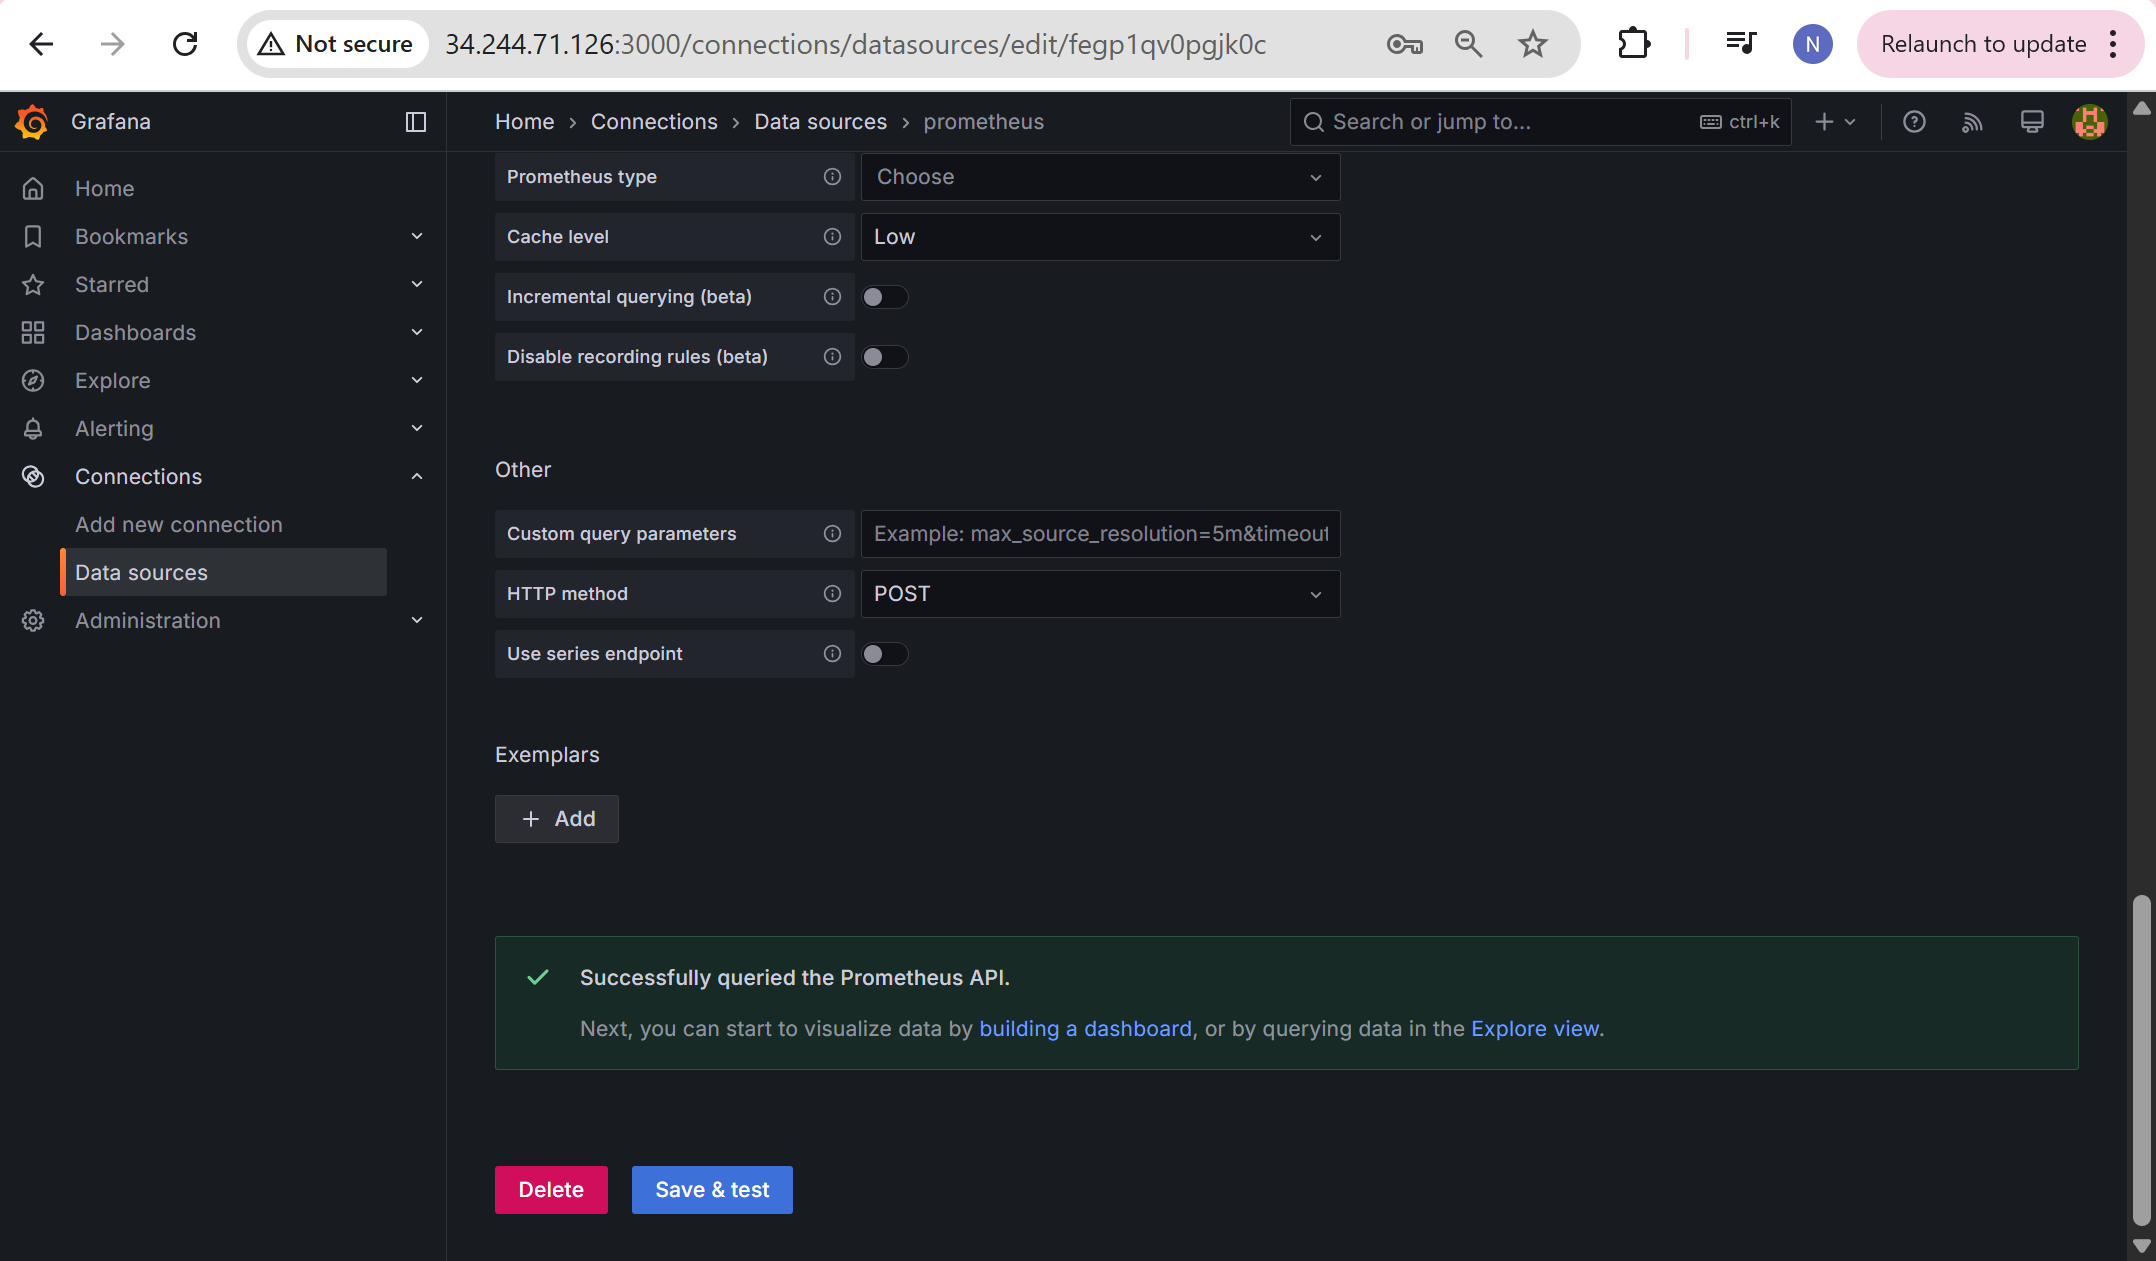
Here you can visualize and create Grafana Dashboards that we want to monitor. but before that we need to add connections for - prometheus as below,
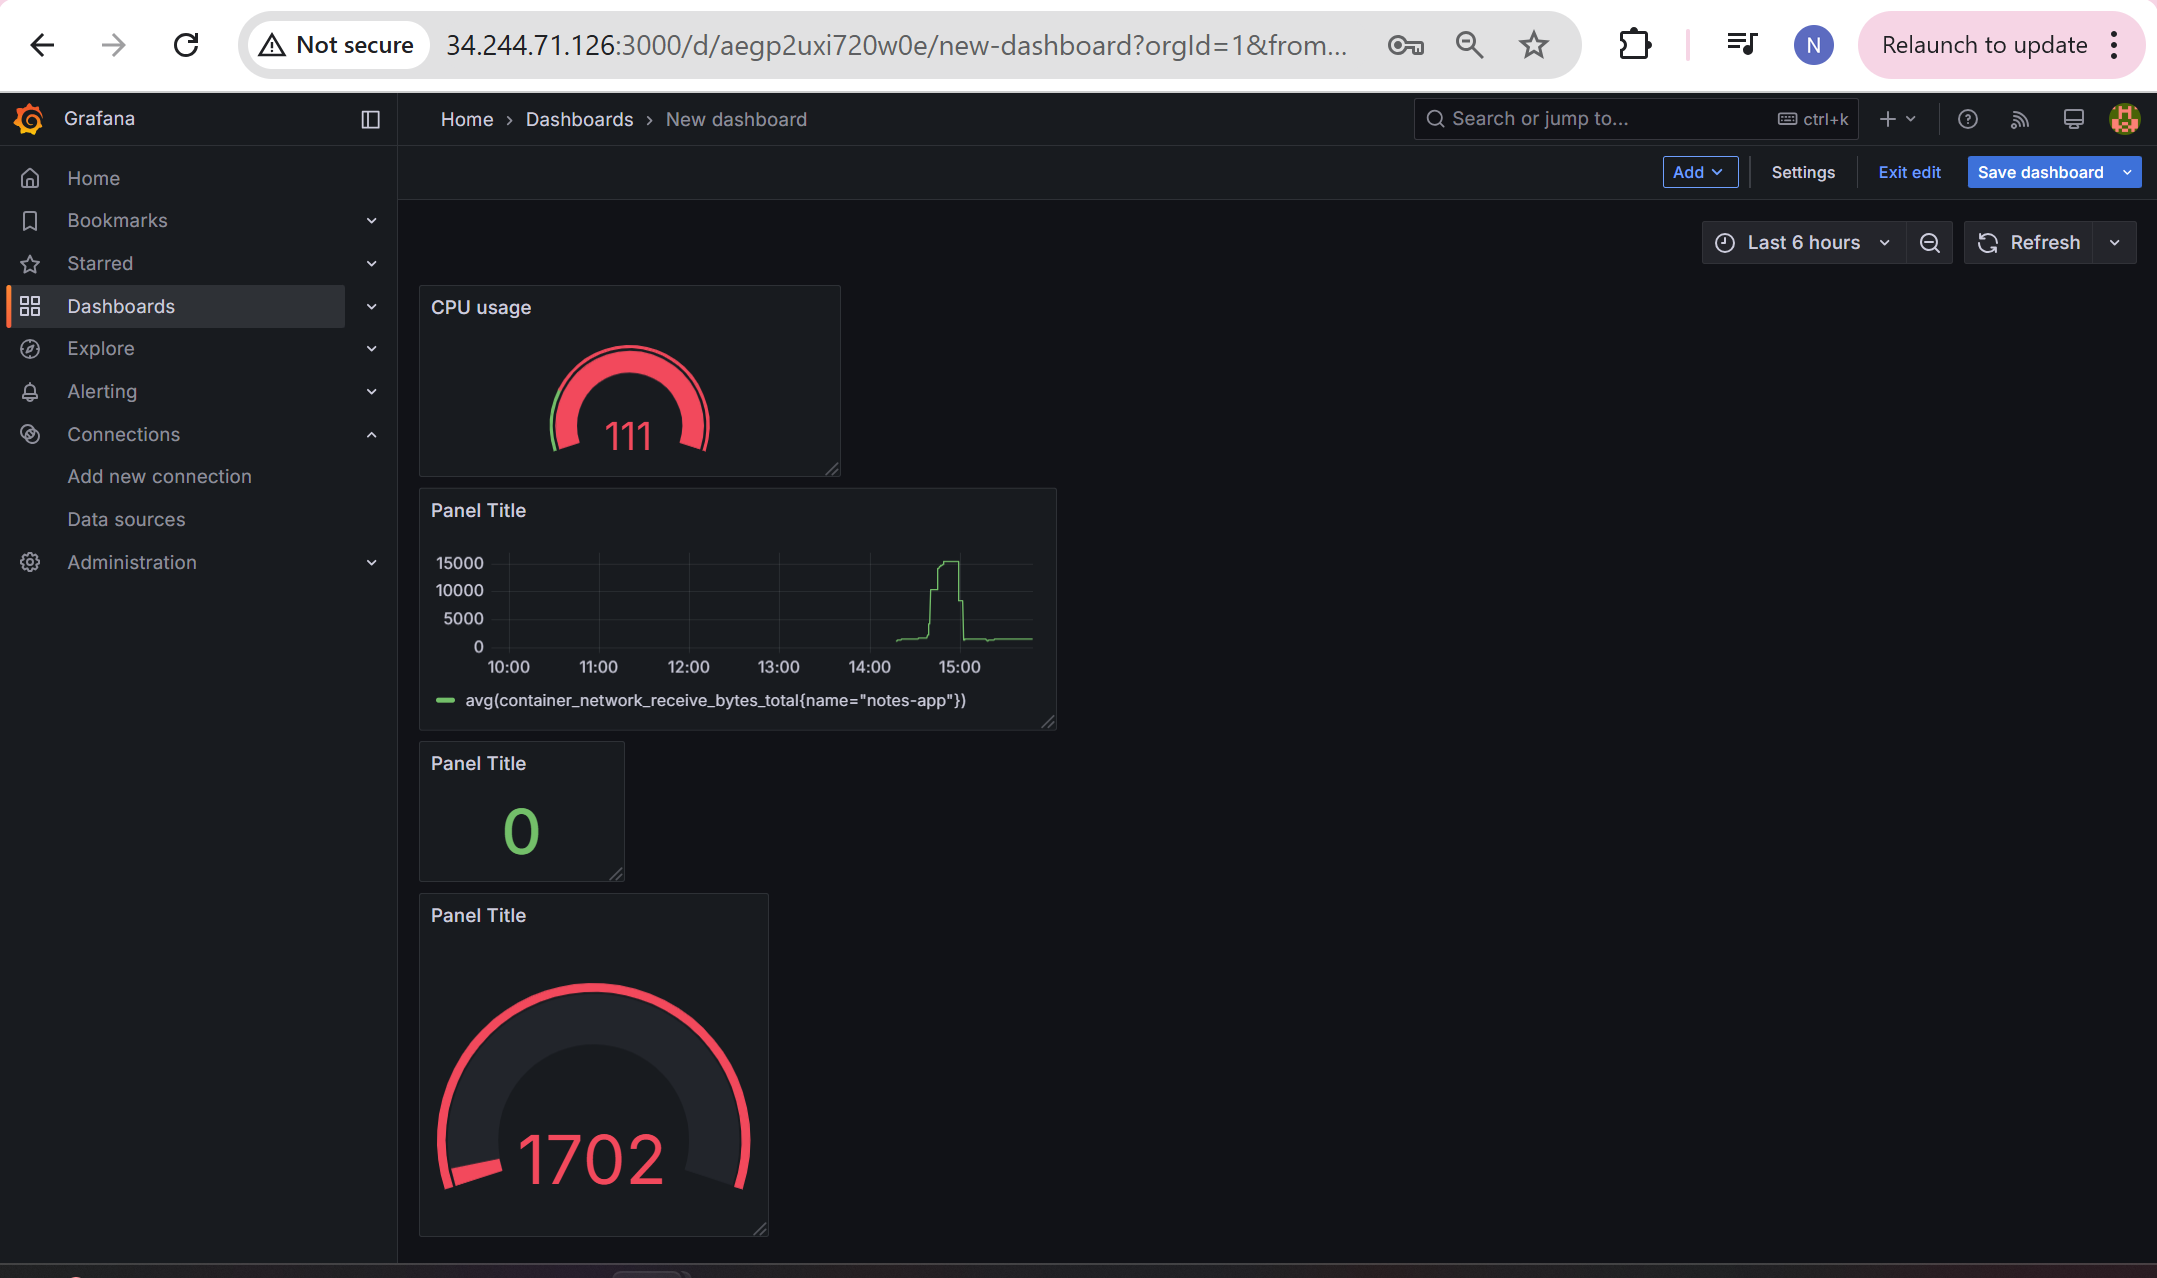
Here is the Dashboard i created using visualization in Grafana
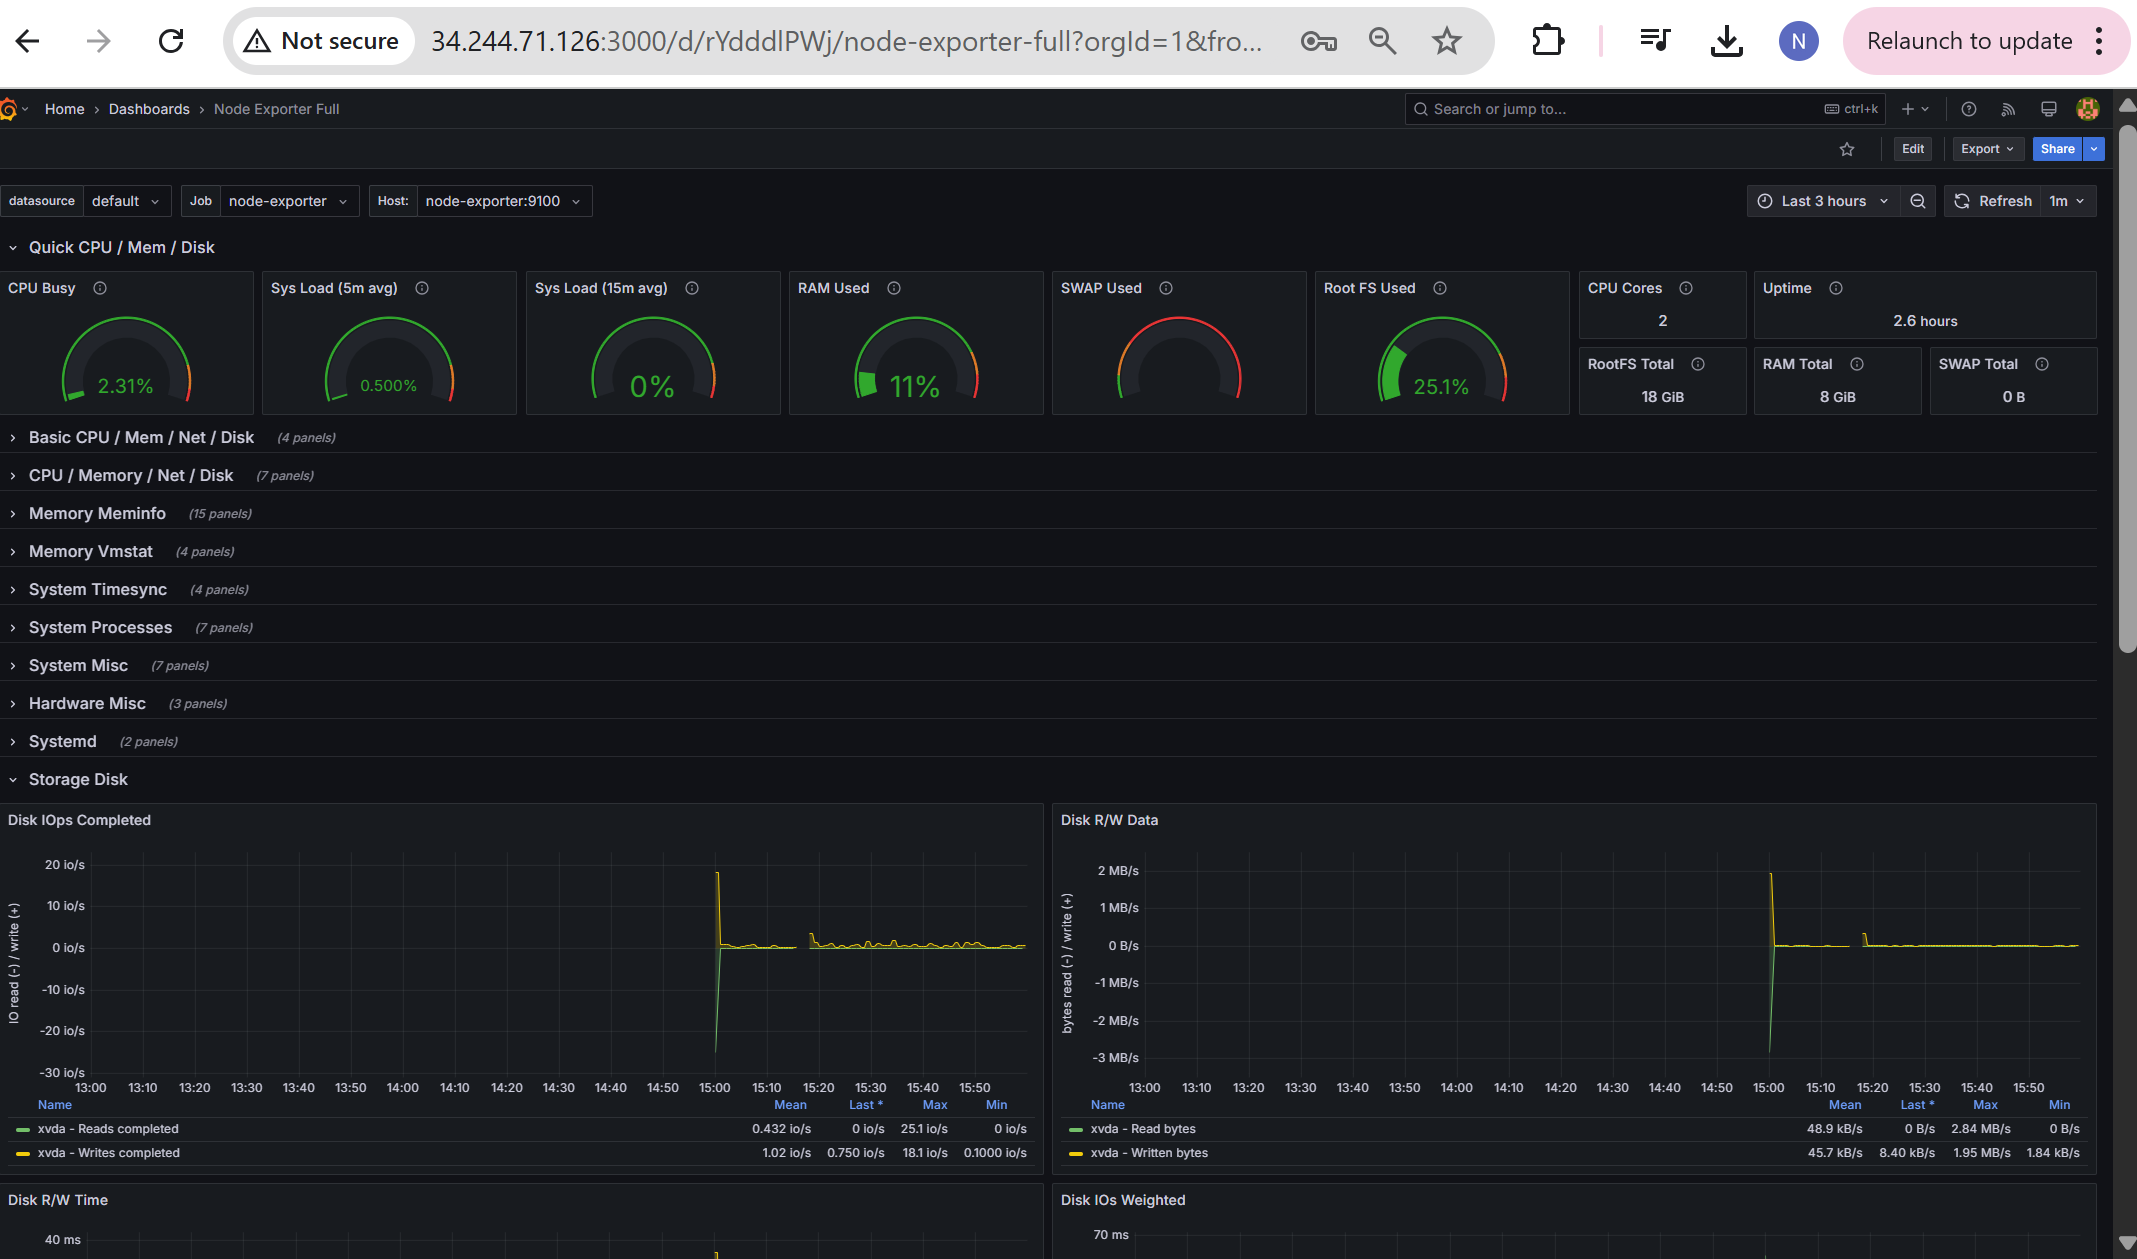
Step-7: Visualize it through the available Grafana Templates
Below is the Grafana Dashboard generated through the Grafana Template which is already available, we just have to import this Template into Grafana Dashboard and it creates amazing visualization showing all the levels of system as below,
Step-6: Add Loki and Promtail config to the Docker-compose.yml file
Loki and Promtail are mainly used for monitoring logs.
loki:
    image: grafana/loki:latest
    ports:
      - "3100:3100"
    command: -config.file=/etc/loki/local-config.yaml
    networks:
      - monitoring

  promtail:
    image: grafana/promtail:latest
    volumes:
       - /var/log:/var/log
    command: -config.file=/etc/promtail/config.yml
    networks:
      - monitoring
now again use the below docker-compose commands,
docker coompose down
docker compose up -d
docker ps
docker images
Now follow the same steps and Open the port for Loki “3100” and access it through the web browser,
it should be ready, when we access it like public ip:3100/ready

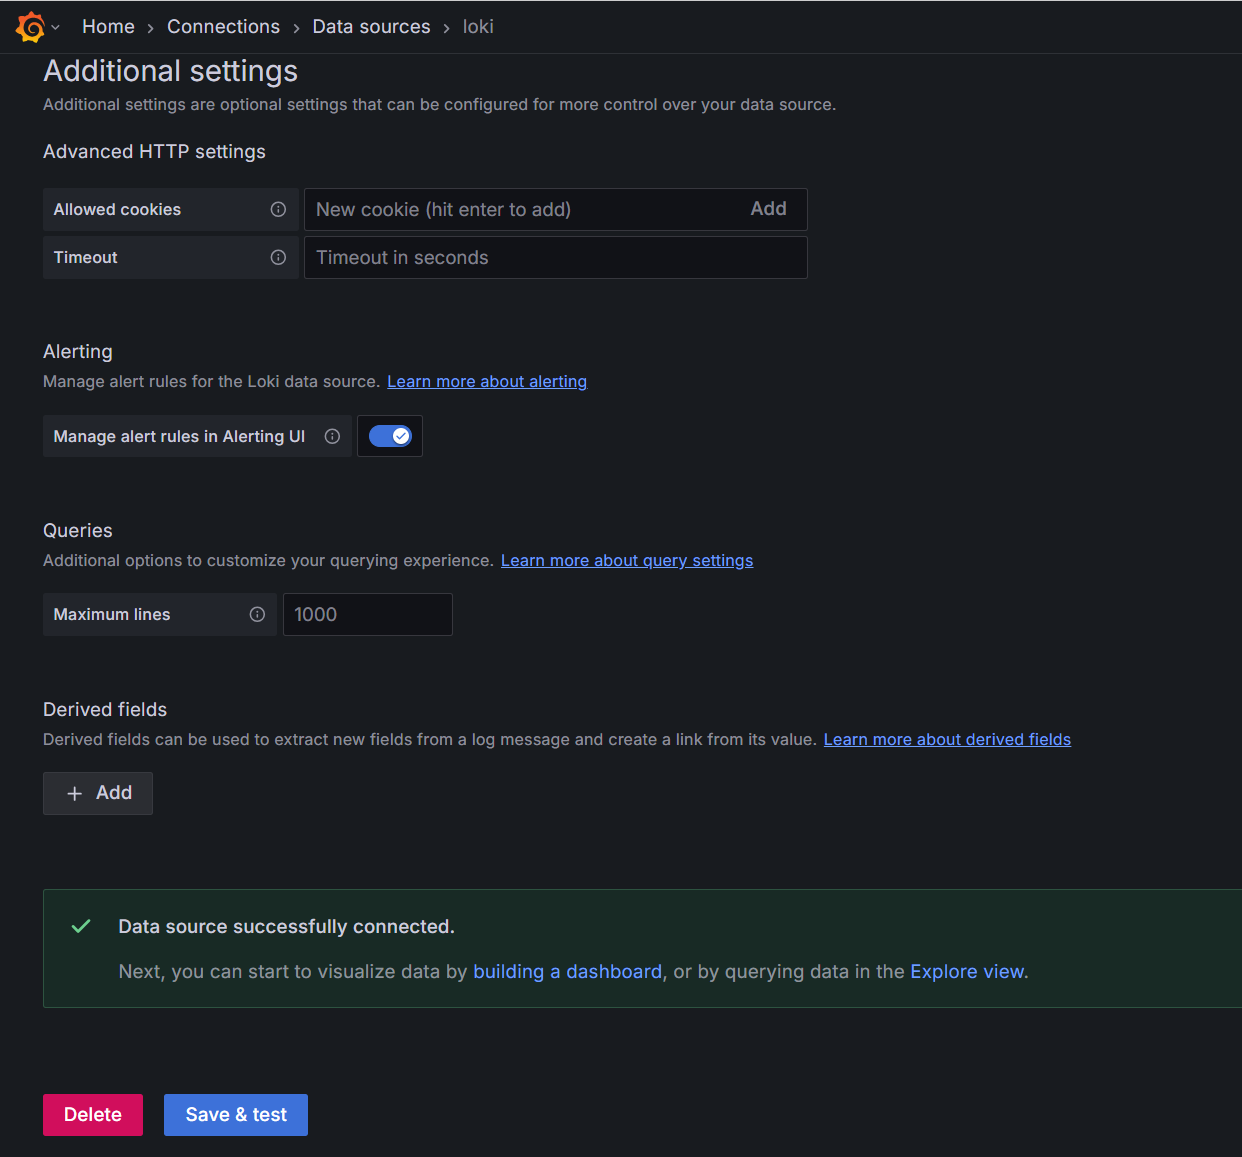
Add loki to Grafana Dashboard just like we did for prometheus
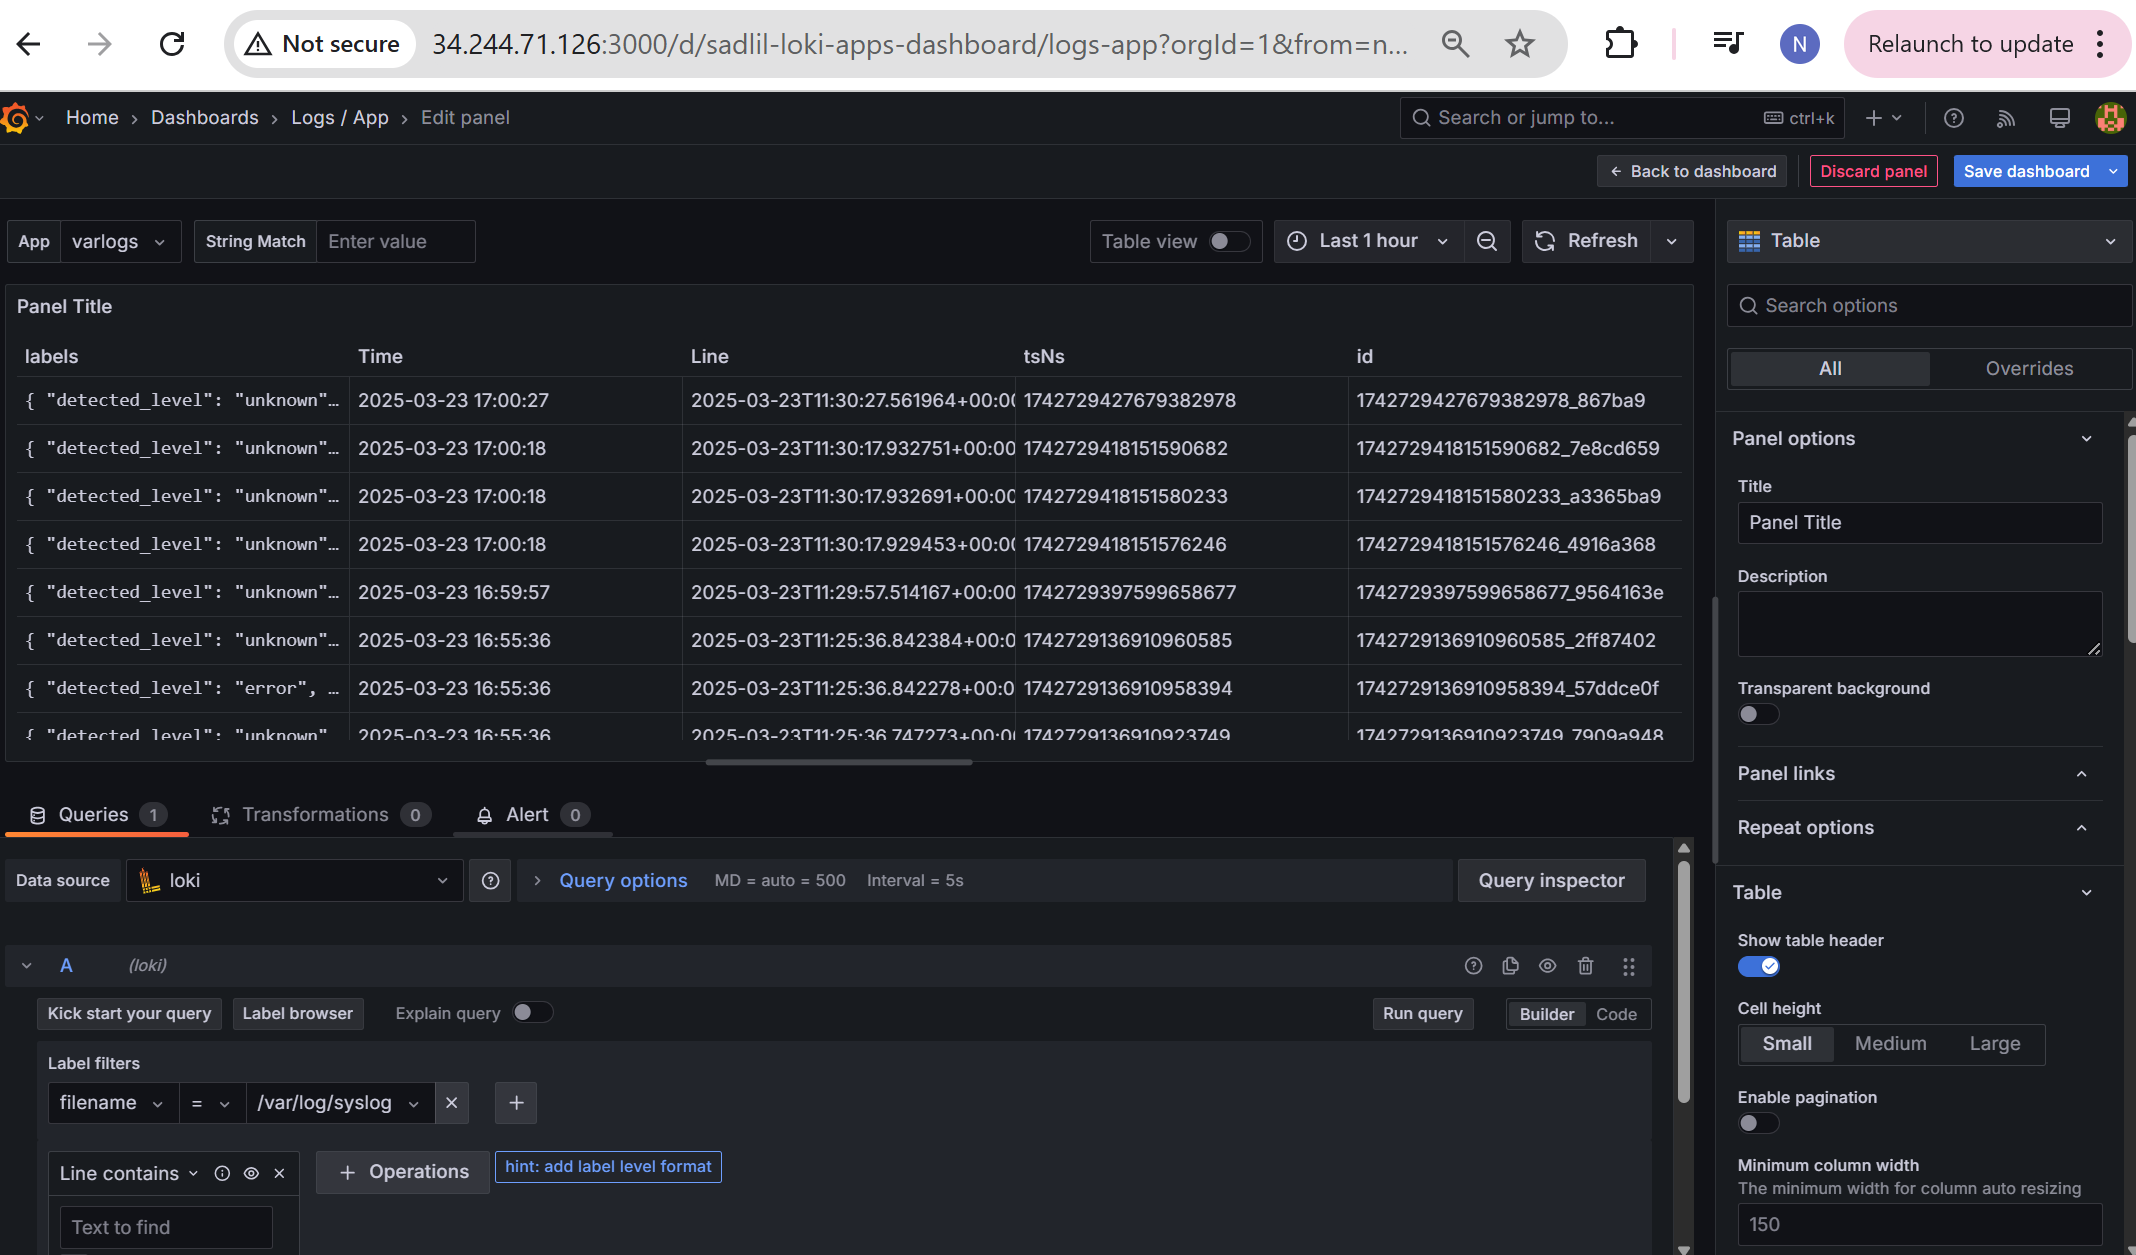
Now you can access the below logs of the django notes-application as below,
Here is the entire Docker-compose.yml file for the Django notes-app monitoring the metrics through “prometheus” and logs through “Loki” and finally visualization using “Grafana”
services:

  notes-app:
    build:
      context: ./notes-app
    ports:
      - "8000:8000"
    container_name: notes-app
    networks:
      - monitoring
    volumes:
      - ./notes-app:/app
    restart: always

  cadvisor:
    image: gcr.io/cadvisor/cadvisor:latest
    container_name: cadvisor
    ports:
    - 8080:8080
    volumes:
    - /:/rootfs:ro
    - /var/run:/var/run:rw
    - /sys:/sys:ro
    - /var/lib/docker/:/var/lib/docker:ro
    networks:
      - monitoring
    depends_on:
    - redis
  redis:
    image: redis:latest
    container_name: redis
    ports:
    - 6379:6379

  prometheus:
    image: prom/prometheus:latest
    container_name: prometheus
    restart: unless-stopped
    volumes:
      - ./prometheus.yml:/etc/prometheus/prometheus.yml
      - prometheus_data:/prometheus
    command:
      - '--config.file=/etc/prometheus/prometheus.yml'
      - '--storage.tsdb.path=/prometheus'
      - '--web.console.libraries=/etc/prometheus/console_libraries'
      - '--web.console.templates=/etc/prometheus/consoles'
      - '--web.enable-lifecycle'
    ports:
      - "9090:9090"
    expose:
      - 9090
    networks:
      - monitoring

  node-exporter:
    image: prom/node-exporter:latest
    container_name: node-exporter
    restart: unless-stopped
    volumes:
      - /proc:/host/proc:ro
      - /sys:/host/sys:ro
      - /:/rootfs:ro
    command:
      - '--path.procfs=/host/proc'
      - '--path.rootfs=/rootfs'
      - '--path.sysfs=/host/sys'
      - '--collector.filesystem.mount-points-exclude=^/(sys|proc|dev|host|etc)($$|/)'
    ports:
      - "9100:9100"
    expose:
      - 9100
    networks:
      - monitoring

  grafana:
    image: grafana/grafana-enterprise
    container_name: grafana
    restart: unless-stopped
    ports:
      - '3000:3000'
    volumes:
      - grafana-storage:/var/lib/grafana
    networks:
      - monitoring
    depends_on:
      - prometheus

  loki:
    image: grafana/loki:latest
    ports:
      - "3100:3100"
    command: -config.file=/etc/loki/local-config.yaml
    networks:
      - monitoring

  promtail:
    image: grafana/promtail:latest
    volumes:
       - /var/log:/var/log
    command: -config.file=/etc/promtail/config.yml
    networks:
      - monitoring

networks:
  monitoring:
    driver: bridge

volumes:
  prometheus_data: {}
  grafana-storage: {}
**
Conclusion:**
Incorporating Prometheus, Loki, Grafana, cAdvisor, Node-Exporter, and Promtail into the observability setup of the Django Notes-App provides a robust monitoring solution. Prometheus collects real-time metrics, while Loki and Promtail manage log aggregation for easy search and analysis. Grafana delivers powerful data visualization through customizable dashboards, helping quickly identify and address issues. cAdvisor tracks container health, and Node-Exporter provides insights into host-level performance. This comprehensive observability stack ensures proactive monitoring, fast issue resolution, and continuous optimization of the Django Notes-App’s performance.
Subscribe to my newsletter
Read articles from Nikitha Jain directly inside your inbox. Subscribe to the newsletter, and don't miss out.
Written by
