Day 6: Introduction to Regression Models : Linear Regression
 Saket Khopkar
Putting forth the concept of Regression in simple words: Regression is a supervised learning technique used to predict a continuous numerical value based on input features.
Before we dive any further, let us recap, what is supervised learning once:
Unlike classification, which predicts categorical outcomes, regression aims to predict continuous values, such as house prices, temperature, or stock prices. This is one of the basic difference between Classification and Regression. You may want to have a look at this topic later, as it is asked in many interviews too.
Basic Example
Imagine you’re running a hiring company. You collect data on employees' years of experience and their salaries. You want to predict a new employee’s salary based on their experience.
| Experience (in Years) | Salary (in $) |
| 1 | 30,000 |
| 3 | 50,000 |
| 5 | 70,000 |
| 7 | 90,000 |
| 10 | 1,20,000 |
Here is where Regression comes into picture. Based on the relationships of the two parameters, an oragnzation may find it easier to decide the salary-scale of a new hire based on the relationship between these two fields. The relationship is matematical, however it might come handy at times, saving a bit of discussion time by making easy predictions.
Types of Regression Models
There are 3 types of Regression Models:
Linear Regression
Multiple Regression
Polynomial Regression
| Model | Purpose | Example |
| Linear Regression | Predict a value, using straight line relationship | Predicting House Prices based on size |
| Multiple Regression | Predict a value, using multiple values | Predicting car price using Horsepoer, Mileage and Brand |
| Polynomial Regression | Capture curved relationships between variables | Predicting population growth over the time |
This blog will provide you a gentle introduction on Regression models. We will also look at introduction and practical implementation of Linear Regression Model.
Linear Regression
Linear Regression finds the best-fitting straight line between two variables (one independent & one dependent). The equation is:
Y = mX + b

Y = Predicted Value (e.g., House Price)
X = Input Feature (e.g., House Size in square feet)
m = Slope of the line (shows how much Y changes when X changes)
b = Intercept (where the line crosses the Y-axis)
These concepts were covered in-depth in Mathematics textbooks long back (as I remember); you may take a look at those at your convenince.
Now here is the code:
import pandas as pd
import numpy as np
import matplotlib.pyplot as plt
from sklearn.model_selection import train_test_split
from sklearn.linear_model import LinearRegression

# 1. Creating the dataset
data = {
    "House_Size": [1000, 1500, 2000, 2500, 3000],
    "Price": [200000, 250000, 300000, 350000, 400000]
}
df = pd.DataFrame(data)

# 2. Splitting data into features (X) and target (Y)
X = df[["House_Size"]]
y = df["Price"]

# 3. Splitting into training and testing sets
X_train, X_test, y_train, y_test = train_test_split(X, y, test_size=0.2, random_state=42)

# 4. Training the Linear Regression Model
model = LinearRegression()
model.fit(X_train, y_train)

# 5. Making Predictions
predicted_prices = model.predict(X_test)

# 6. Visualizing the results
plt.scatter(X, y, color="blue", label="Actual Prices")
plt.plot(X, model.predict(X), color="red", label="Regression Line")
plt.xlabel("House Size (sq ft)")
plt.ylabel("Price ($)")
plt.legend()
plt.title("House Size vs Price")
plt.show()
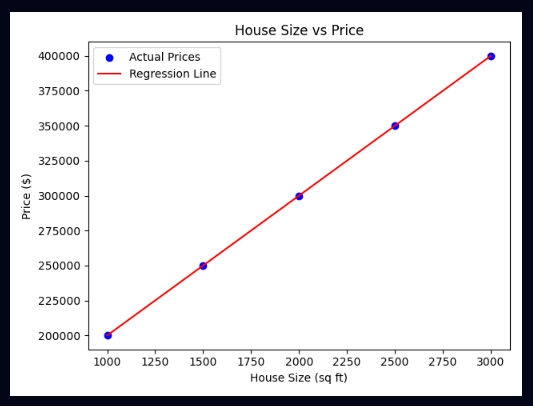
The output for the same is:

Now if even someone comes up with some arbitrary value such as 2350, by formulating we can check the price. The concept is intercept is also simple; if we draw a straight line from one dimension, the point where it collides with the sloping Regression line is basically an intercept. It helps greatly in prediction as you might have guessed in above case.
Evaluating Linear Regression Models
Well, after our model has given us the inputs, we might get curious at times to check how accurate our model was. Was it trustworthy? or just a trash one? Before making any predictions, if we evaluate the accuracy of our model, it might help us in making better predictions in near future.
Let us have a look at some of the techniques used:
Mean Absolute Error (MAE)
It measures how much the predictions deviate from actual values.
The formula for the same is:

Uh, since mathematics explaination can be a bit awry here, in python, there are readymade methods for the same. As we are more code-inclined anyway, here is how it will look in a code;
from sklearn.metrics import mean_absolute_error

mae = mean_absolute_error(y_test, predicted_prices)
print(f"Mean Absolute Error: {mae:.2f}")
Mean Squared Error (MSE)
This is almost similar to MAE but only difference being that it squares up the errors, making large errors more significant.
Formula for the same is:

from sklearn.metrics import mean_squared_error

mse = mean_squared_error(y_test, predicted_prices)
print(f"Mean Squared Error: {mse:.2f}")
R² Score (Coefficient of Determination)
This tells us how well model fits with the data. A model is said to be perfect with this regard if it has a score of 1.0
Have a look at the formula below:

from sklearn.metrics import r2_score

r2 = r2_score(y_test, predicted_prices)
print(f"R² Score: {r2:.2f}")
You are free to explore MAE, MSE and R² Score as topics on your own.
Okay, time to take final notes:
We came to know what Regression is, what is its meaning and all. Regression is used to predict continuous values (e.g., house prices, salaries).
We also had an gentle introduction to Linear Regression which finds the best straight-line relationship between variables. Python's LinearRegression() makes it easy to train and predict using regression models.
Evaluating the model using MAE, MSE, and R² helps determine accuracy; the more the accuracy, the trustworthy the model.
As this blog serves as only introduction part for many concepts, it will be best if you look into the concepts discussed in this blog in more depth on the web; as we cannot tend to cover everything here. I will be back with Day 7 concept soon.
Ciao!!
Subscribe to my newsletter
Read articles from Saket Khopkar directly inside your inbox. Subscribe to the newsletter, and don't miss out.
Written by

Saket Khopkar
Saket Khopkar
Developer based in India. Passionate learner and blogger. All blogs are basically Notes of Tech Learning Journey.