Setting up Prometheus metrics and Grafana dashboard by provisioning it on Ec2 instance using terraform and docker compose.
 Sandeep Kumar
Below is the summary:.
The tf is manually written by me as a practice task to get wellversed with the basic syntax.
There is a lot of room to make it secure and robust. I am aware about it. This is just a demo.
Below is the summary:
Created a ec2.tf (main.tf) file
Created a variable.tf
Created a shell script which configures installs- Prometheus, Grafana and nginx using docker compose
Calling user data function in my main.tf which executes the shell script
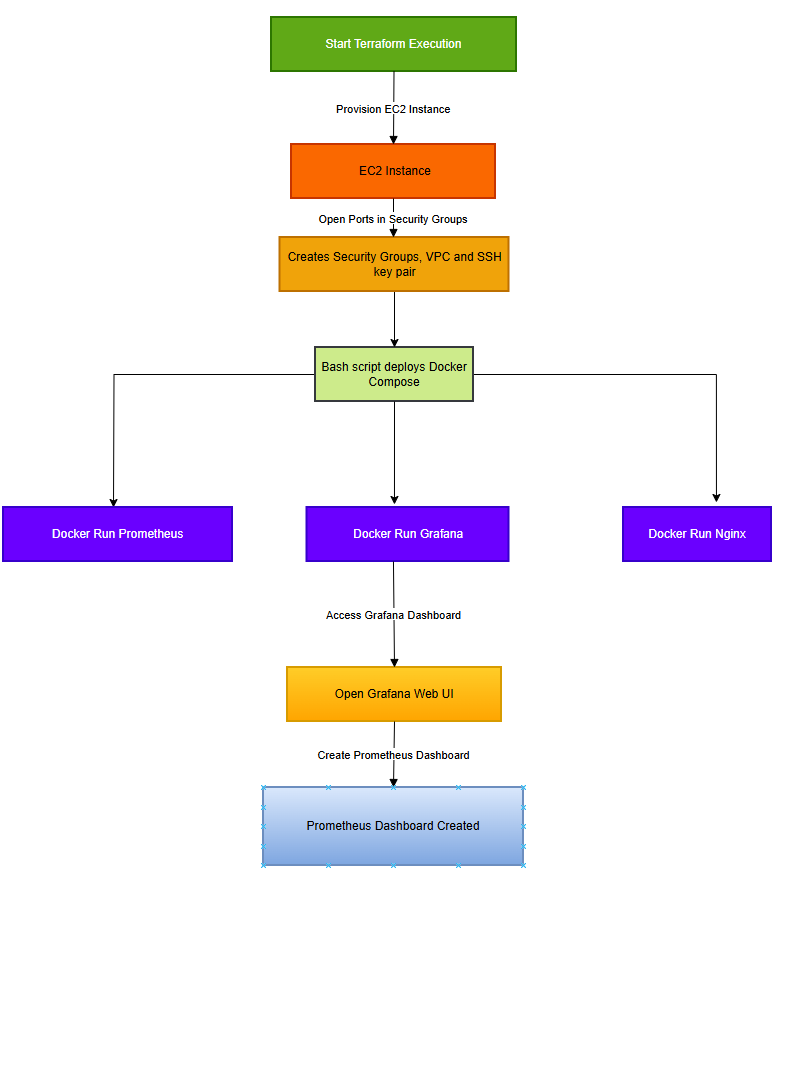
Uses AWS’s default VPC for networking.
Creates an SSH key pair for login.
Creates a security group allowing SSH, HTTP, Flask, Grafana, and Prometheus traffic.
Deploys an EC2 instance with a specific AMI, storage, and security settings.
Runs an initialization script (
install_prometheus.sh) to set up Prometheus and Grafana.```yaml
key pair (login)
resource "aws_key_pair" "key-ec2" { key_name = "terra-key-ec2" public_key = file("terra-key-ec2.pub") } #vpc & security group resource "aws_default_vpc" "default" { tags = { Name = "Default VPC" } }
resource "aws_security_group" "my_sg" { name ="sg" description = "this will create security group" vpc_id = aws_default_vpc.default.id
#inbound rules ingress {
from_port = 22 to_port = 22 protocol ="tcp" cidr_blocks = ["0.0.0.0/0"] description = "ssh open" }
ingress { from_port = 80 to_port = 80 protocol = "tcp" cidr_blocks = ["0.0.0.0/0"] description = "http open" }
ingress { from_port = 8000 to_port = 8000 protocol = "tcp" cidr_blocks = ["0.0.0.0/0"] description = "flask app" }
ingress { from_port = 3000 to_port = 3000 protocol = "tcp" cidr_blocks = ["0.0.0.0/0"] description = "Grafana" }
ingress { from_port = 9090 to_port = 9090 protocol = "tcp" cidr_blocks = ["0.0.0.0/0"] description = "prometheus" }
#outbound rules egress{ from_port = 0 to_port = 0 protocol = "-1" cidr_blocks = ["0.0.0.0/0"] description = "This is outbound rule"
}
tags = { Name = "sg" }
}
#ec2 instance
resource "aws_instance" "my_instance" { instance_type = var.ec2_instance_type key_name = aws_key_pair.key-ec2.key_name security_groups = [aws_security_group.my_sg.name] ami = var.ec2_ami_id user_data = file("install_prometheus.sh") root_block_device { volume_size = var.ec2_storage_block volume_type = "gp3" }
tags={ Name = "Terra"
} }
    Variables.tf

    ```yaml
    variable "ec2_instance_type" {
          default = "t2.micro"
          type = string
    }

    variable "ec2_ami_id" {
          default = "ami-084568db4383264d4"
          type = string
    }

    variable "ec2_storage_block" {
          default = "15"
          type = number
    }
This Bash script automates the deployment of Prometheus, Grafana, and Nginx using Docker Compose on a Linux ubuntu system
#!/bin/bash

# Update system packages
sudo apt update -y && sudo apt upgrade -y

# Install Docker and Docker Compose
sudo apt install -y docker.io docker-compose
sudo systemctl enable --now docker

# Create a Docker Compose file for Prometheus, Grafana, and Nginx
cat <<EOF | sudo tee /opt/docker-compose.yml
version: '3.7'
services:
  prometheus:
    image: prom/prometheus:latest
    container_name: prometheus
    volumes:
      - /opt/prometheus.yml:/etc/prometheus/prometheus.yml
    ports:
      - "9090:9090"
    restart: always

  grafana:
    image: grafana/grafana:latest
    container_name: grafana
    ports:
      - "3000:3000"
    restart: always

  nginx:
    image: nginx:latest
    container_name: nginx
    volumes:
      - /opt/nginx.conf:/etc/nginx/conf.d/default.conf
    ports:
      - "80:80"
    restart: always
EOF

# Create a basic Prometheus config file
cat <<EOF | sudo tee /opt/prometheus.yml
global:
  scrape_interval: 15s

scrape_configs:
  - job_name: 'prometheus'
    static_configs:
      - targets: ['localhost:9090']
EOF

# Create an Nginx config for Grafana
cat <<EOF | sudo tee /opt/nginx.conf
server {
    listen 80;
    server_name your_domain_or_ip;

    location / {
        proxy_pass http://grafana:3000/;
        proxy_set_header Host $host;
        proxy_set_header X-Real-IP $remote_addr;
        proxy_set_header X-Forwarded-For $proxy_add_x_forwarded_for;
    }
}
EOF

# Start Docker Compose
sudo docker-compose -f /opt/docker-compose.yml up -d

# Open Grafana in Chrome
sleep 10  # Wait for services to start
xdg-open http://your_domain_or_ip &

# Print completion message
echo "Prometheus, Grafana, and Nginx (Docker) deployment complete! Access Grafana at http://your_domain_or_ip"
Once we execute the Terraform and Bash script within VS Code, our AWS infrastructure and Prometheus-Grafana-Nginx stack will be fully provisioned and deployed.
Terraform validate
Terraform init
Terraform fmt
Terraform plan (Shows up the execution plan)
Terraform apply -auto-approve
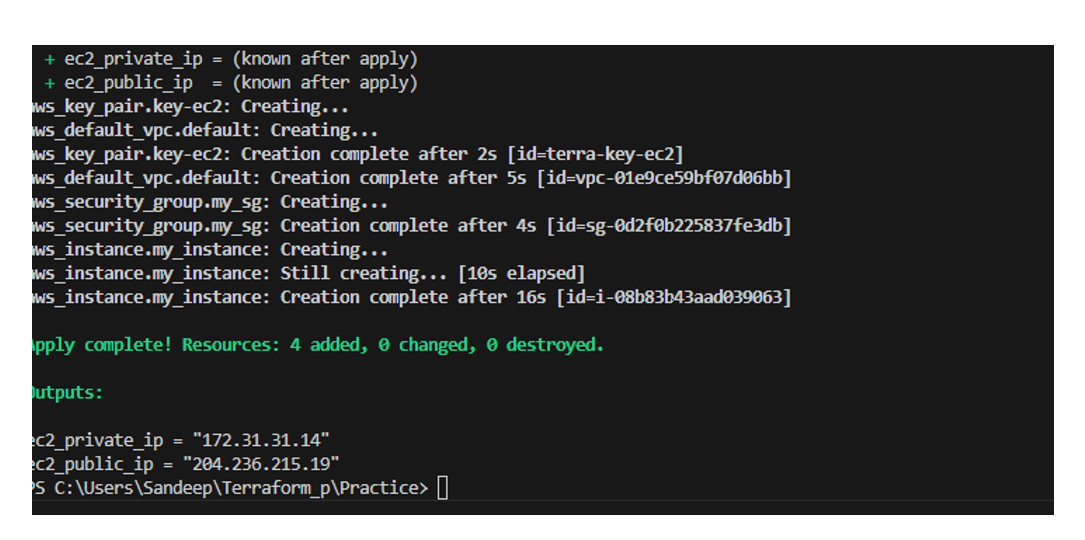

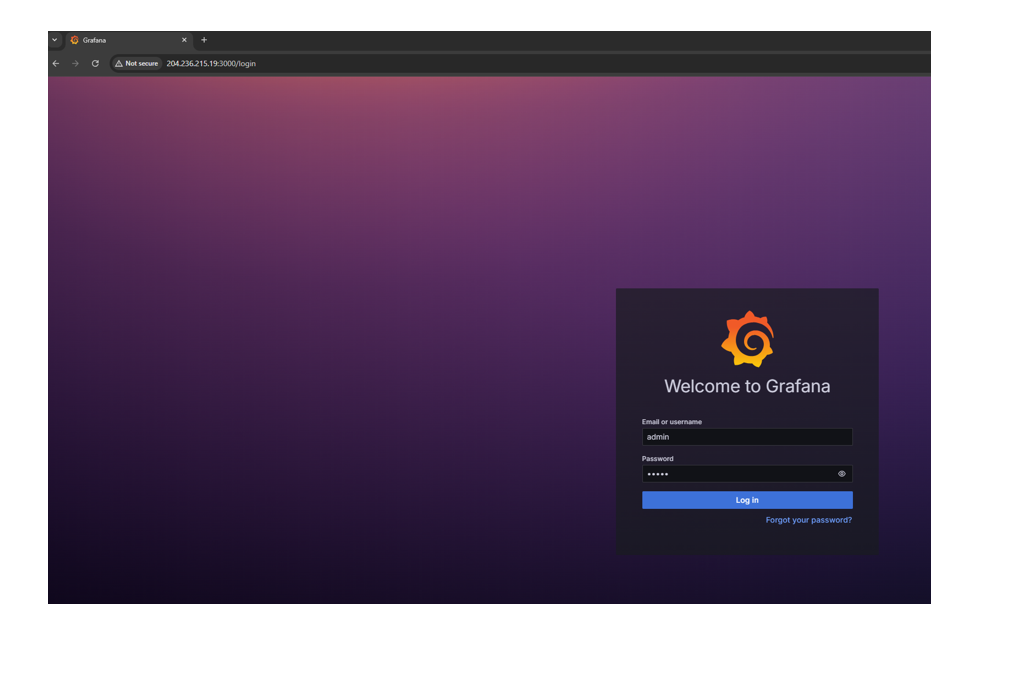
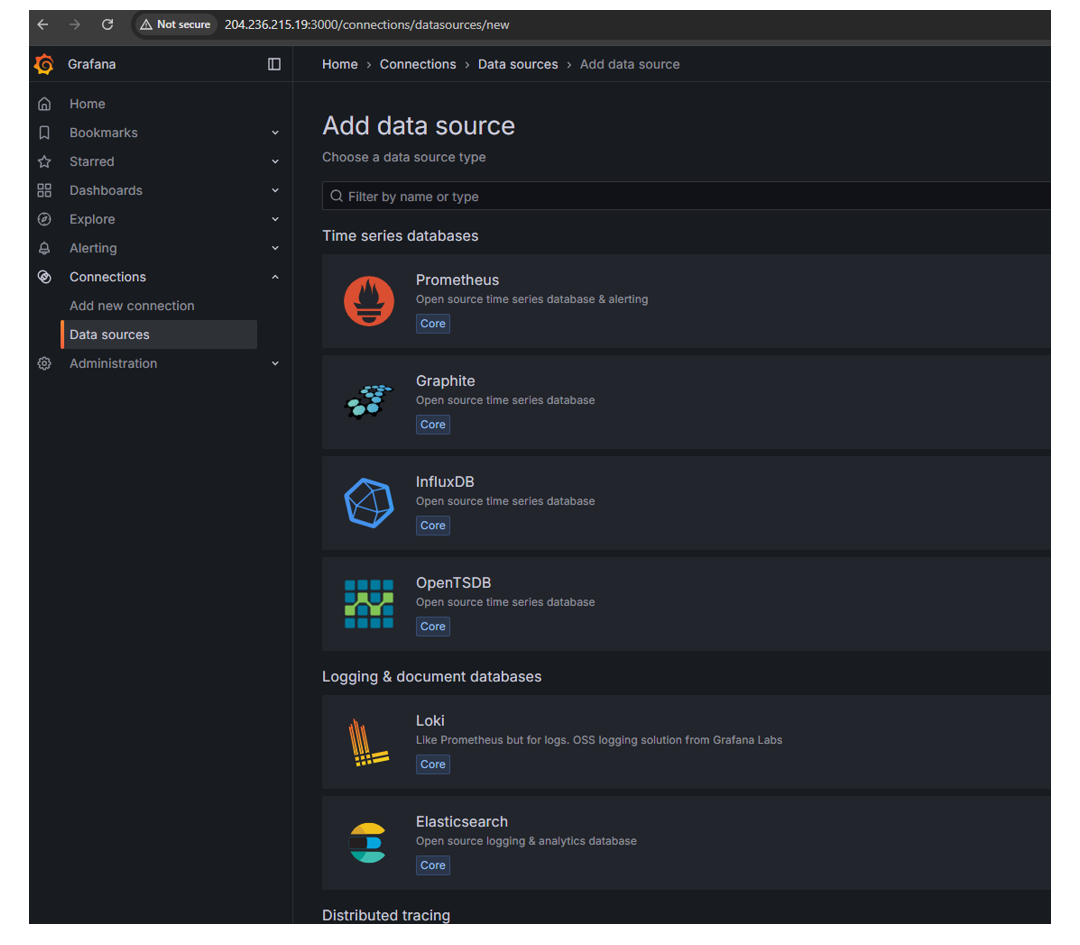
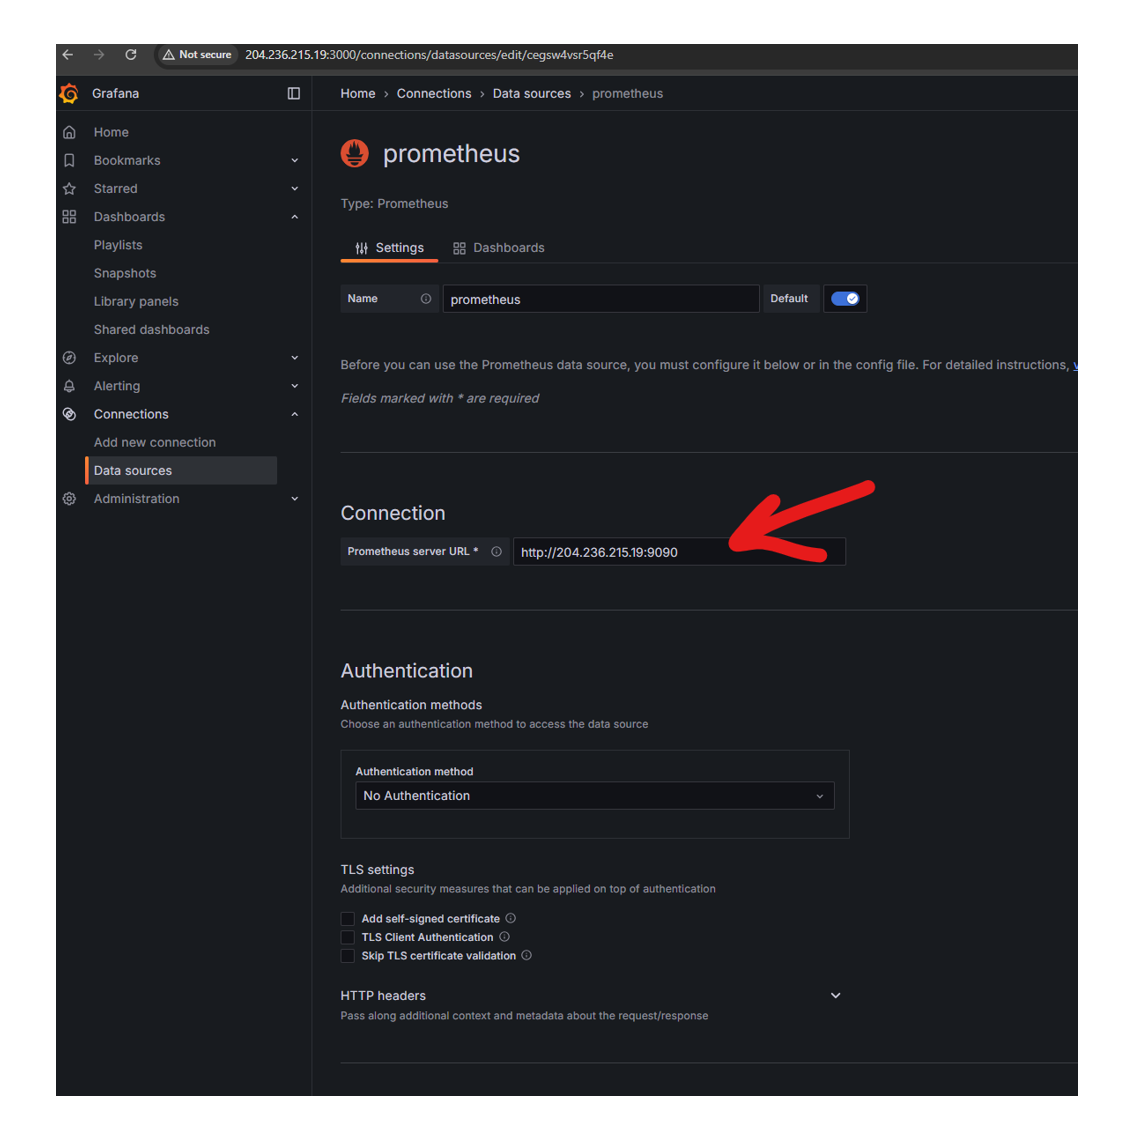
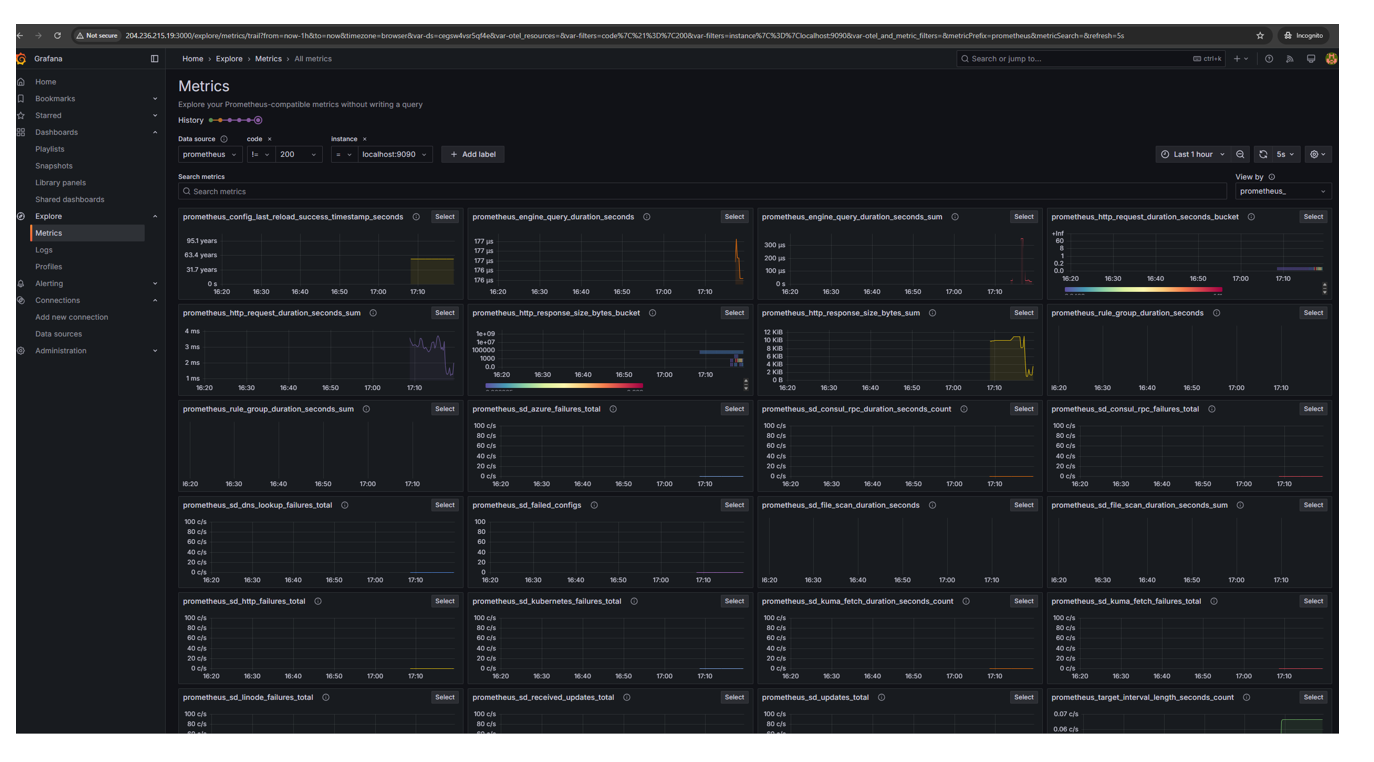

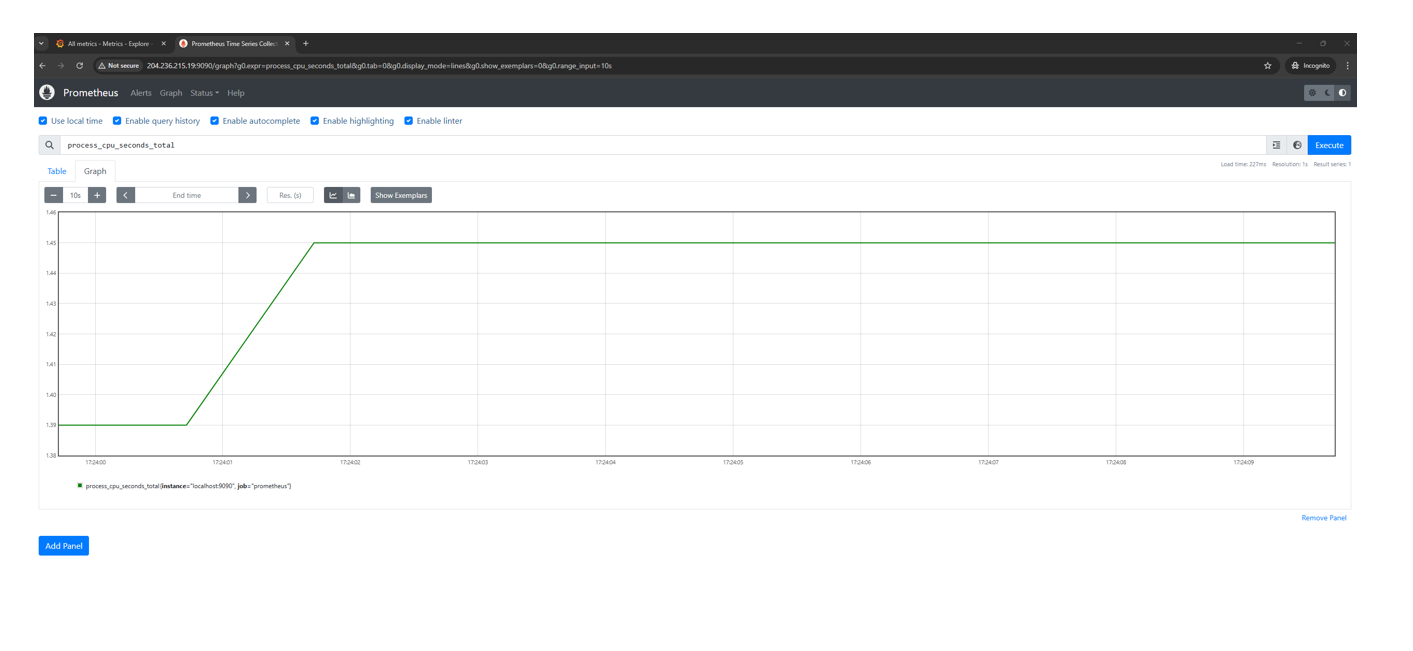
Used process_cpu_seconds_total : graph as a illustration
Subscribe to my newsletter
Read articles from Sandeep Kumar directly inside your inbox. Subscribe to the newsletter, and don't miss out.
Written by

Sandeep Kumar
Sandeep Kumar
IT experience in different technologies and also various domains(Healthcare,financial bank, Telecom,Resource management). Tech skills MSSQL Rdbms, AD,Windows/Linux/Vmware platform,Cloud platform AWS, CI/CD pipeline Jenkins, Bash shell scripting, GIT&GITHUB, Docker, YAML,Terraform, Powershell and Python certification details: MS SQL CERTIFICATION 70-462, MS AD 70-742, Aws solution architect certified SAA C03.