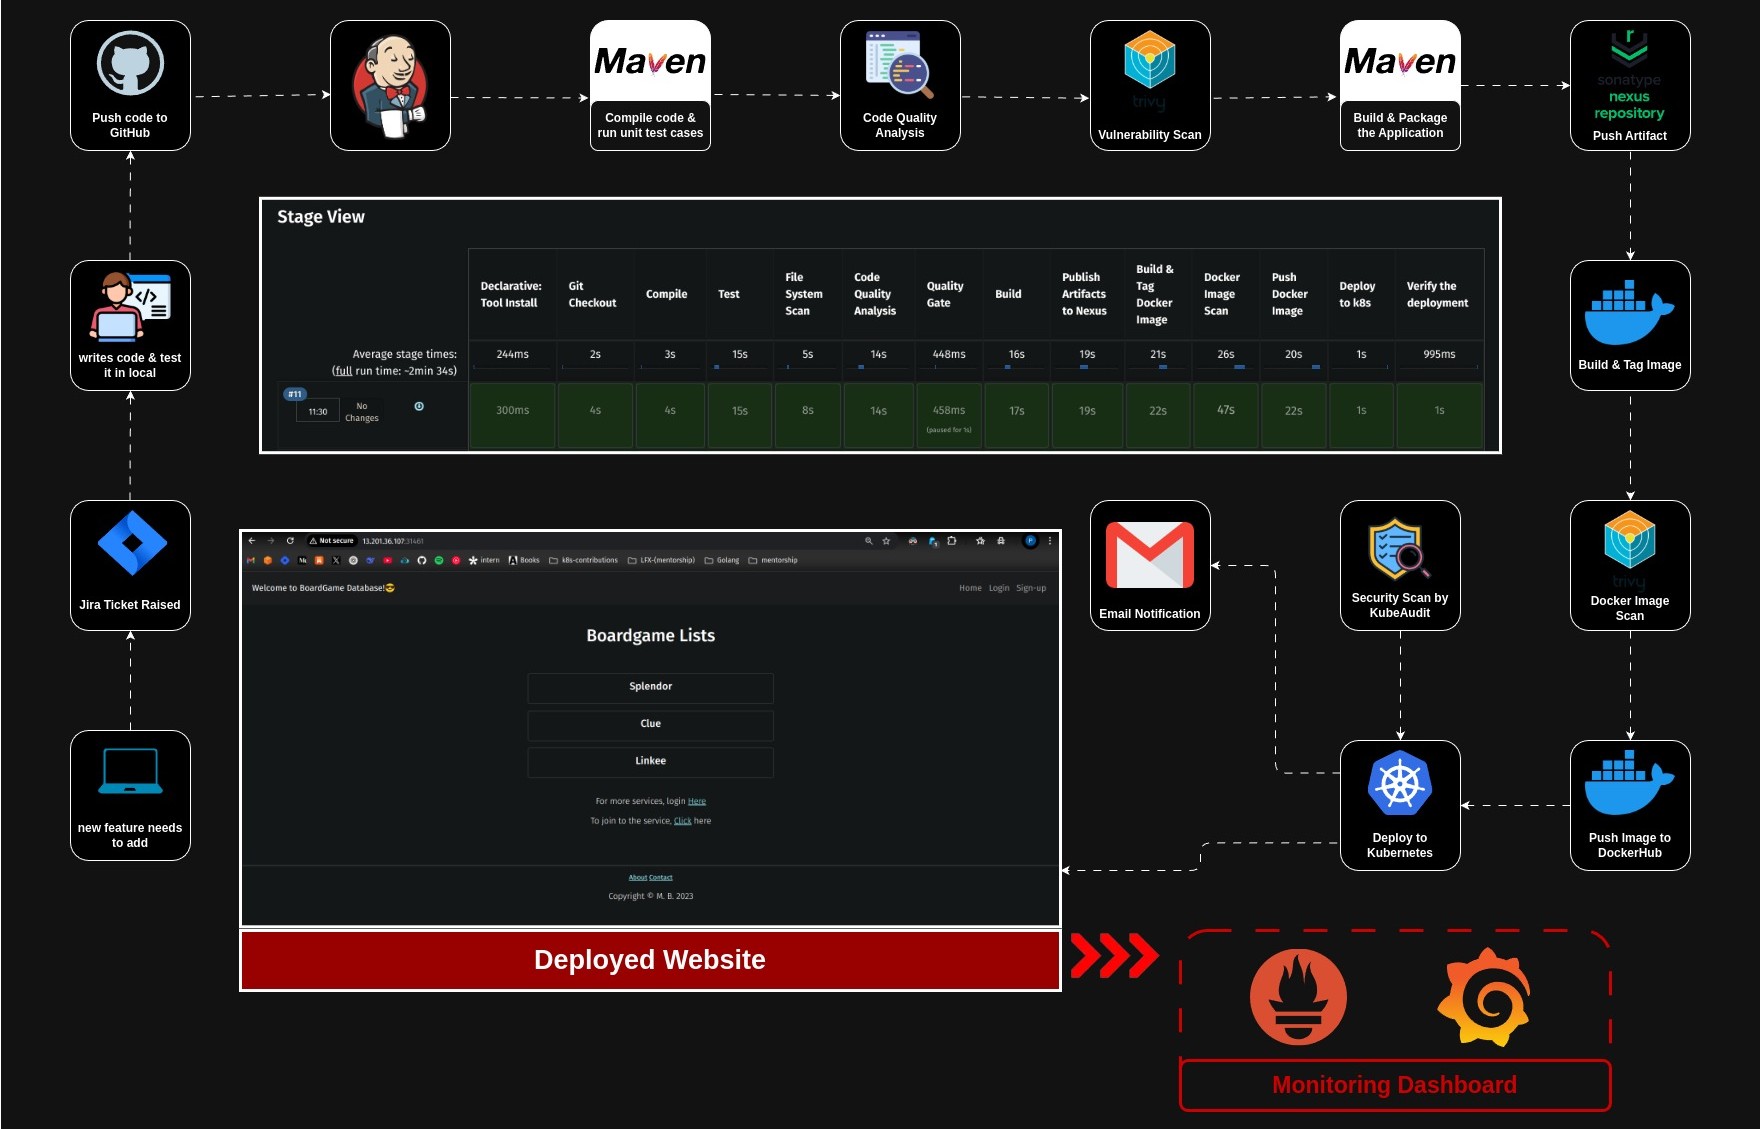
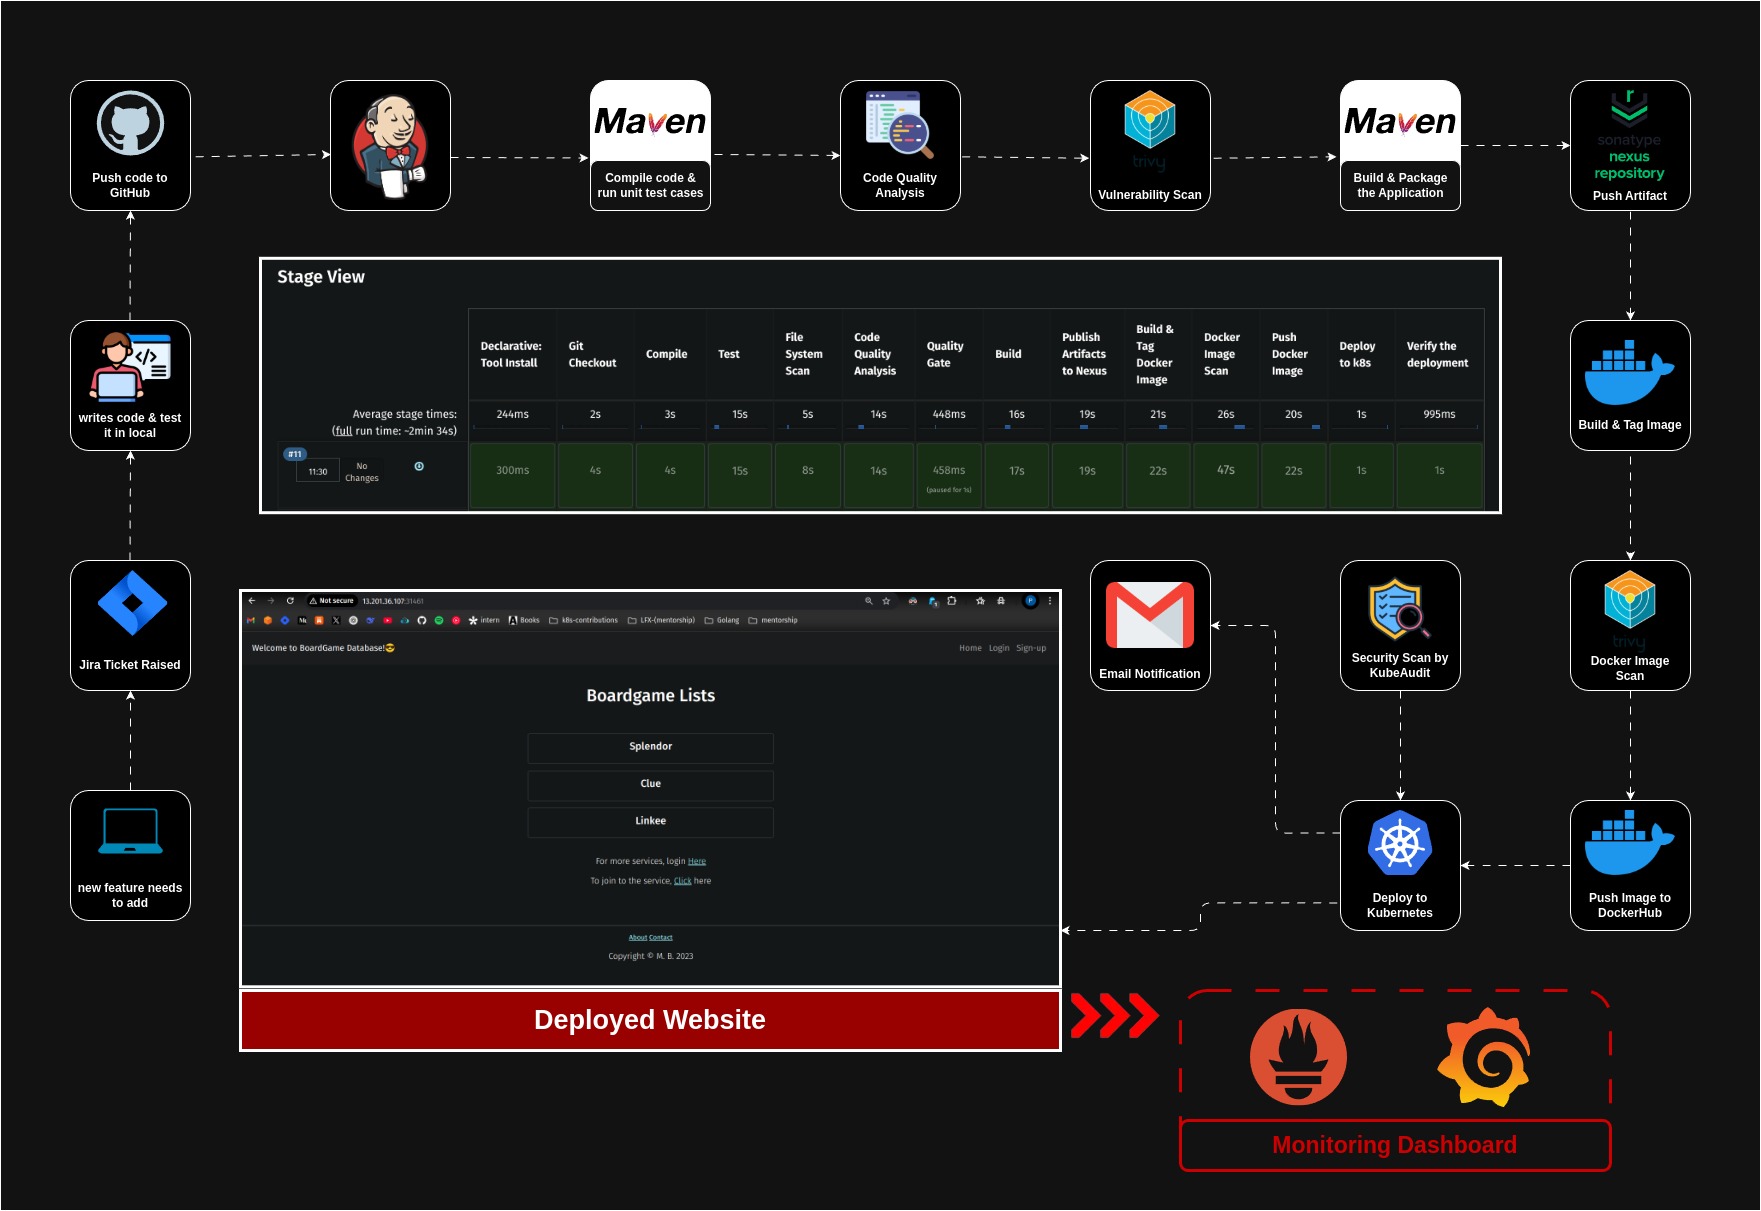
Ultimate Corporate-Grade DevSecOps Pipeline: Automated Kubernetes Deployment with Security, CI/CD, and Monitoring on AWS
 Praduman Prajapati
Table of contents
- Introduction 🚀
- Source Code and Project Repository 📌
- 🚀 Setting Up Your Kubernetes Cluster with Kubeadm
- 🔒 Configure AWS Security Group
- 🖥️ Create Virtual Machines (EC2 Instances) for the Cluster
- Connecting to EC2 Instances via SSH
- 🔧 Updating and Installing Kubernetes on All Nodes
- 🚀 Initializing the Kubernetes Cluster (Master Node Only)
- 🚀 Joining Worker Nodes to the Kubernetes Cluster
- 🔒 Perform a Security Audit Using Kubeaudit
- 🛠 Setup SonarQube and Nexus Server
- 🚀 Set Up Jenkins Server on AWS
- Launch an EC2 Instance for Jenkins
- Connect to the Jenkins Server via SSH
- Update the System
- Install Jenkins
- Install Docker (for Running Jenkins Builds in Containers)
- Install kubectl (for Kubernetes Integration)
- Access Jenkins Web Interface
- Jenkins Setup Wizard
- Install Required Jenkins Plugins
- 🎉 Jenkins is Now Fully Set Up on AWS! 🚀
- Start Creating CI/CD Pipelines! 🚀
- Setup Monitoring (Prometheus & Grafana)
- Create an EC2 Instance for Monitoring
- SSH into the Monitoring Server
- Install Prometheus
- Install Grafana
- Install Blackbox Exporter
- Configure Prometheus
- Add Prometheus as DataSource in Grafana
- Import Grafana Dashboard
- Install Prometheus Plugin on Jenkins
- Install Node Exporter on Monitoring Server
- Configure Prometheus for Jenkins
- Edit the prometheus.yml file in monitoring server
- Import Node Exporter Dashboard in Grafana
- Conclusion
Introduction 🚀
In today’s fast-paced software development world, automation is the key to delivering high-quality applications efficiently. That’s why enterprises need a robust, scalable, and secure CI/CD pipeline to streamline development, testing, and deployment.
This project is all about building the Ultimate Corporate-Grade CI/CD Pipeline—a fully automated, production-ready pipeline that follows DevSecOps best practices and is designed to work with Kubernetes on AWS.
What This Pipeline Covers?
✅ Kubernetes Cluster Setup – Using kubeadm to configure a highly available Kubernetes cluster on AWS EC2.
✅ Code Integration & Testing – Automating builds, tests, and security scans.
✅ Containerization & Orchestration – Using Docker and Kubernetes (EKS) for scalability.
✅ Automated Deployments – Implementing GitOps with ArgoCD for zero-downtime releases.
✅ Security & Compliance – Integrating Trivy, SonarQube, and Prometheus for DevSecOps.
✅ Observability & Monitoring – Setting up Grafana & Prometheus for real-time insights.
Why This Matters?
🔹 Enterprise-Grade Reliability – Built for scalability, high availability, and security.
🔹 Faster Releases – Automates everything from code commit to production deployment.
🔹 Cost-Effective – Optimized for AWS, reducing operational overhead.
By the end of this project, we’ll have a bulletproof CI/CD pipeline, complete with a Kubernetes cluster set up using kubeadm, ensuring a fully automated and secure software delivery process. Let’s dive in! 🚀
Source Code and Project Repository 📌
🚀 Setting Up Your Kubernetes Cluster with Kubeadm
🔒 Configure AWS Security Group
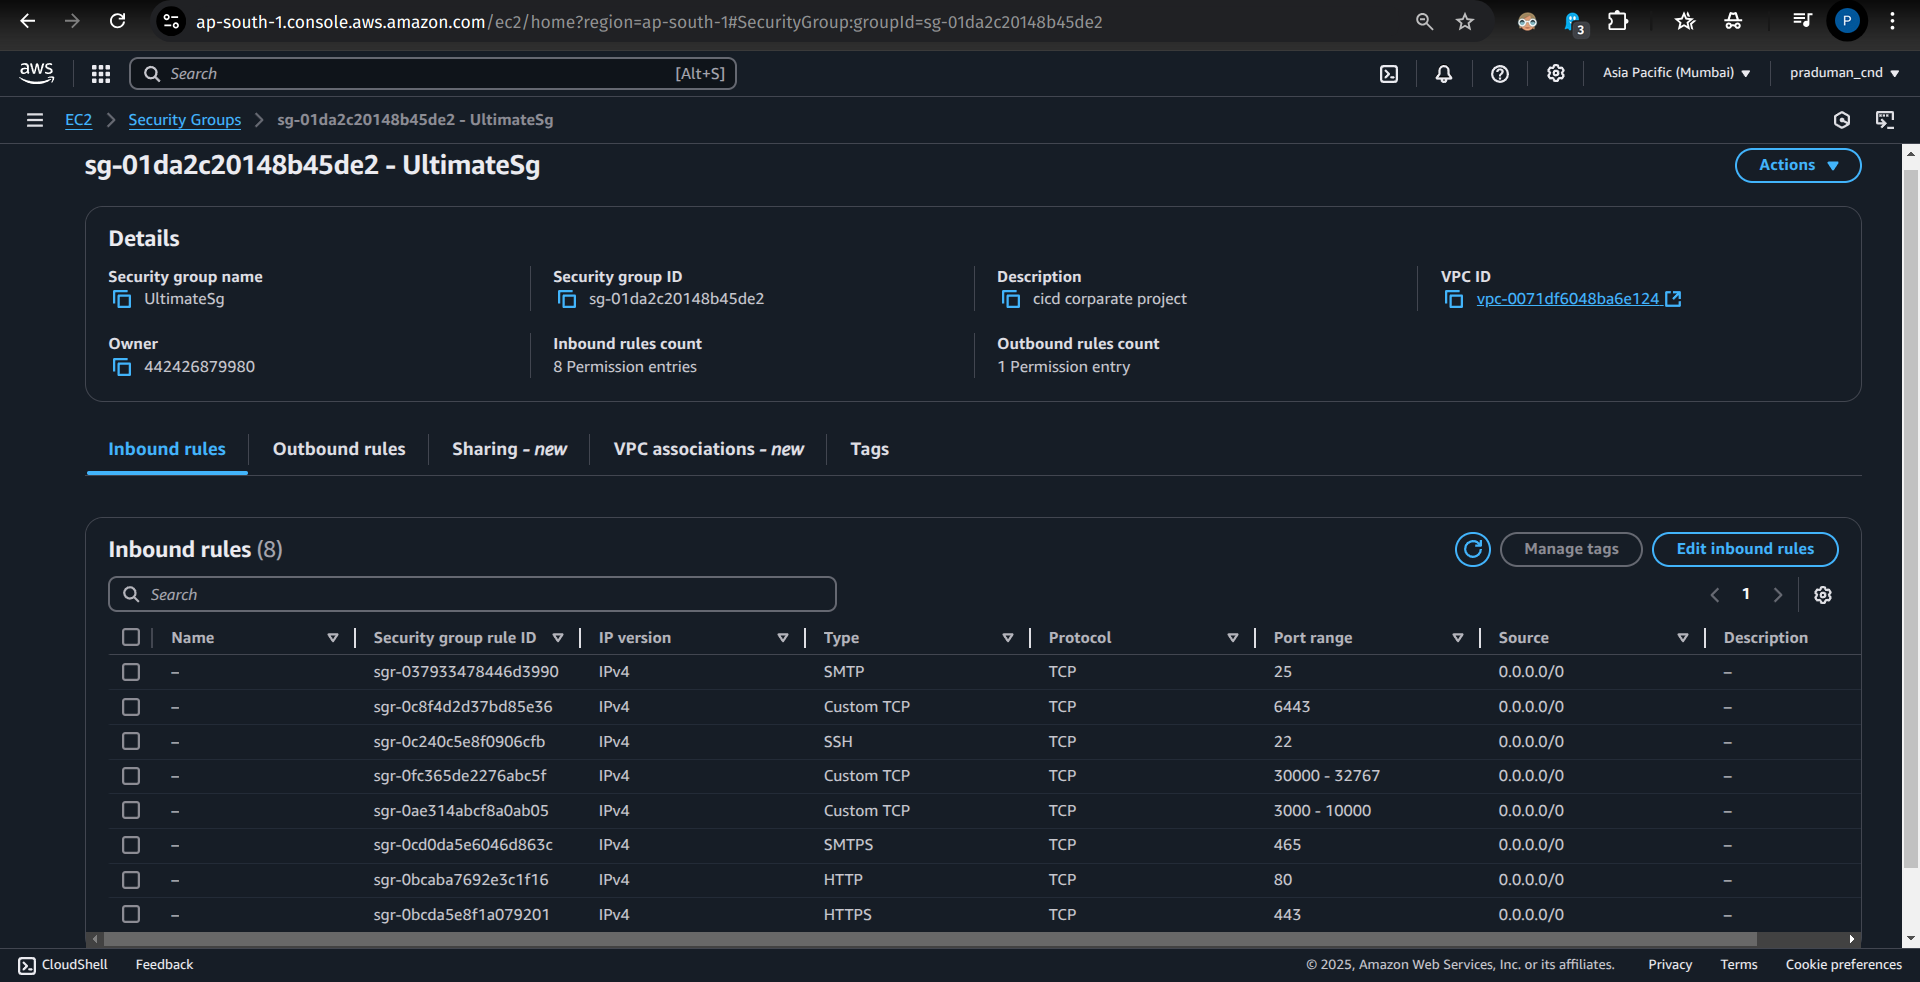
Before deploying Kubernetes on AWS, you need to configure security groups to control inbound and outbound traffic. Security groups act as a firewall, ensuring that only necessary connections are allowed while keeping your cluster protected.
You can either create a new security group or modify an existing one with the essential rules listed below:
📌 Essential Security Group Rules for Kubernetes
| Port(s) | Purpose | Use Case |
| 30000-32767 | NodePort Access | Expose apps without Ingress |
| 465, 25 | SMTP (Secure & Standard) | Email notifications |
| 22 (Use with caution) | SSH Access | Remote troubleshooting |
| 443, 80 | HTTPS & HTTP | Secure and standard web traffic |
| 6443 | Kubernetes API Server | kubectl, CI/CD tools, ArgoCD |
| 10250-10259 | Internal Kubernetes Communication | Control plane ↔ Worker nodes |
| 2379-2380 | etcd Communication | Stores cluster data |
| 3000-10000 | App-Specific Traffic | Databases, Prometheus, Grafana |
| 53 | Cluster DNS (CoreDNS) | Internal service discovery |
| 8285, 8286, 5473 | Flannel | |
| 4789 | Calico | |
| 6783-6784 | CNI Networking | Enables pod communication |
✅ Best Practices
Follow Least Privilege: Only open the ports your cluster needs.
Restrict SSH Access: Limit port
22to specific IPs to enhance security.Secure API Server: Only allow trusted IPs for port
6443to prevent unauthorized access.
Once your security groups are configured, you're now ready to initialize your Kubernetes cluster using Kubeadm! 🎯
🖥️ Create Virtual Machines (EC2 Instances) for the Cluster
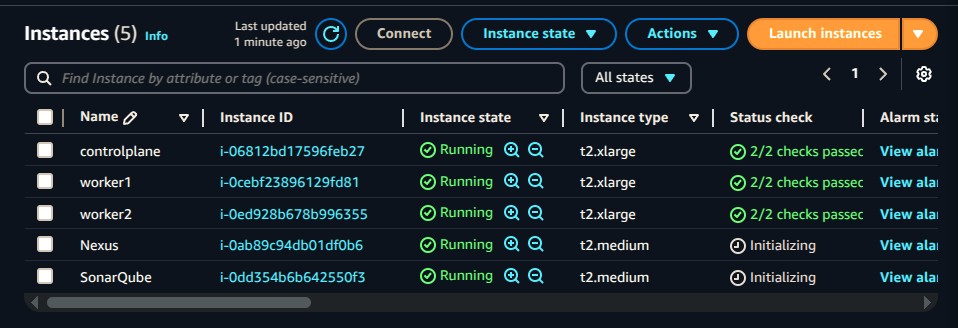
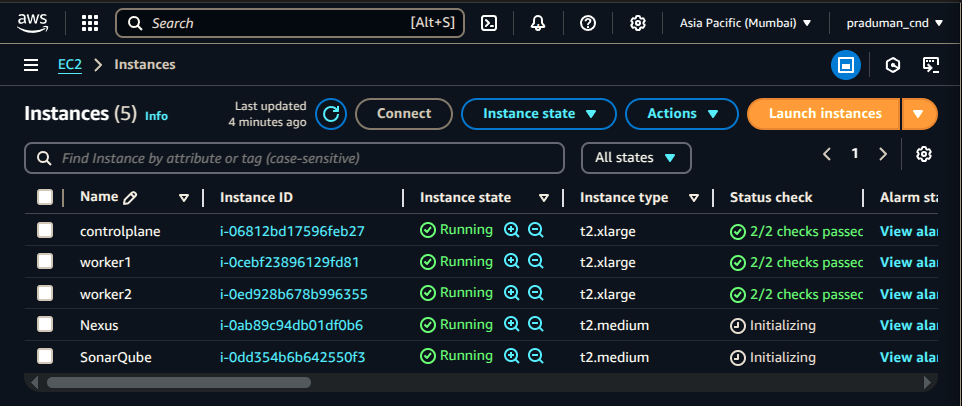
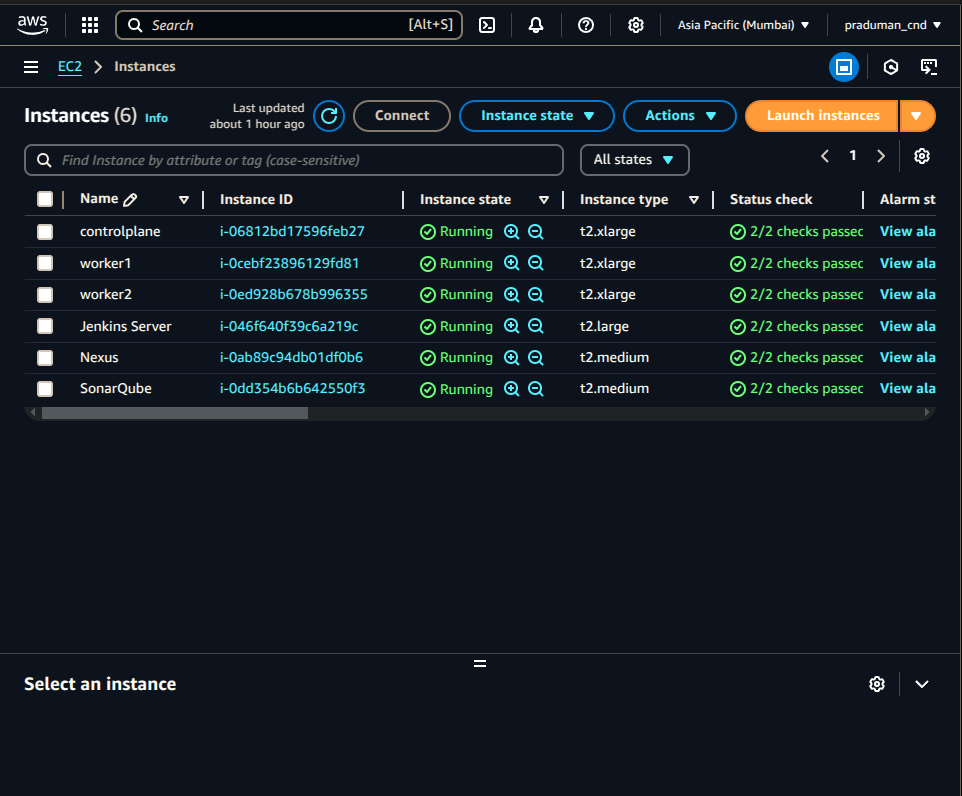
To set up a Kubernetes cluster on AWS, you need to create three EC2 instances:
One Master Node (Control Plane): Manages the cluster, schedules workloads, and maintains the desired state.
Two Worker Nodes: Run application workloads and handle deployments.
🔧 Step 1: Launch EC2 Instances
Open the AWS Console and navigate to the EC2 Dashboard.
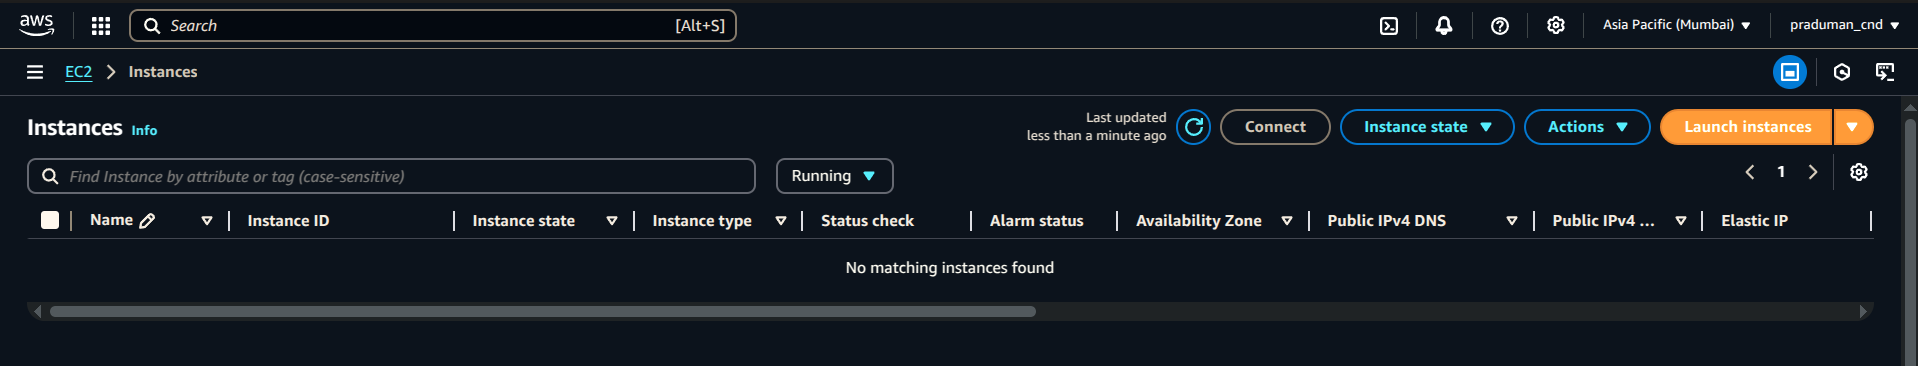
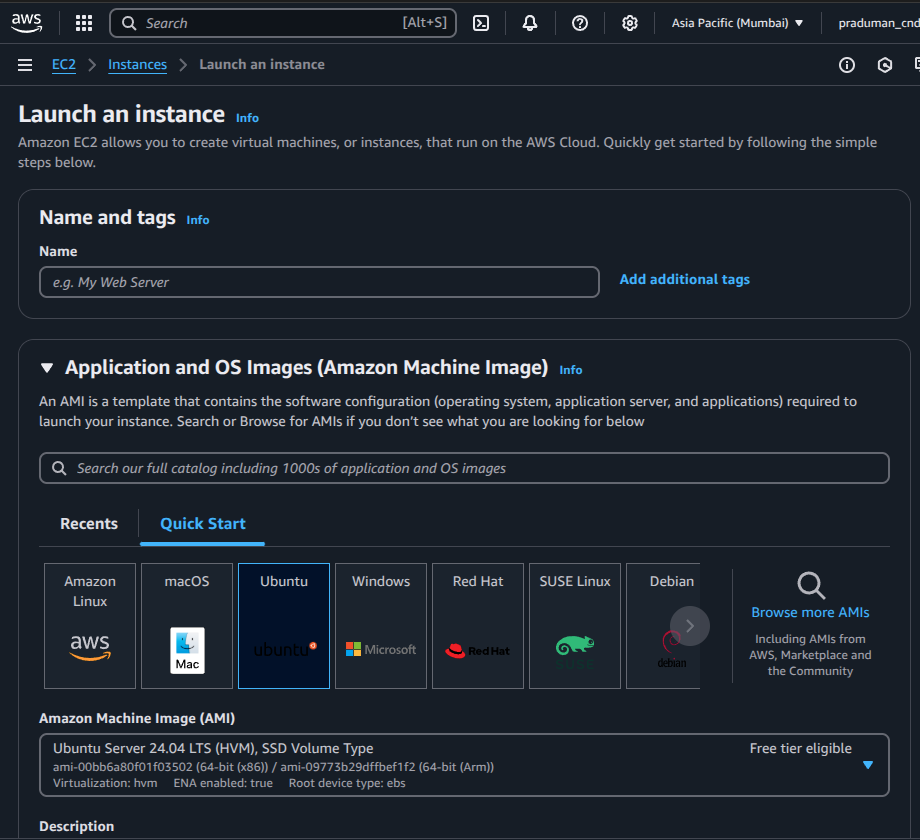
Click Launch Instance to create virtual machines.
⚙️ Step 2: Configure the Instances
Set the number of instances →
3(1 Master + 2 Workers).Choose Amazon Machine Image (AMI) → Latest Ubuntu AMI (recommended for Kubernetes).
Select an instance type →
t2.xlargeAssign Security Group → Use the previously configured security group to allow necessary traffic.
Set Storage → Minimum 30GB (for Kubernetes components, logs, and workloads).
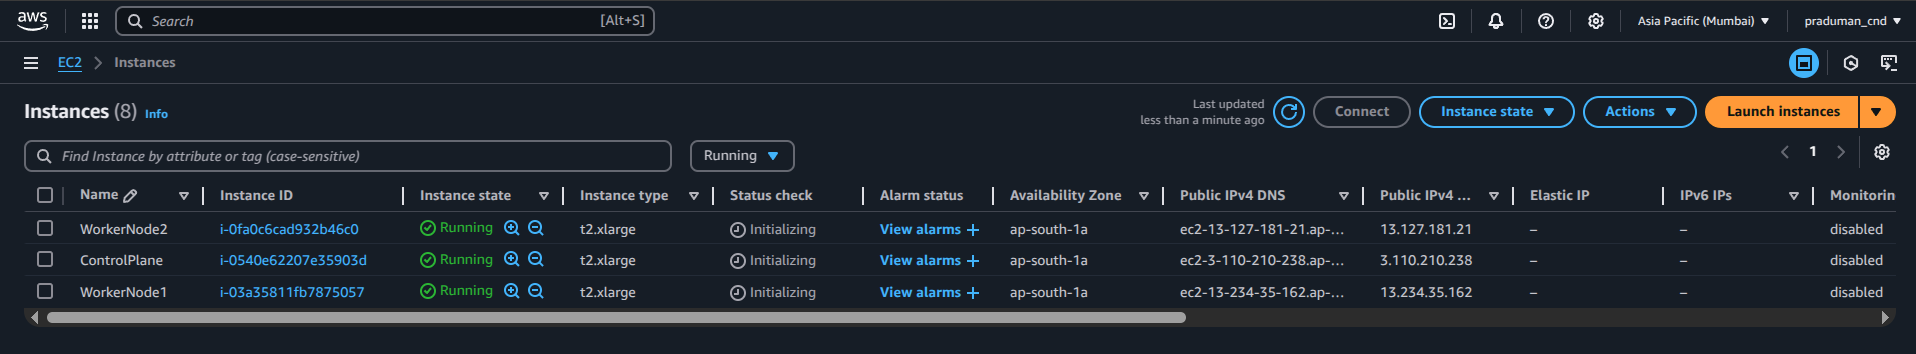
Click Launch Instance to provision the virtual machines.
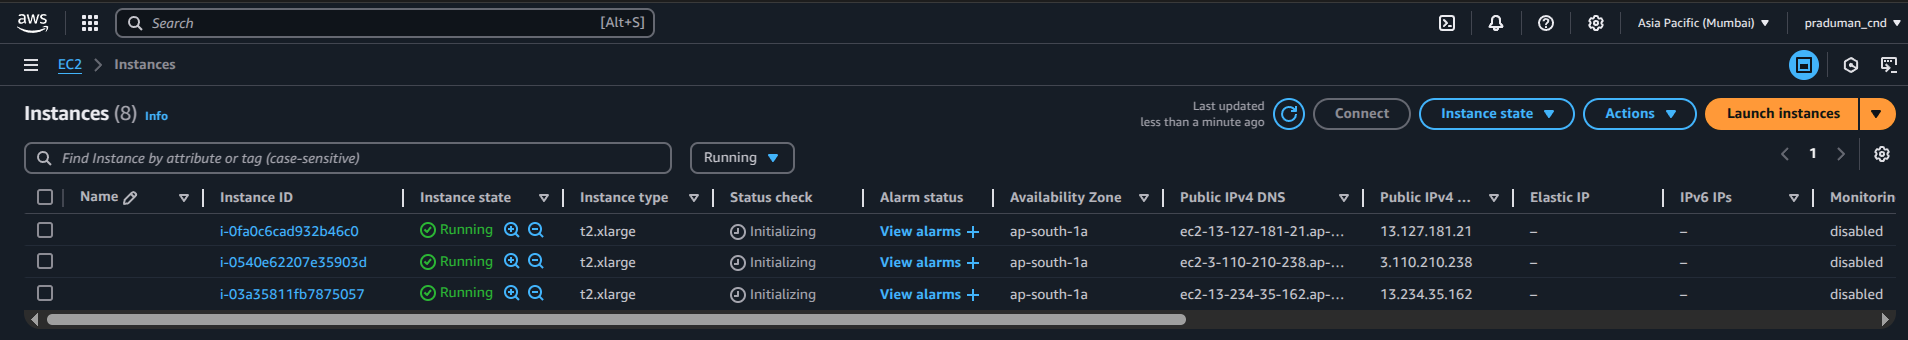
🏷️ Step 3: Naming the Instances
For easy identification, name your instances as follows:
🖥️ ControlPlane → Master Node
📦 WorkerNode1 → First Worker Node
📦 WorkerNode2 → Second Worker Node
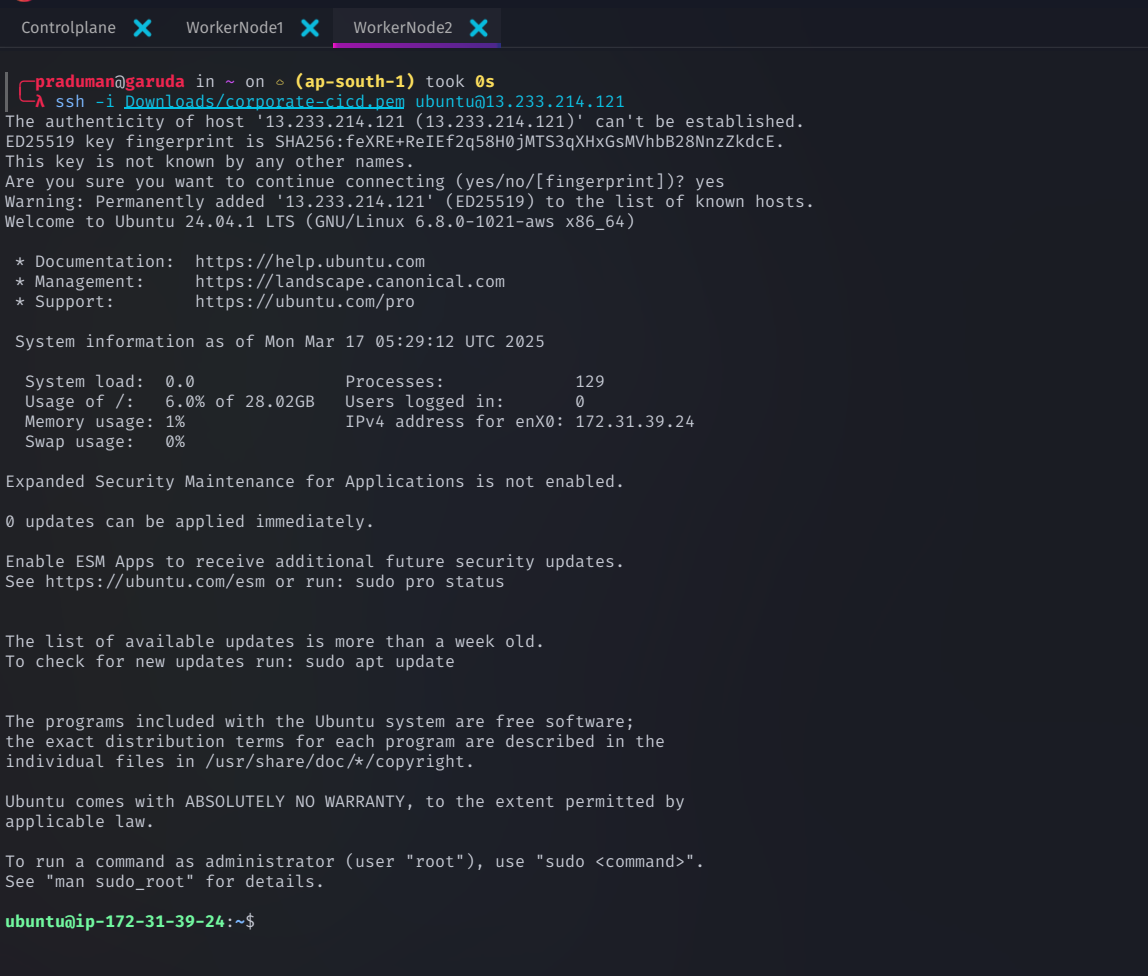
Connecting to EC2 Instances via SSH
Once your EC2 instances are running, connect to them using SSH
Connect to the Control Plane Node
ssh -i <path-to-pem-file> ubuntu@<public-ip-of-controlplane>
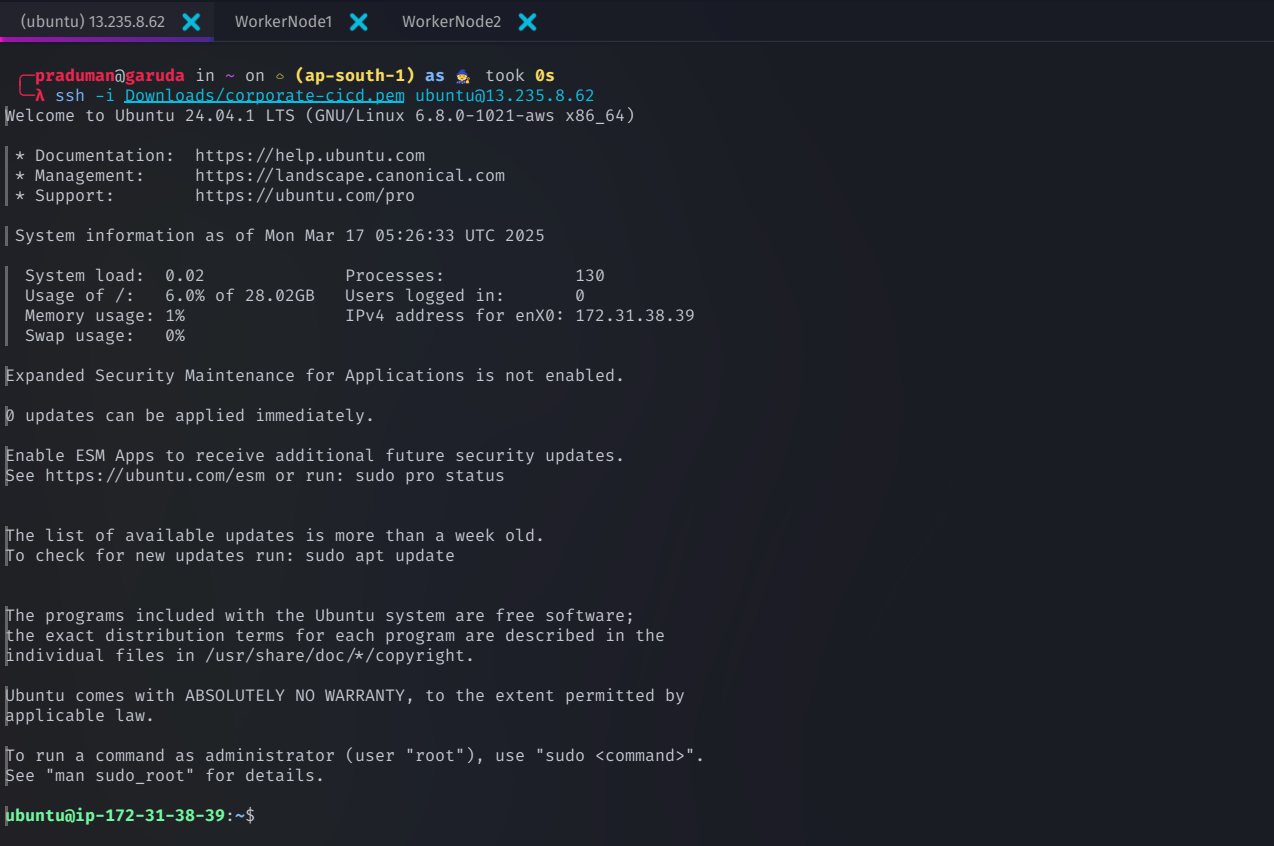
Connect to Worker Nodes
ssh -i <path-to-pem-file> ubuntu@<public-ip-of-workernode1>
ssh -i <path-to-pem-file> ubuntu@<public-ip-of-workernode2>
🔹 Replace:
<path-to-pem-file>→ Your private key file path<public-ip>→ The public IP address of each instance
Once your instances are up and running, you're ready to initialize the Kubernetes cluster with Kubeadm! 🚀
🔧 Updating and Installing Kubernetes on All Nodes
Before initializing your Kubernetes cluster, it's crucial to update your virtual machines, configure system settings, and install essential dependencies. This ensures a stable, secure, and well-optimized Kubernetes environment across all nodes.
Step 1: Disable Swap
Kubernetes requires swap to be disabled for optimal performance. Run the following commands on each node:
swapoff -a
sudo sed -i '/ swap / s/^\(.*\)$/#\1/g' /etc/fstab
This disables swap immediately and ensures it remains disabled after a reboot.
Step 2: Enable IP Forwarding and Allow Bridged Traffic
To enable proper Kubernetes networking, configure IP forwarding and iptables:
cat <<EOF | sudo tee /etc/modules-load.d/k8s.conf
overlay
br_netfilter
EOF

sudo modprobe overlay
sudo modprobe br_netfilter
Now, set up required system parameters and apply them:
cat <<EOF | sudo tee /etc/sysctl.d/k8s.conf
net.bridge.bridge-nf-call-iptables  = 1
net.bridge.bridge-nf-call-ip6tables = 1
net.ipv4.ip_forward                 = 1
EOF

sudo sysctl --system
✅ Verification
Ensure the necessary modules are loaded
lsmod | grep br_netfilter
lsmod | grep overlay
Check if system variables are correctly set
sysctl net.bridge.bridge-nf-call-iptables net.bridge.bridge-nf-call-ip6tables net.ipv4.ip_forward
Step 3: Update System Packages
Keeping your system updated ensures compatibility with the latest Kubernetes components. Run the following command on all nodes
sudo apt update && sudo apt upgrade -y
Step 4: Install Container Runtime (containerd)
Kubernetes requires a container runtime to manage containers. We'll use containerd
Install containerd
curl -LO https://github.com/containerd/containerd/releases/download/v1.7.14/containerd-1.7.14-linux-amd64.tar.gz
sudo tar Cxzvf /usr/local containerd-1.7.14-linux-amd64.tar.gz
Set up containerd as a service
curl -LO https://raw.githubusercontent.com/containerd/containerd/main/containerd.service
sudo mkdir -p /usr/local/lib/systemd/system/
sudo mv containerd.service /usr/local/lib/systemd/system/
sudo mkdir -p /etc/containerd
containerd config default | sudo tee /etc/containerd/config.toml
Enable systemd as the cgroup driver
sudo sed -i 's/SystemdCgroup \= false/SystemdCgroup \= true/g' /etc/containerd/config.toml
Restart containerd and verify its status
sudo systemctl daemon-reload
sudo systemctl enable --now containerd
systemctl status containerd
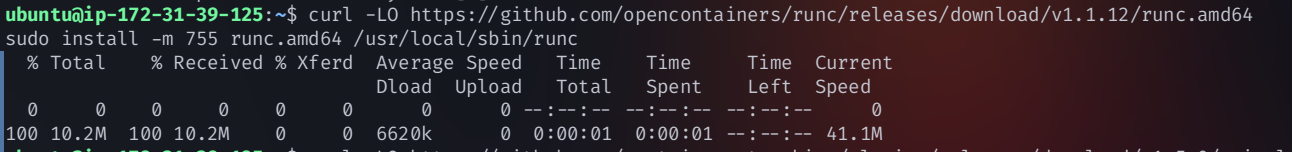
Step 5: Install runc (Container Runtime Interface - CRI)
runc is required to run containers inside containerd. Install it using
curl -LO https://github.com/opencontainers/runc/releases/download/v1.1.12/runc.amd64
sudo install -m 755 runc.amd64 /usr/local/sbin/runc
Step 6: Install CNI (Container Network Interface) Plugins
CNI plugins allow pod-to-pod communication within the cluster. Install them with
curl -LO https://github.com/containernetworking/plugins/releases/download/v1.5.0/cni-plugins-linux-amd64-v1.5.0.tgz
sudo mkdir -p /opt/cni/bin
sudo tar Cxzvf /opt/cni/bin cni-plugins-linux-amd64-v1.5.0.tgz
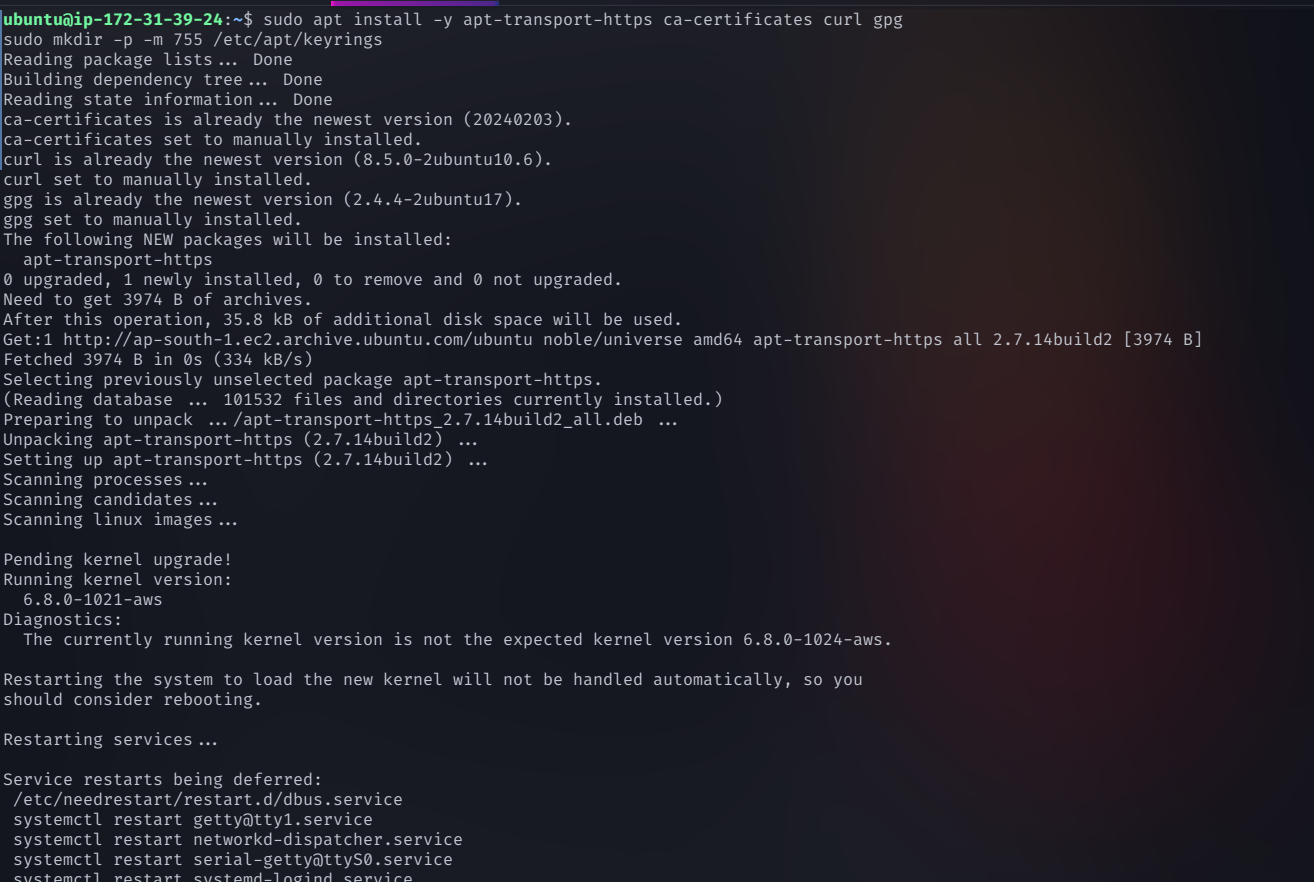
Step 7: Install Required Dependencies
Install essential tools for secure communication and package management
sudo apt install -y apt-transport-https ca-certificates curl gpg
sudo mkdir -p -m 755 /etc/apt/keyrings
Step 8: Install Kubernetes Components
Add the Kubernetes repository key and repository
curl -fsSL https://pkgs.k8s.io/core:/stable:/v1.29/deb/Release.key | sudo gpg --dearmor -o /etc/apt/keyrings/kubernetes-apt-keyring.gpg

echo 'deb [signed-by=/etc/apt/keyrings/kubernetes-apt-keyring.gpg] https://pkgs.k8s.io/core:/stable:/v1.29/deb/ /' | sudo tee /etc/apt/sources.list.d/kubernetes.list

Update the package list
sudo apt update
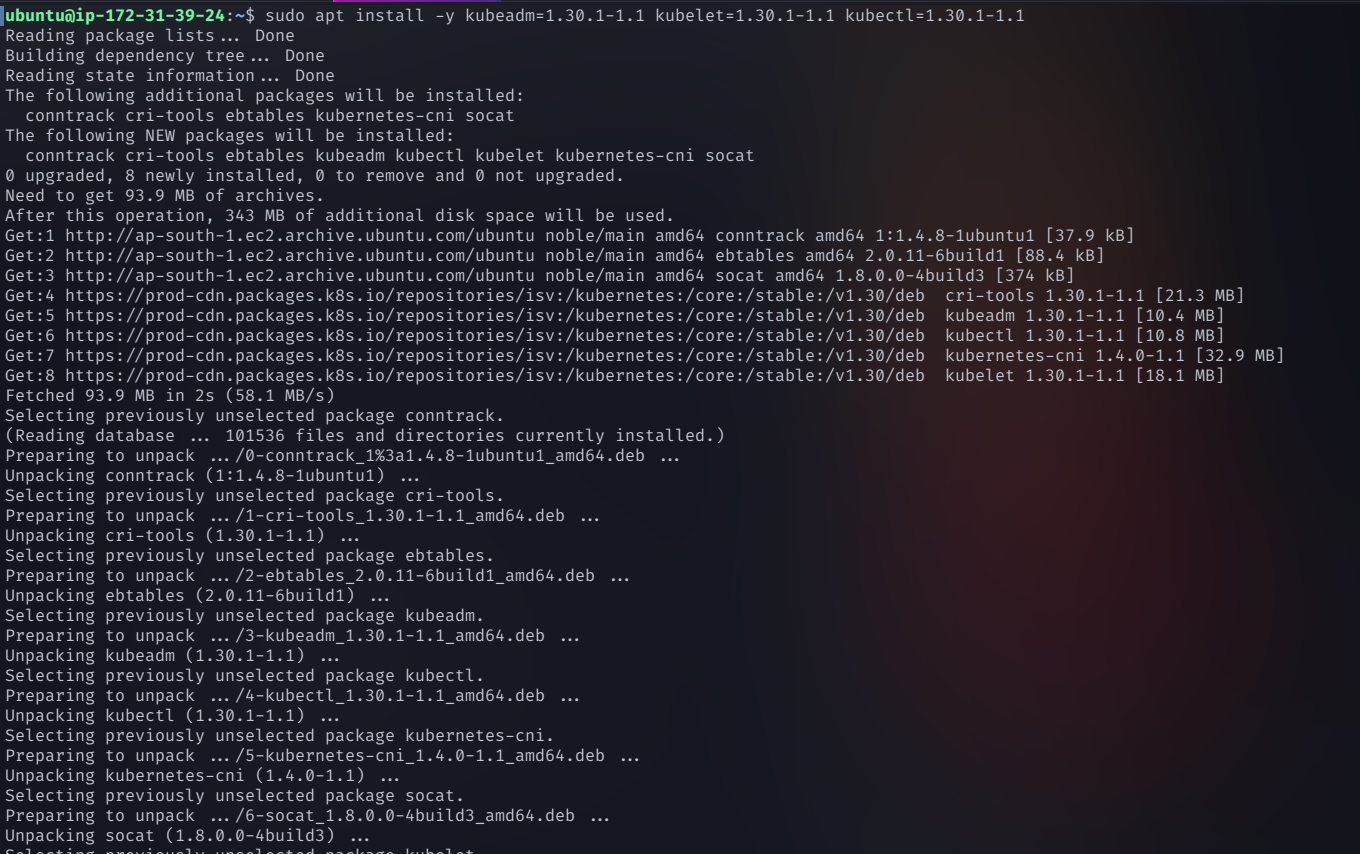
Install Kubernetes Tools (
kubeadm,kubelet,kubectl)
sudo apt-get install -y kubelet=1.29.6-1.1 kubeadm=1.29.6-1.1 kubectl=1.29.6-1.1 --allow-downgrades --allow-change-held-packages
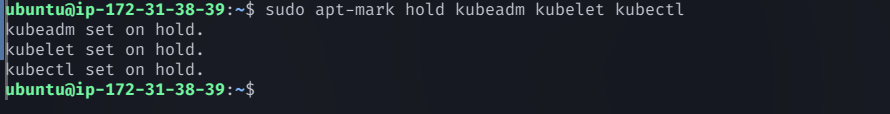
Prevent accidental updates that could break the cluster
sudo apt-mark hold kubeadm kubelet kubectl
Step 9: Configure crictl to Work with containerd
Set up crictl (a tool for interacting with container runtimes) to use containerd
sudo crictl config runtime-endpoint unix:///var/run/containerd/containerd.sock
🎯 Your Kubernetes Cluster is Ready for Initialization! 🚀
With all nodes updated and configured, your Kubernetes cluster is now ready for initialization using
kubeadmin the next step!
🚀 Initializing the Kubernetes Cluster (Master Node Only)
Now that Kubernetes is installed on all nodes, it's time to initialize the cluster on the master node (Control Plane). This process sets up the control plane and defines the pod network, which is essential for communication between pods.
Step 1: Initialize the Kubernetes Control Plane
On the master node, run the following command to start the Kubernetes cluster:
sudo kubeadm init --pod-network-cidr=192.168.0.0/16 --apiserver-advertise-address=<private-ip-of-controlplane> --node-name controlplane
🔹 Replace <private-ip-of-controlplane> with the actual private IP of your Control Plane instance.
🔹 The --pod-network-cidr=192.168.0.0/16 flag specifies the pod network range.
Network CNI Options:
Calico:
192.168.0.0/16(default in this example)Flannel:
10.244.0.0/16Cilium:
10.217.0.0/16
✅ This command does the following:
Sets up the Kubernetes control plane
Defines the pod network for inter-pod communication
Generates a join command to add worker nodes to the cluster
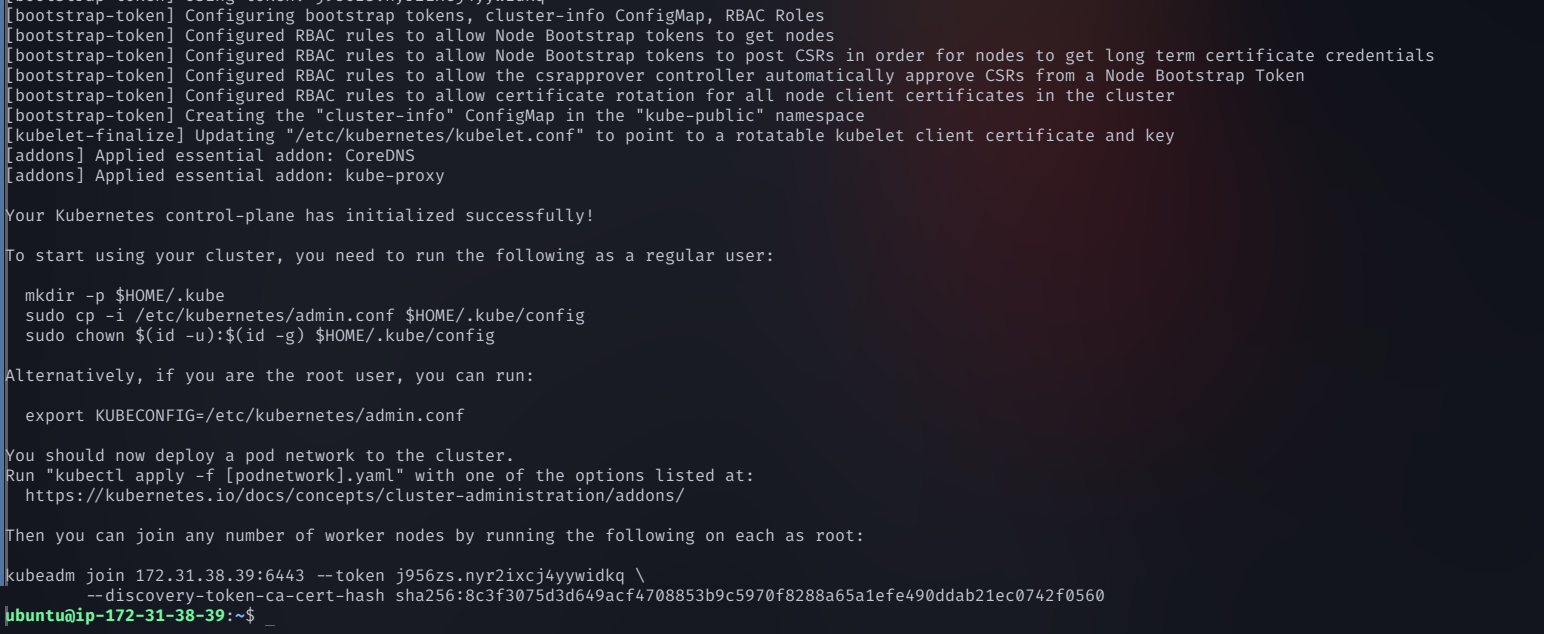
Step 2: Save the Worker Node Join Command
Once initialization is complete, Kubernetes will generate a command similar to this
sudo kubeadm join <master-node-ip>:6443 --token <token> --discovery-token-ca-cert-hash sha256:<hash>
Copy and save this command—you will need it to connect worker nodes later.
Step 3: Configure kubectl on the Master Node
To start using Kubernetes, configure kubectl with the admin credentials
mkdir -p $HOME/.kube
sudo cp -i /etc/kubernetes/admin.conf $HOME/.kube/config
sudo chown $(id -u):$(id -g) $HOME/.kube/config

This allows you to run
kubectlcommands without root privileges.
Verify that the Control Plane is Running
kubectl get nodes
The master node should appear as
NotReady—this is expected until a network plugin is installed.
Step 4: Deploy a Network Plugin (CNI)
Kubernetes requires a Container Network Interface (CNI) to enable pod-to-pod communication. Choose a networking solution and apply the corresponding configuration.
Install Calico (Recommended for Production)
Calico provides robust networking and security policies for Kubernetes clusters.
Run the following commands on the master node
kubectl create -f https://raw.githubusercontent.com/projectcalico/calico/v3.28.0/manifests/tigera-operator.yaml
curl -O https://raw.githubusercontent.com/projectcalico/calico/v3.28.0/manifests/custom-resources.yaml
kubectl apply -f custom-resources.yaml
This enables networking between pods across all nodes.
Verify Calico Installation
kubectl get pods -n calico-system
Step 5: Deploy the NGINX Ingress Controller
To manage external access to services inside the cluster, deploy the NGINX Ingress Controller:
kubectl apply -f https://raw.githubusercontent.com/kubernetes/ingress-nginx/main/deploy/static/provider/baremetal/deploy.yaml
🎯 Your Kubernetes Control Plane is Ready! 🚀
At this point:
The control plane is up and running.
Networking is configured, allowing pods to communicate.
Ingress controller is deployed for external access.
🚀 Joining Worker Nodes to the Kubernetes Cluster
After setting up the control plane, the next step is to add worker nodes to the cluster. This allows them to host workloads and be managed by the master node.
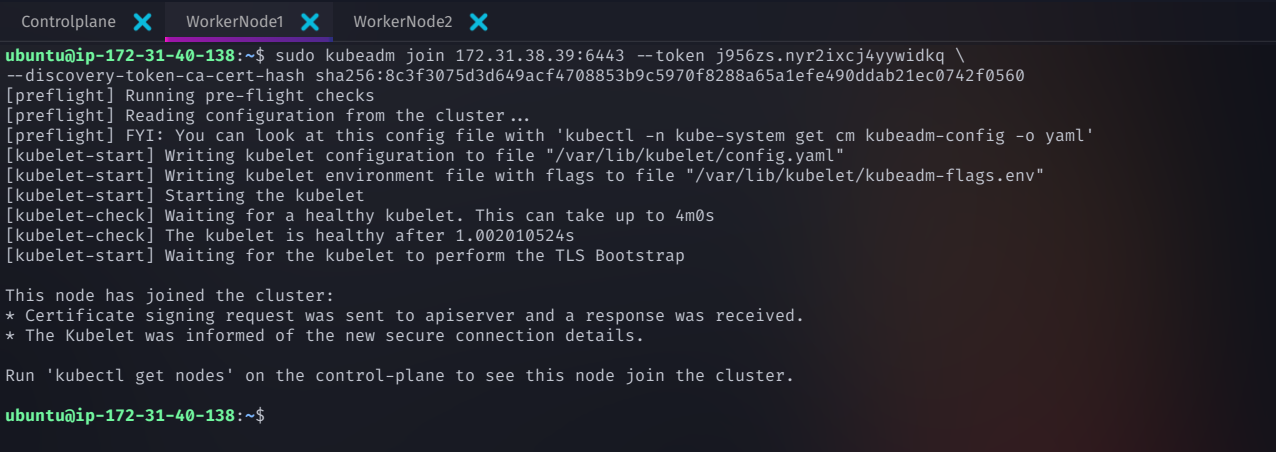
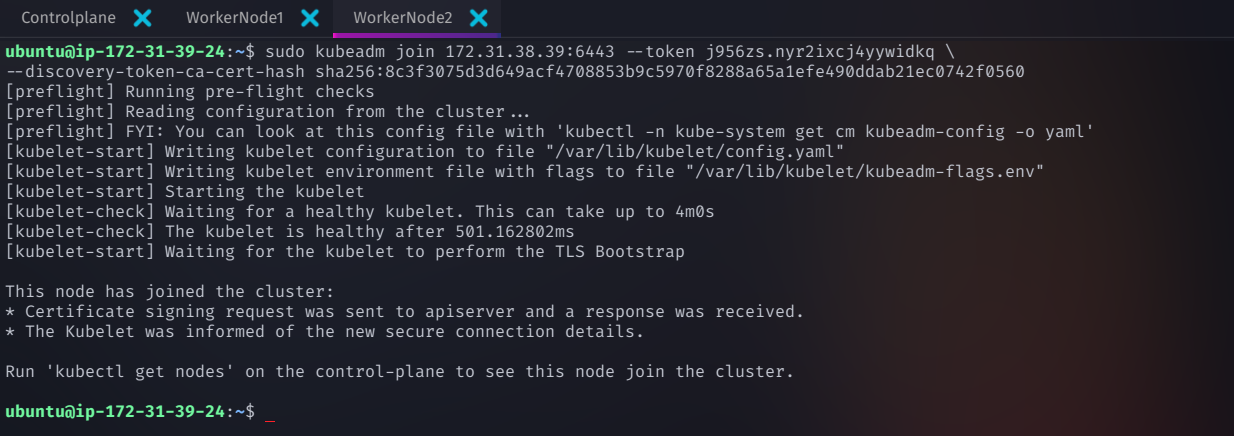
Step 1: Join the Worker Nodes
Run the following command on each worker node to connect them to the Kubernetes cluster
sudo kubeadm join 172.31.38.39:6443 --token <your-token> \
    --discovery-token-ca-cert-hash sha256:<your-ca-hash>
Replace
<your-token>and<your-ca-hash>with the values generated duringkubeadm init.
✅ This command does the following:
Connects worker nodes to the Kubernetes control plane.
Allows the master node to schedule and manage workloads on worker nodes.
Once executed on all worker nodes, your Kubernetes cluster will be fully formed! 🎉
Step 2: Verify the Cluster Setup
To ensure that all nodes are properly connected, run the following command on the master node
kubectl get nodes
If everything is working correctly, you should see all three nodes (one master, two workers) in a
Readystate.
Step 3: Verify All Pods Are Running
Check if all cluster components and networking pods are operational
kubectl get pods -A
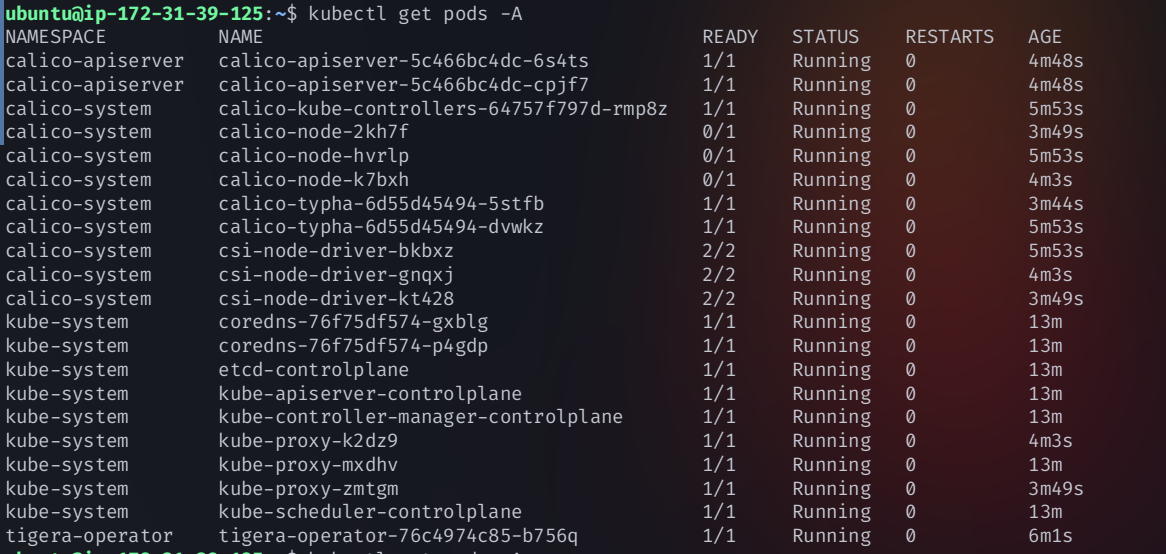
✔ If all pods are running correctly, your cluster is now stable.
If some Calico pods are not running, follow the troubleshooting steps below.
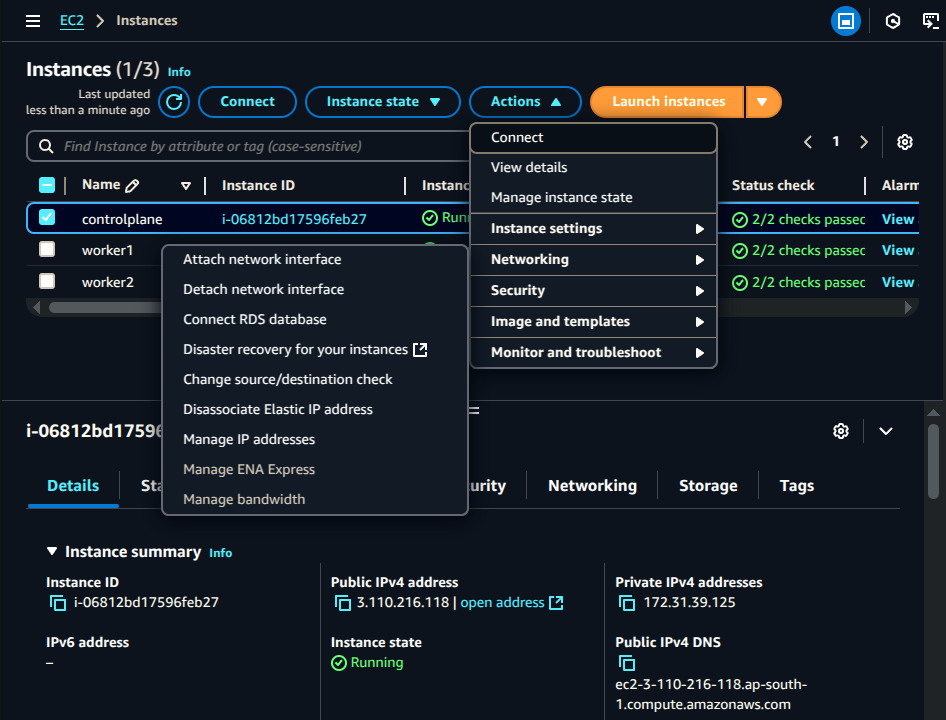
Step 4: Disable Source/Destination Checks (AWS Only)
AWS enforces Source/Destination Checks, which can interfere with Kubernetes networking, especially when using Calico, Flannel, or Cilium CNIs.
To disable this check on all nodes (master + workers):
Go to AWS EC2 Dashboard → Instances
Select all Kubernetes nodes (master & workers)
Click Actions → Networking → Change Source/Destination Check
Select Disable and confirm ✅
🔍 Why Disable Source/Destination Checks?
Kubernetes networking often involves asymmetric routing (packets leave from one interface but return through another).
AWS blocks asymmetric routing by default, which breaks pod communication.
Disabling this allows proper routing across nodes.
Step 5: Allow Bidirectional Traffic on TCP Port 179 (Calico CNI Only)
If using Calico CNI, you need to allow BGP (Border Gateway Protocol) traffic between nodes on TCP port 179.
Configure Security Group Rules
Go to AWS EC2 Dashboard → Security Groups
Find the security group attached to your Kubernetes nodes
Click on Inbound Rules → Edit Inbound Rules → Add Rule
Type: Custom TCP Rule
Protocol: TCP
Port Range: 179
Source:
0.0.0.0/0(not recommended for production)OR Your VPC CIDR (e.g.,
10.0.0.0/16)
Click Save Rules ✅
Now, edit Outbound Rules:
Click Outbound Rules → Edit Outbound Rules → Add Rule
Type: Custom TCP Rule
Protocol: TCP
Port Range: 179
Destination:
0.0.0.0/0(for all hosts)OR Your VPC CIDR (for internal traffic)
6️⃣ Click Save Rules ✅
🎯 Final Step: Verify Everything is Running
Run the following command again to ensure that all pods are running successfully:
kubectl get pods -A
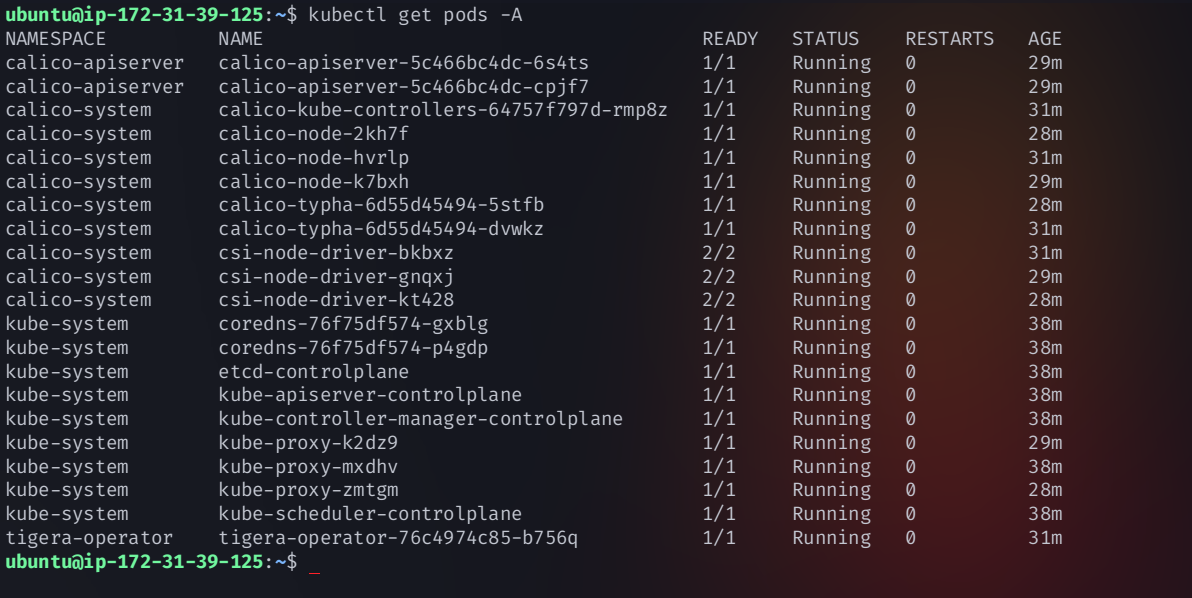
🎉 Congratulations! Your Kubernetes Cluster is Now Fully Functional and Ready for Workloads! 🚀
Your Kubernetes cluster is now complete with a fully operational control plane and worker nodes. You’re now ready to deploy applications and manage workloads effectively.
🔒 Perform a Security Audit Using Kubeaudit
To ensure the security of your Kubernetes cluster, use Kubeaudit—a security auditing tool developed by Shopify. It helps identify misconfigurations, security vulnerabilities, and best practice violations in your cluster.
Step 1: Install Kubeaudit on Ubuntu
Run the following commands on your control plane (master node)
wget https://github.com/Shopify/kubeaudit/releases/download/v0.22.2/kubeaudit_0.22.2_linux_amd64.tar.gz
tar -xzf kubeaudit_0.22.2_linux_amd64.tar.gz  # Extract the tar.gz file
sudo mv kubeaudit /usr/local/bin/             # Move the binary to a system path
rm kubeaudit_0.22.2_linux_amd64.tar.gz        # Cleanup the tar.gz file
kubeaudit version                             # Verify installation
This will install Kubeaudit and verify that it's correctly set up.
Step 2: Scan the Cluster for Security Issues
Run the following command to audit the cluster and check for security misconfigurations
kubeaudit all
📌 What does this command do?
Scans all Kubernetes objects for security vulnerabilities
Detects misconfigurations in RBAC, PodSecurity, and container settings
Provides remediation steps to fix issues
🛠 Setup SonarQube and Nexus Server
To implement code quality analysis (SonarQube) and artifact management (Nexus Repository Manager) in your CI/CD pipeline, follow these steps.
Launch EC2 Instances for SonarQube and Nexus
Go to AWS Console → Click Launch an Instance
Configure two EC2 instances:
AMI: Ubuntu
Instance Type:
t2.medium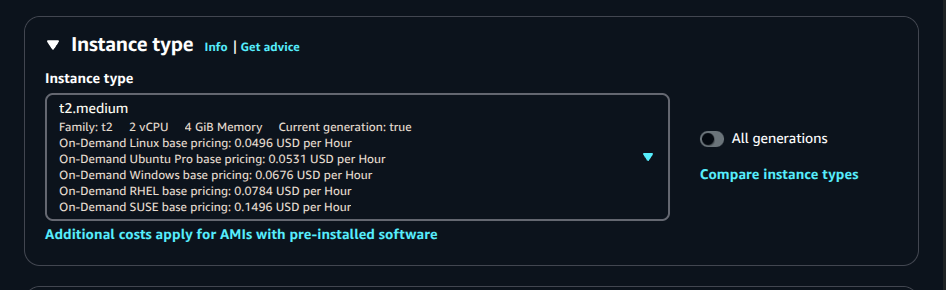
Storage:
20 GiBor more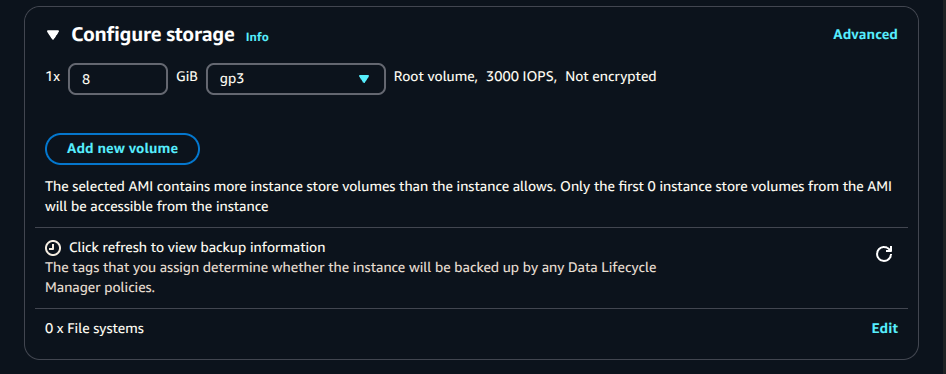
Number of Instances:
2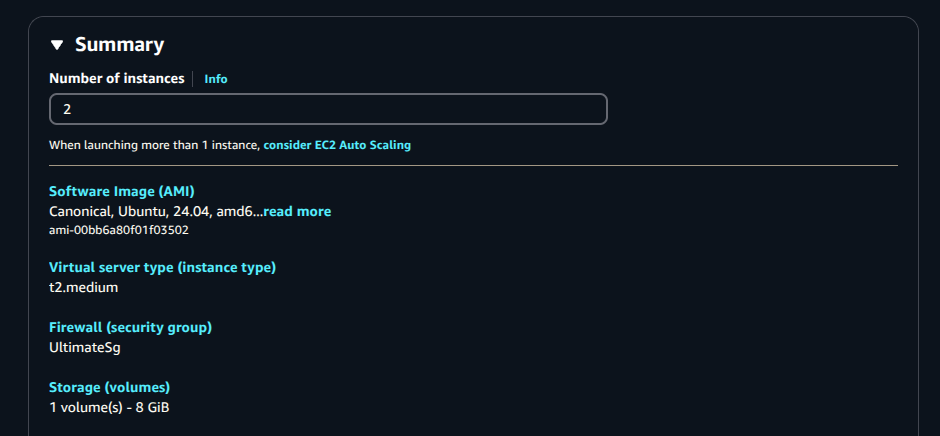
Click Launch Instance
Rename instances to:
SonarQubeNexus
Connect to Instances via SSH
Connect to each instance from your terminal:
ssh -i <path-to-pem-file> ubuntu@<private-ip>
Once connected, update the system:
sudo apt update
Install Docker on Both Servers
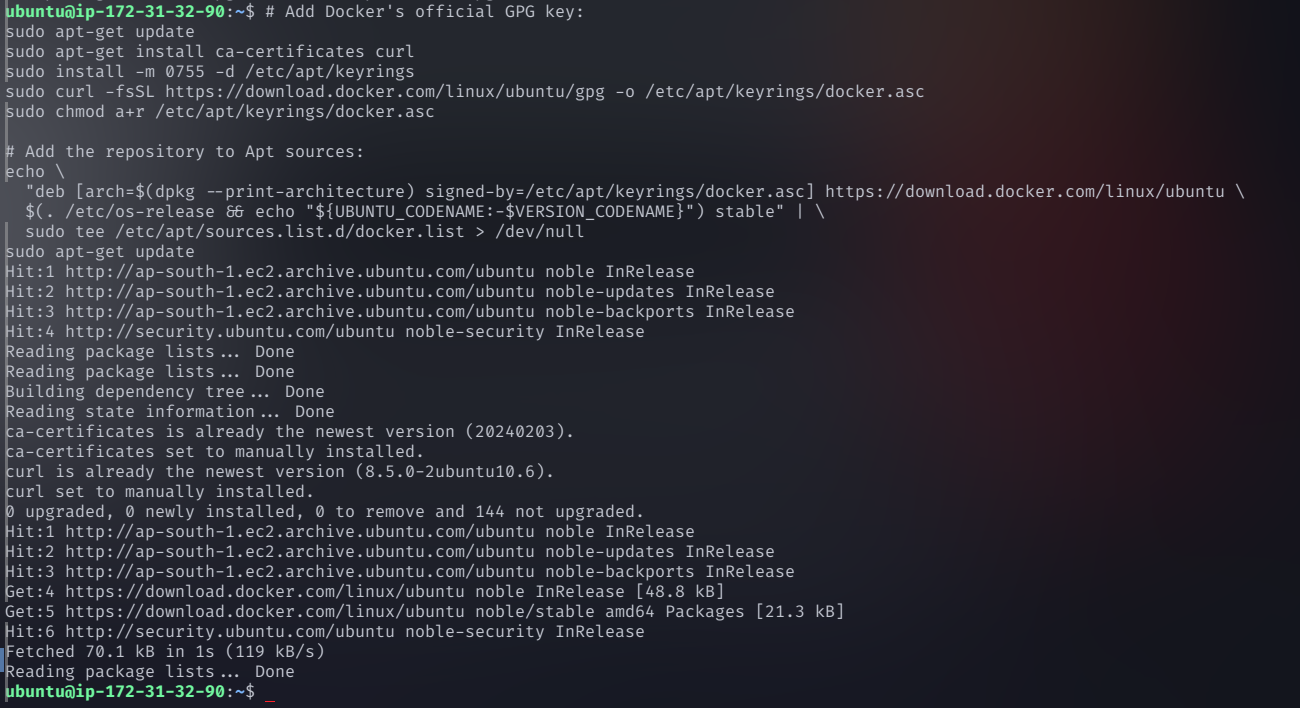
Step 1: Install Dependencies
sudo apt-get update
sudo apt-get install -y ca-certificates curl
Step 2: Add Docker's Official GPG Key
sudo install -m 0755 -d /etc/apt/keyrings
sudo curl -fsSL https://download.docker.com/linux/ubuntu/gpg -o /etc/apt/keyrings/docker.asc
sudo chmod a+r /etc/apt/keyrings/docker.asc
Step 3: Add the Docker Repository
echo \
  "deb [arch=$(dpkg --print-architecture) signed-by=/etc/apt/keyrings/docker.asc] https://download.docker.com/linux/ubuntu \
  $(. /etc/os-release && echo "${UBUNTU_CODENAME:-$VERSION_CODENAME}") stable" | \
  sudo tee /etc/apt/sources.list.d/docker.list > /dev/null
sudo apt-get update
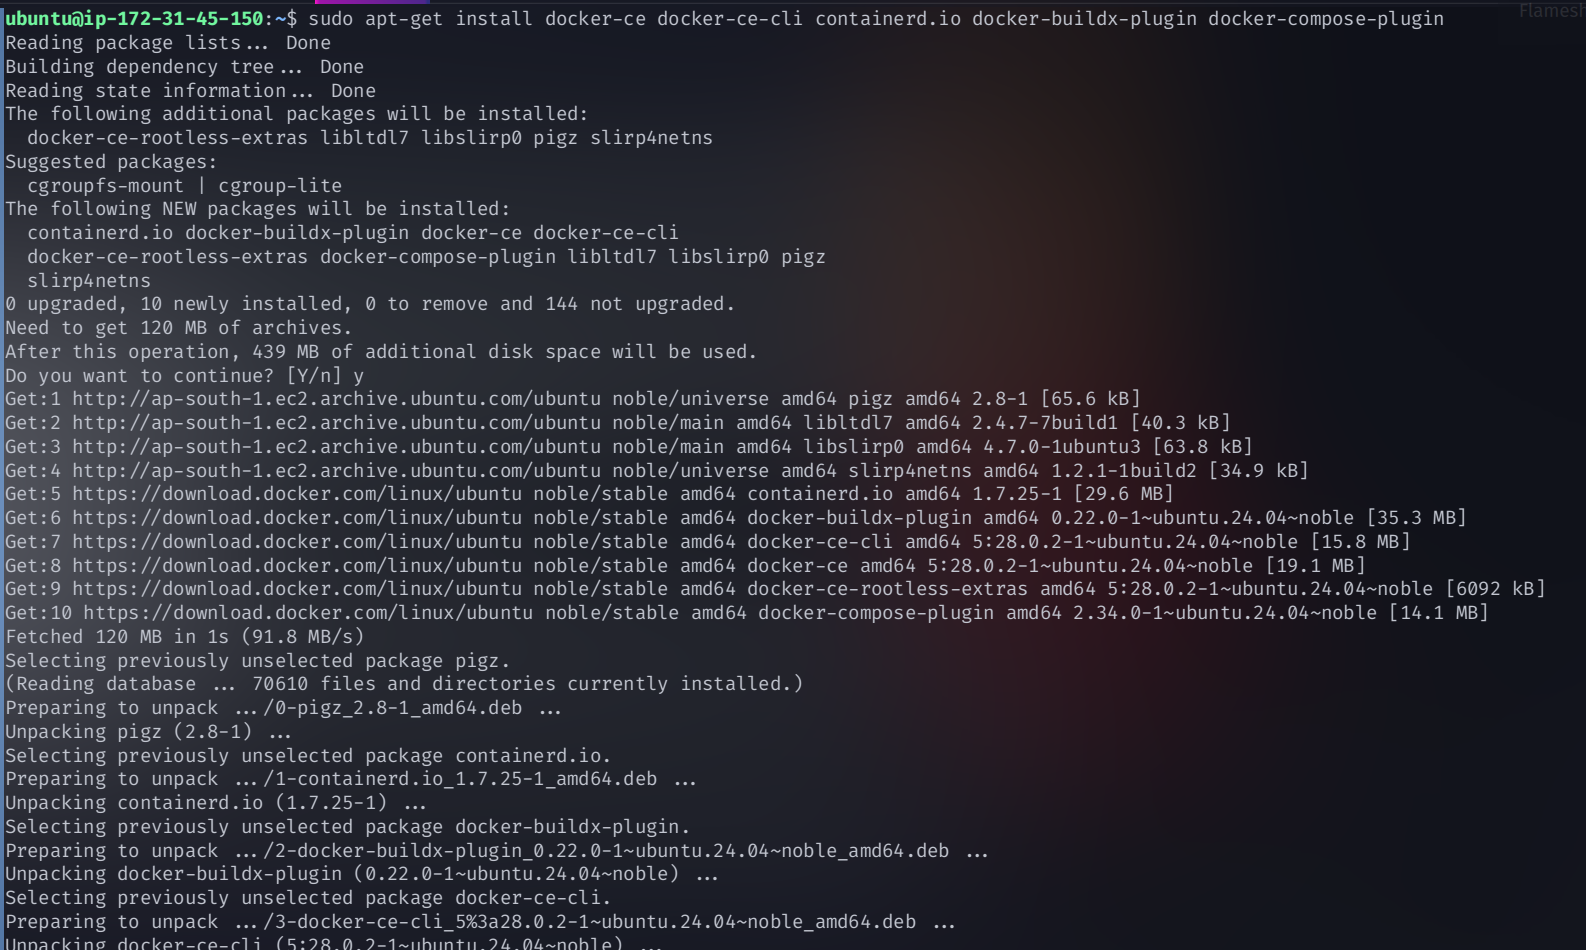
Step 4: Install Docker
sudo apt-get install -y docker-ce docker-ce-cli containerd.io docker-buildx-plugin docker-compose-plugin
Step 5: Allow Docker Without sudo
sudo chmod 666 /var/run/docker.sock
Deploy SonarQube on the SonarQube Server
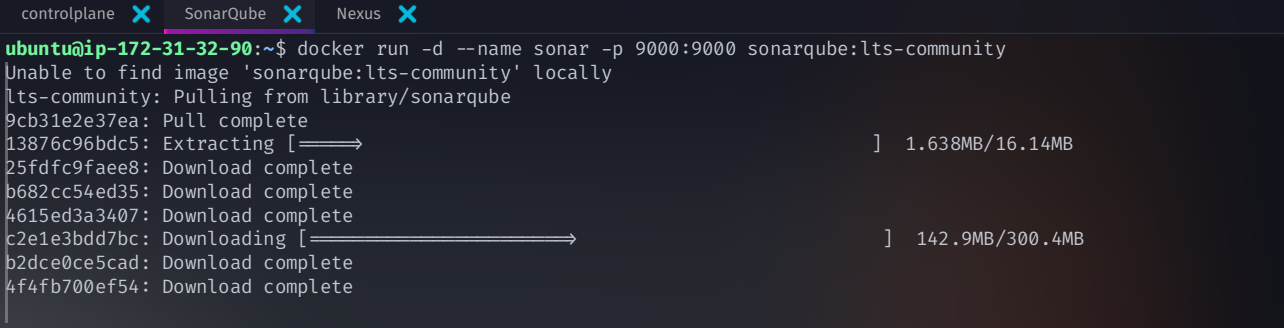
Run the following command on the SonarQube EC2 instance
docker run -d --name sonar -p 9000:9000 sonarqube:lts-community

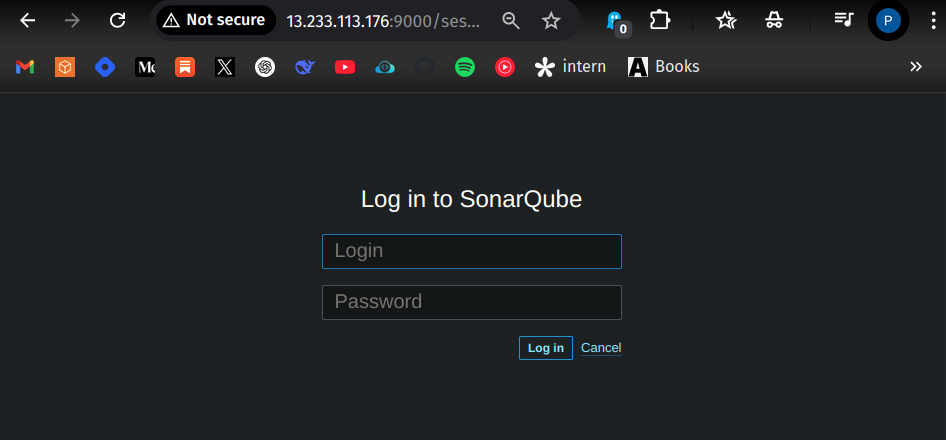
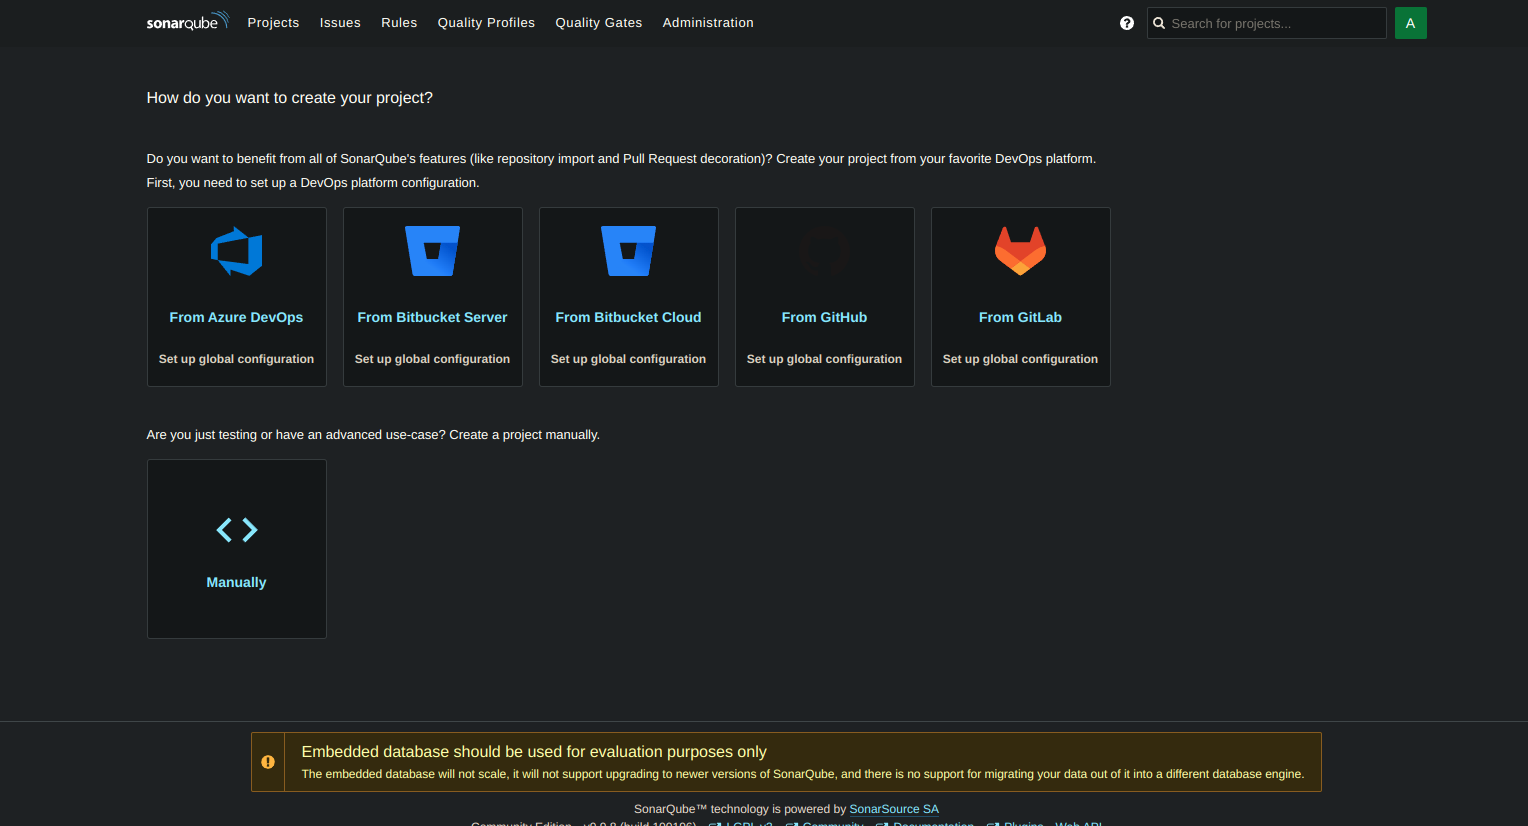
Access SonarQube Dashboard
📌 Open your browser and go to:http://<SonarQube-server-public-IP>:9000
Default Credentials
Username:
adminPassword:
admin
After logging in, update the default password for security
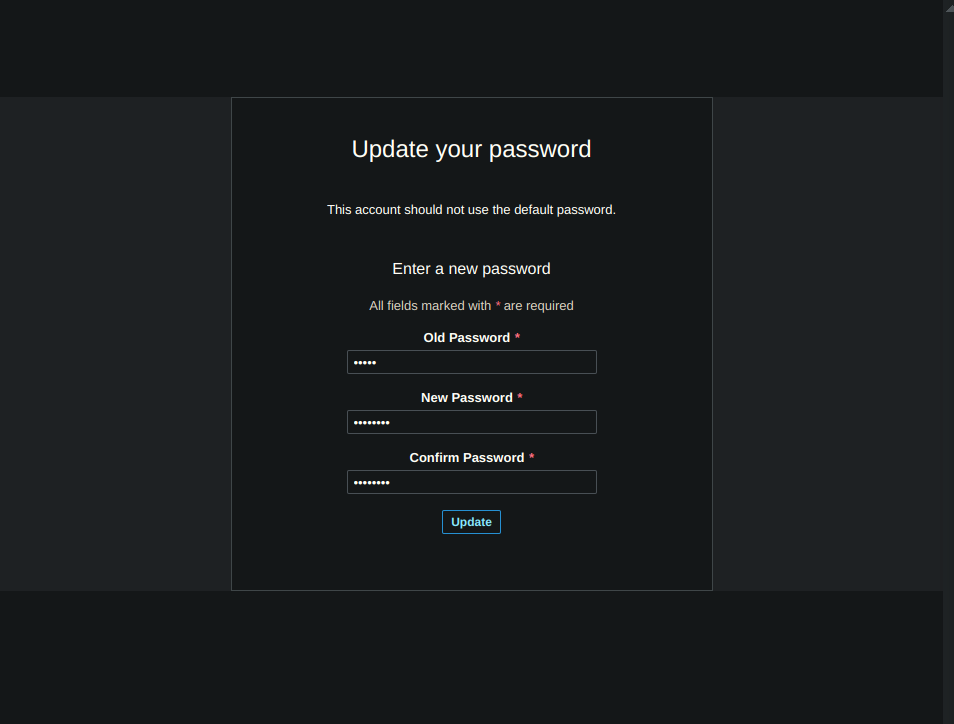
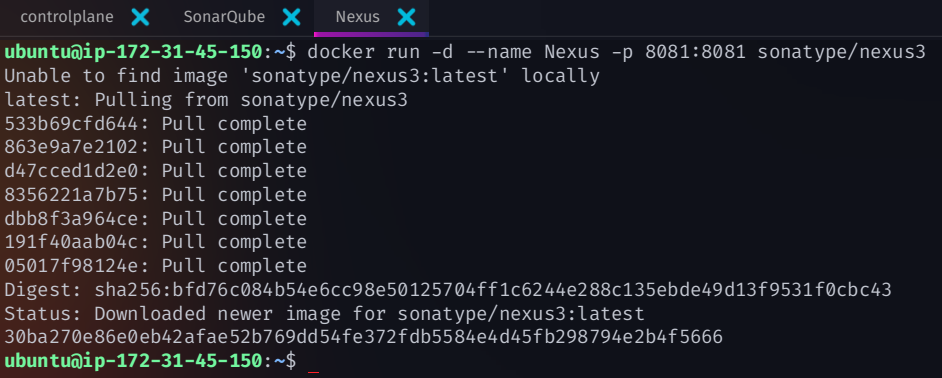
Deploy Nexus on the Nexus Server
Run this command on the Nexus EC2 instance:
docker run -d --name nexus -p 8081:8081 sonatype/nexus3

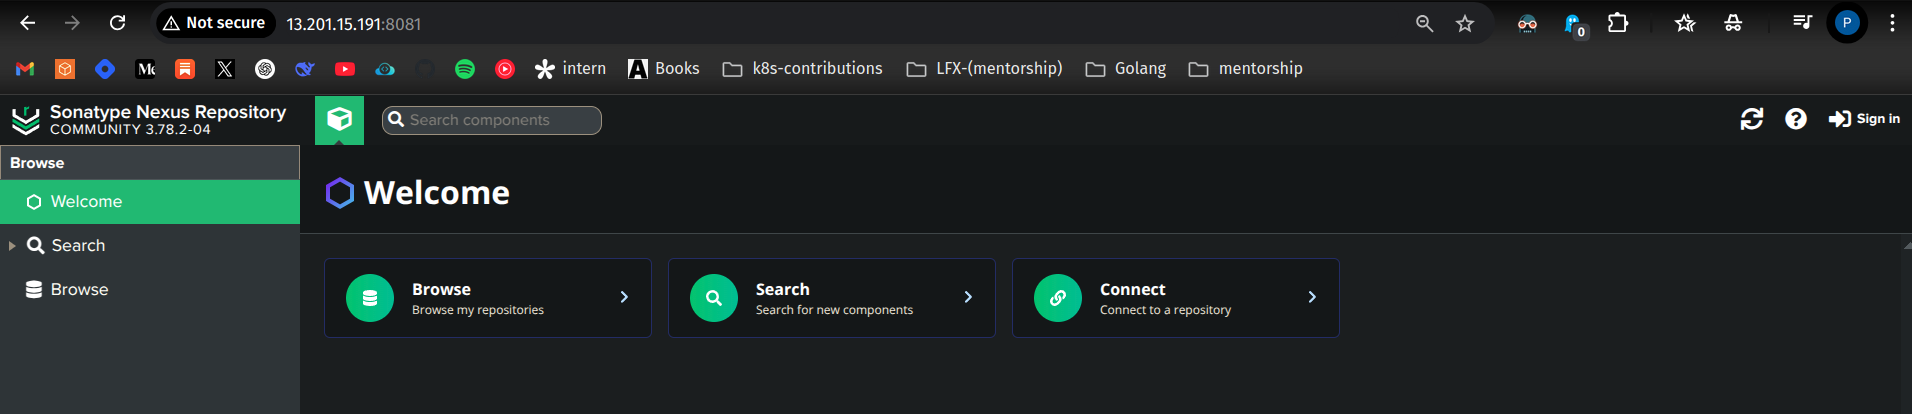
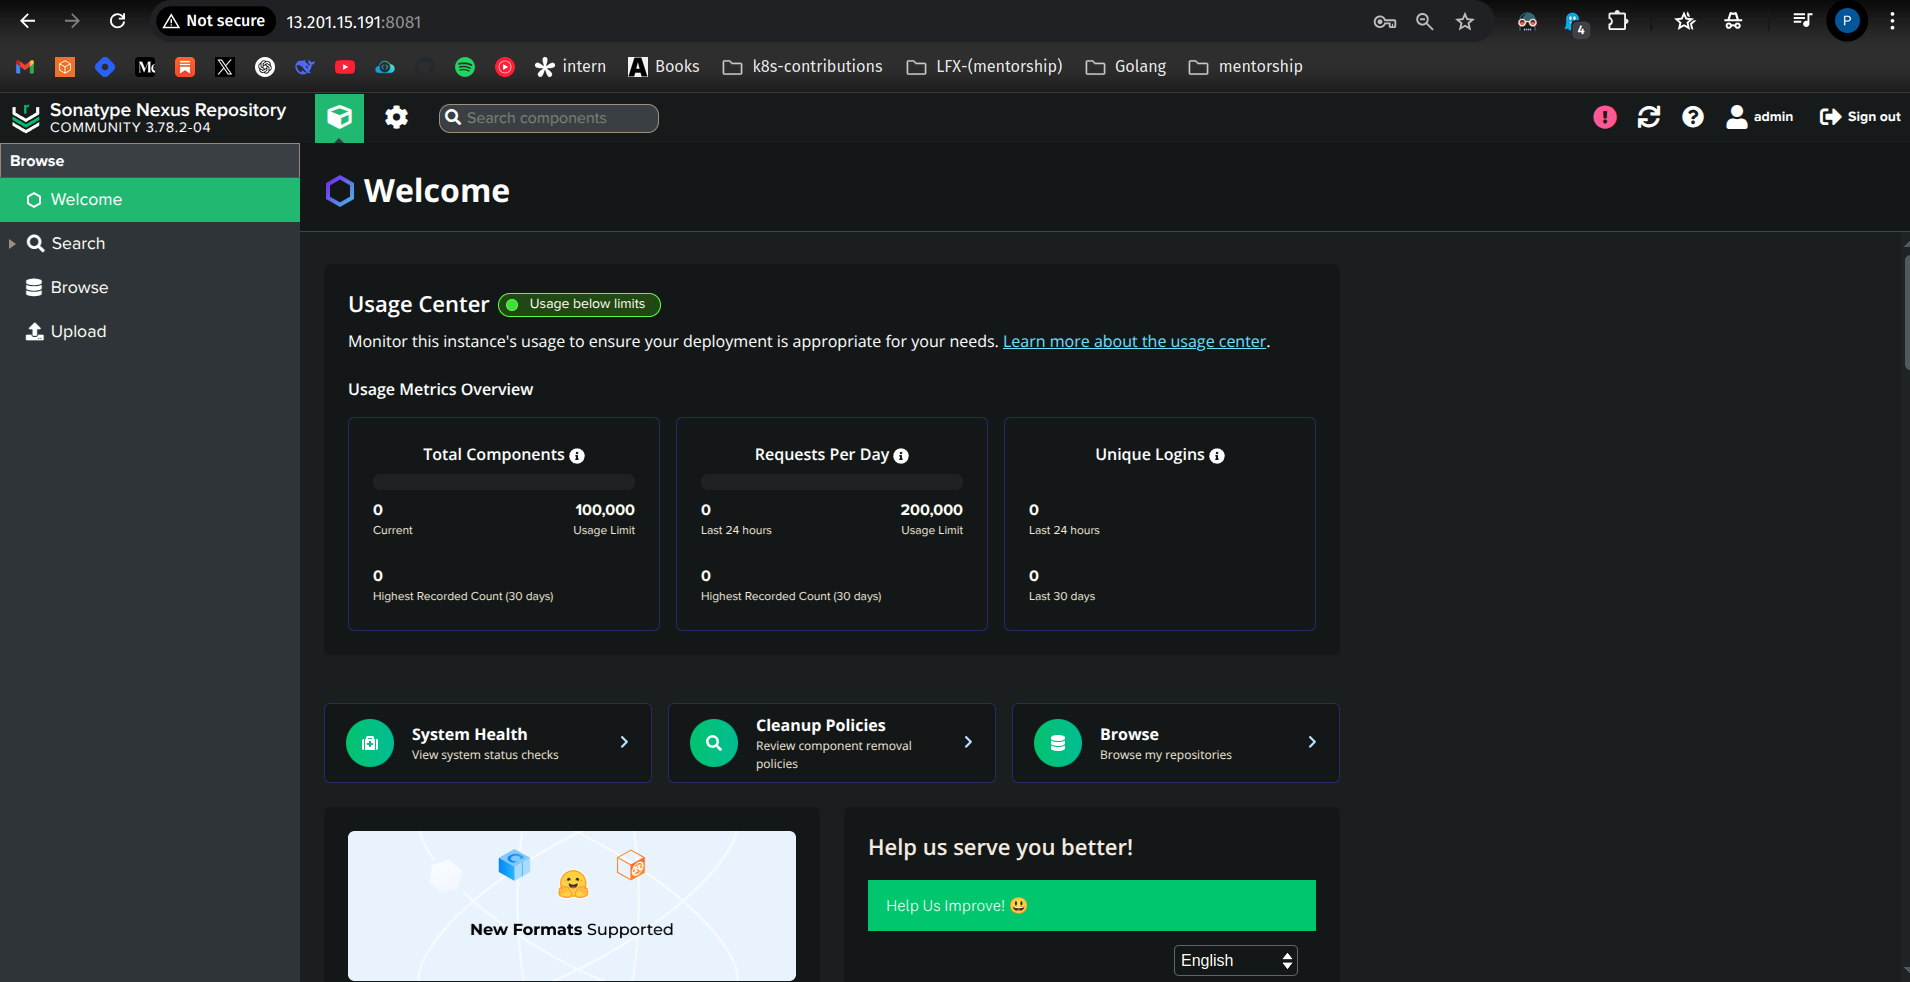
Access Nexus Dashboard
📌 Open your browser and go to: http://<Nexus-server-public-IP>:8081
Retrieve Admin Password
To log in, first find the default admin password:
docker exec -it nexus /bin/bash
cat sonatype-work/nexus3/admin.password
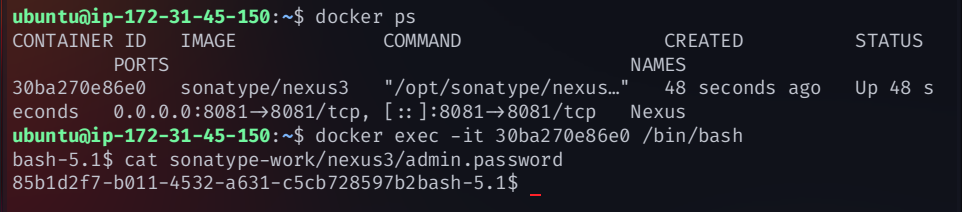
Use this admin password to log in.
Username:
adminPassword: (from the above command)
Set a new password and enable anonymous access if needed.
Configure Nexus Repository in pom.xml
Go to Nexus Web UI
Click Browse → Look for:
Maven Releases
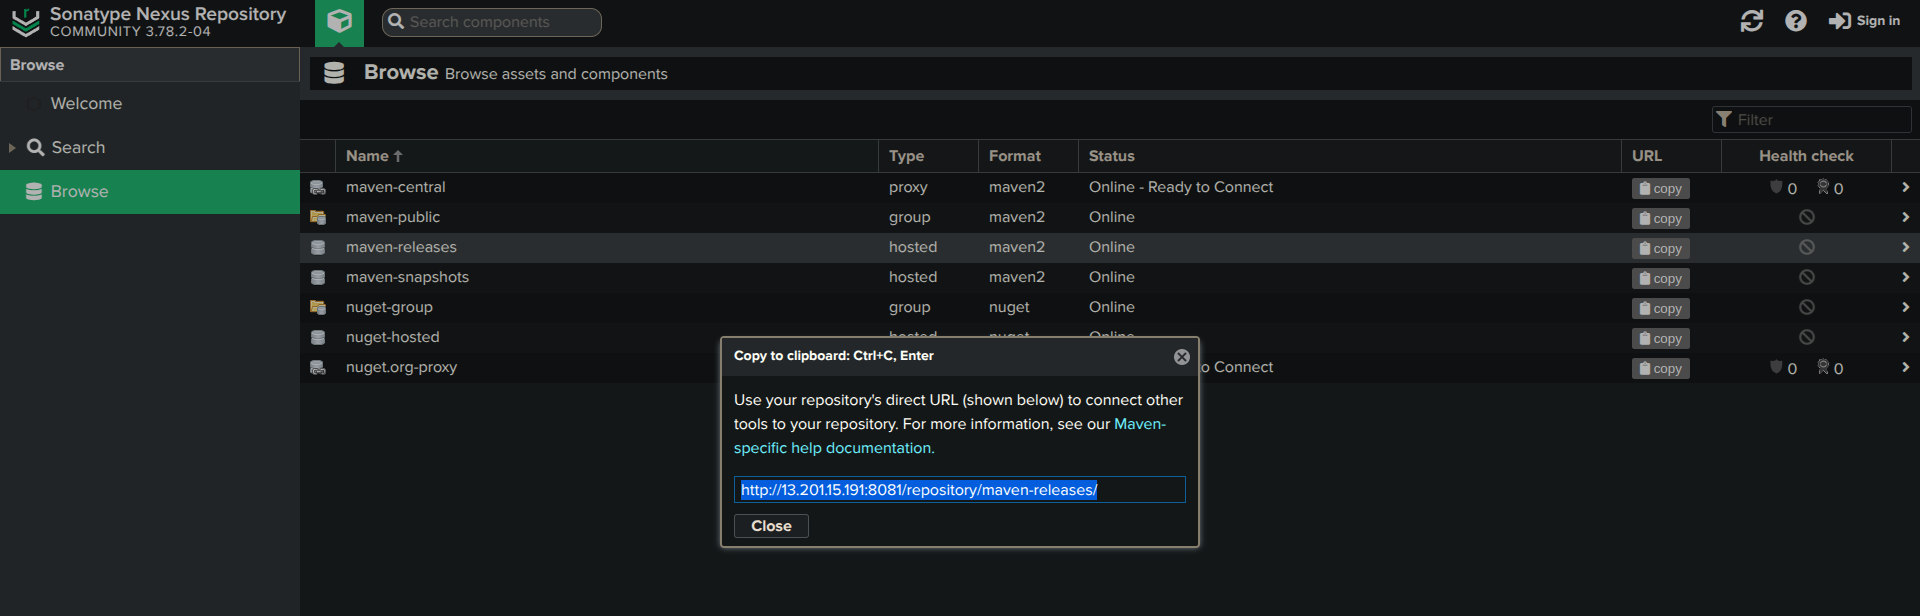
Maven Snapshots
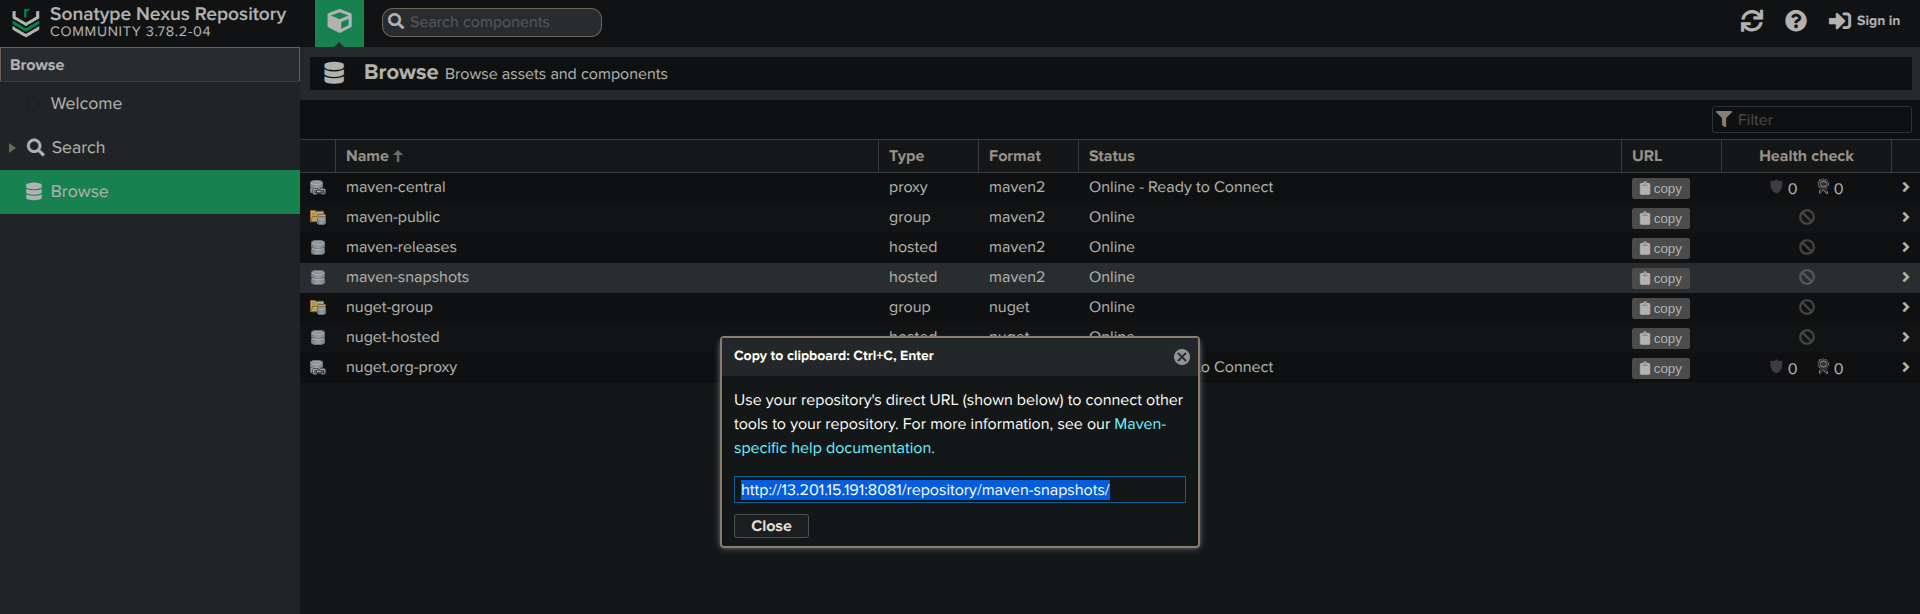
Copy the repository URL
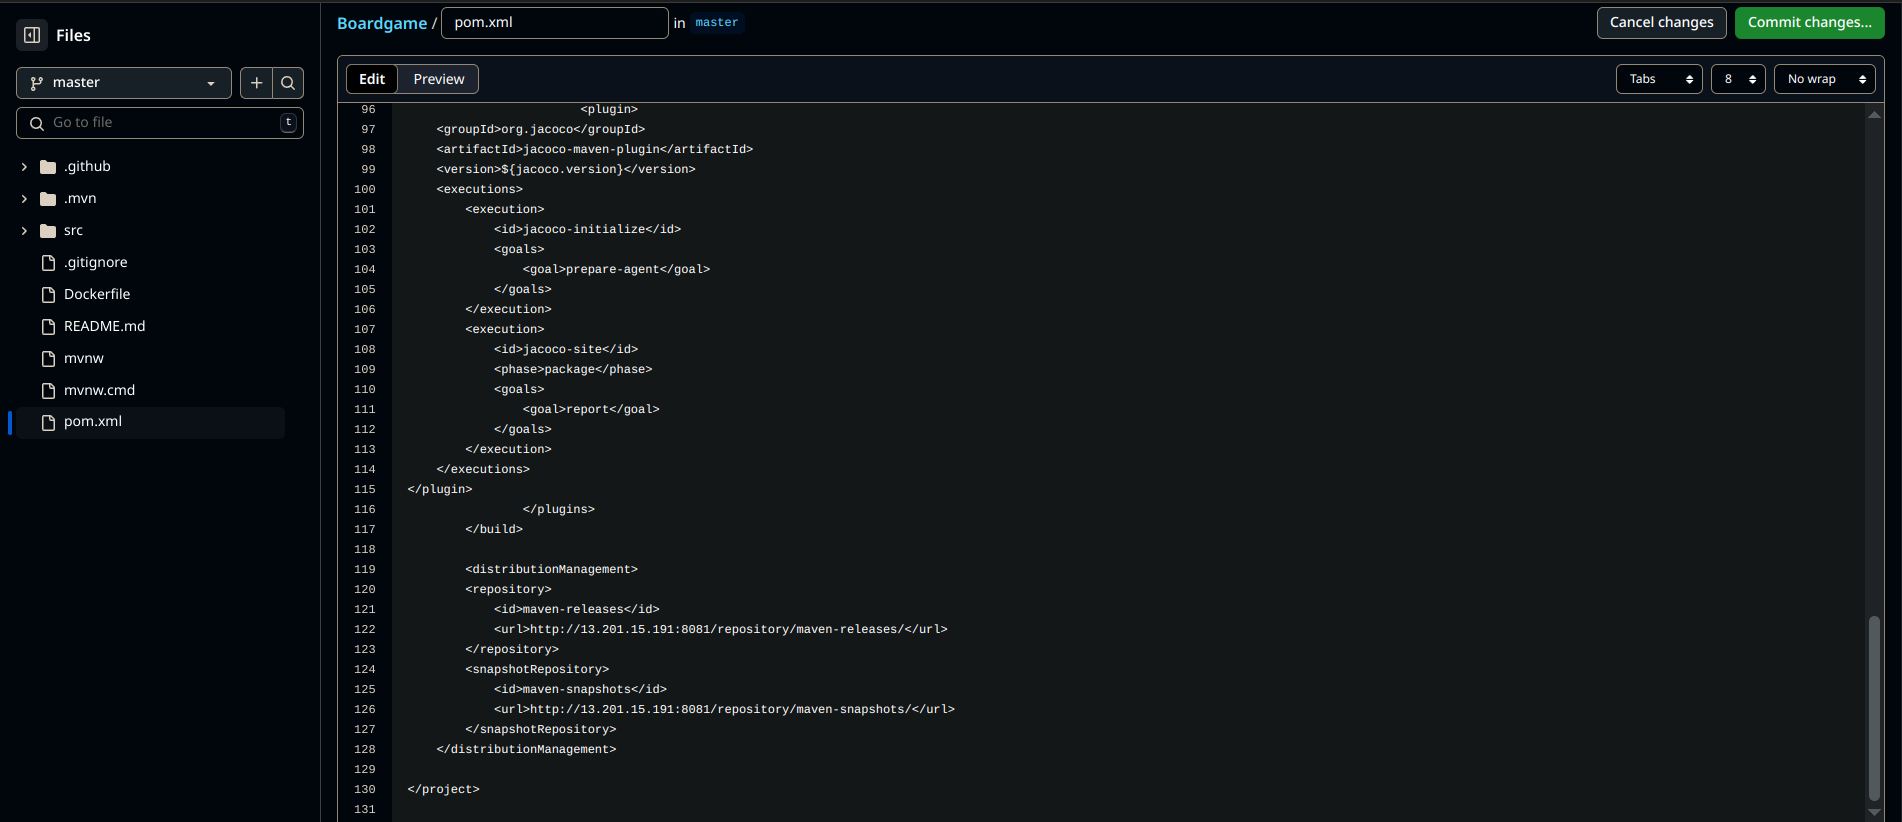
Add it to your project's
pom.xmlfile:
<distributionManagement>
    <repository>
        <id>nexus-releases</id>
        <url>http://<Nexus-server-public-IP>:8081/repository/maven-releases/</url>
    </repository>
    <snapshotRepository>
        <id>nexus-snapshots</id>
        <url>http://<Nexus-server-public-IP>:8081/repository/maven-snapshots/</url>
    </snapshotRepository>
</distributionManagement>
🎯 Final Verification
Check if SonarQube is Running:
docker ps | grep sonarYou should see the
sonarqubecontainer running.Check if Nexus is Running:
docker ps | grep nexusYou should see the
nexuscontainer running.Test SonarQube Web Access:
Open:http://<SonarQube-server-public-IP>:9000Test Nexus Web Access:
Open:http://<Nexus-server-public-IP>:8081
🎉 SonarQube and Nexus Are Now Set Up! 🚀
SonarQube is ready for code quality analysis
Nexus is ready for artifact storage
🚀 Set Up Jenkins Server on AWS
Jenkins is a powerful automation server widely used for CI/CD pipelines. This guide will help you set up Jenkins on an AWS EC2 instance, install necessary dependencies, and configure it for seamless use.
Launch an EC2 Instance for Jenkins
Go to AWS Console → Click Launch an Instance
Configure the instance:
Name:
Jenkins ServerAMI: Ubuntu (latest LTS recommended)
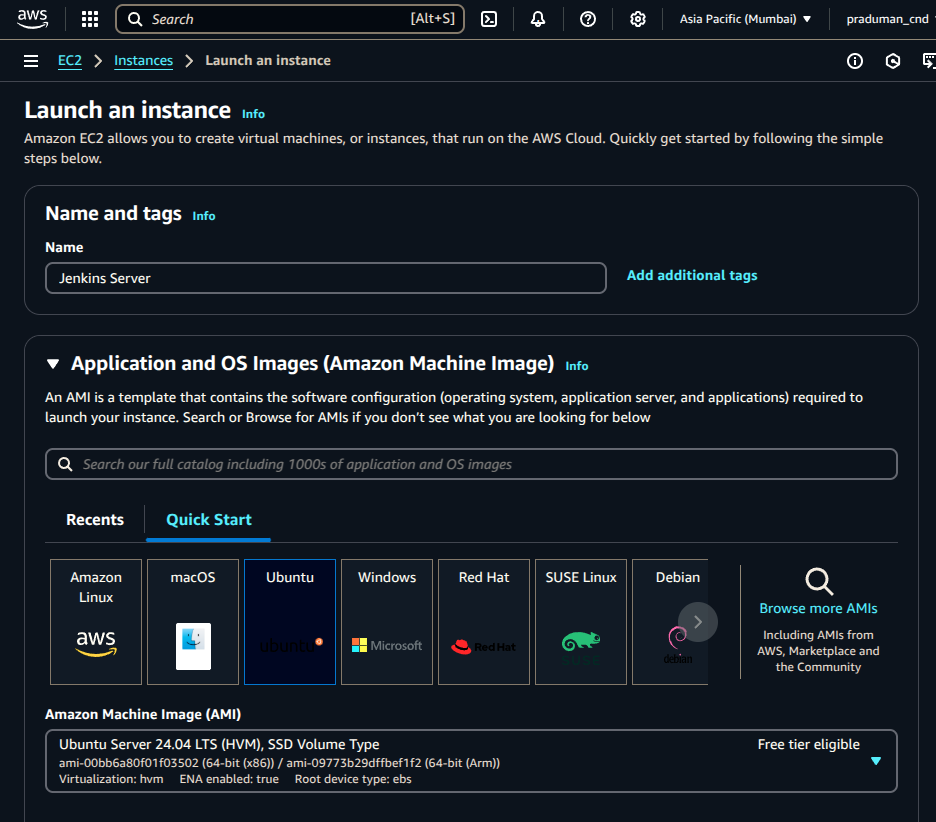
Instance Type:
t2.large(At least 2 vCPUs and 8 GB RAM for smooth builds)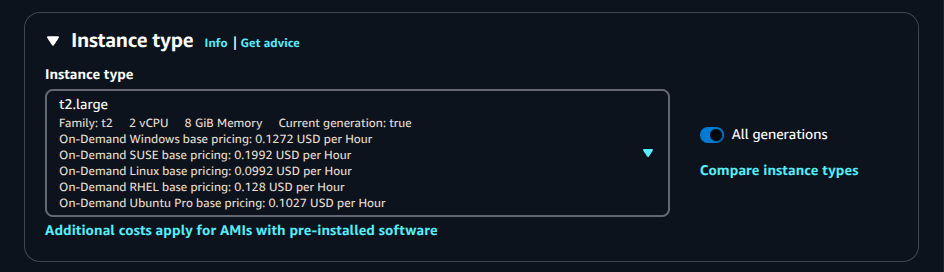
Storage:
30 GiB(Jenkins jobs & artifacts require storage)Number of Instances:
1
Click Launch Instance
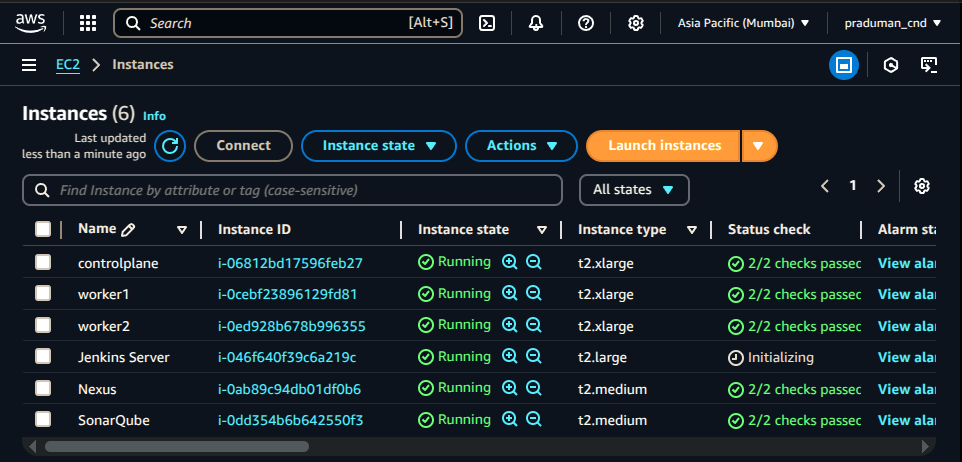
Once running, copy the public IP of the Jenkins instance from the AWS Console.
Connect to the Jenkins Server via SSH
Use SSH to connect from your local machine:
ssh -i <path-of-pem-file> ubuntu@<jenkins-server-IP>
Replace <path-of-pem-file> with your private key path and <jenkins-server-IP> with your instance's public IP.
Update the System
To ensure the latest security patches and package versions, run:
sudo apt update && sudo apt upgrade -y
Install Jenkins
Step 1: Install Java (Required for Jenkins)
sudo apt install -y openjdk-17-jdk-headless
Step 2: Install Jenkins Using Official Repository
# Add Jenkins repository key
sudo wget -O /usr/share/keyrings/jenkins-keyring.asc \
  https://pkg.jenkins.io/debian-stable/jenkins.io-2023.key

# Add Jenkins repository to sources list
echo "deb [signed-by=/usr/share/keyrings/jenkins-keyring.asc] \
  https://pkg.jenkins.io/debian-stable binary/" | sudo tee \
  /etc/apt/sources.list.d/jenkins.list > /dev/null

# Update package lists and install Jenkins
sudo apt-get update
sudo apt-get install -y jenkins
Step 3: Start & Verify Jenkins Service
sudo systemctl start jenkins
sudo systemctl enable jenkins
sudo systemctl status jenkins
Install Docker (for Running Jenkins Builds in Containers)
Step 1: Install Dependencies
sudo apt-get install -y ca-certificates curl
Step 2: Add Docker’s Official GPG Key
sudo install -m 0755 -d /etc/apt/keyrings
sudo curl -fsSL https://download.docker.com/linux/ubuntu/gpg -o /etc/apt/keyrings/docker.asc
sudo chmod a+r /etc/apt/keyrings/docker.asc
Step 3: Add Docker Repository
echo \
  "deb [arch=$(dpkg --print-architecture) signed-by=/etc/apt/keyrings/docker.asc] \
  https://download.docker.com/linux/ubuntu $(. /etc/os-release && echo "${UBUNTU_CODENAME:-$VERSION_CODENAME}") stable" | \
  sudo tee /etc/apt/sources.list.d/docker.list > /dev/null
Step 4: Install Docker
sudo apt-get update
sudo apt-get install -y docker-ce docker-ce-cli containerd.io docker-buildx-plugin docker-compose-plugin
Step 5: Allow Jenkins to Use Docker Without sudo
sudo chmod 666 /var/run/docker.sock
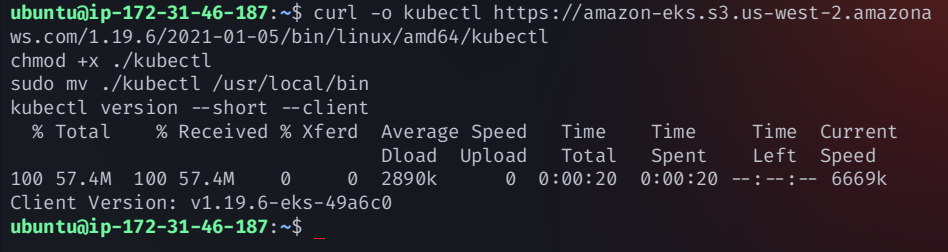
Install kubectl (for Kubernetes Integration)
Run the following command on the Jenkins server:
curl -o kubectl https://amazon-eks.s3.us-west-2.amazonaws.com/1.19.6/2021-01-05/bin/linux/amd64/kubectl
chmod +x ./kubectl
sudo mv ./kubectl /usr/local/bin
kubectl version --short --client
Access Jenkins Web Interface
Jenkins runs on port 8080 by default.
📌 Open your browser and visit: http://<Jenkins-server-public-IP>:8080
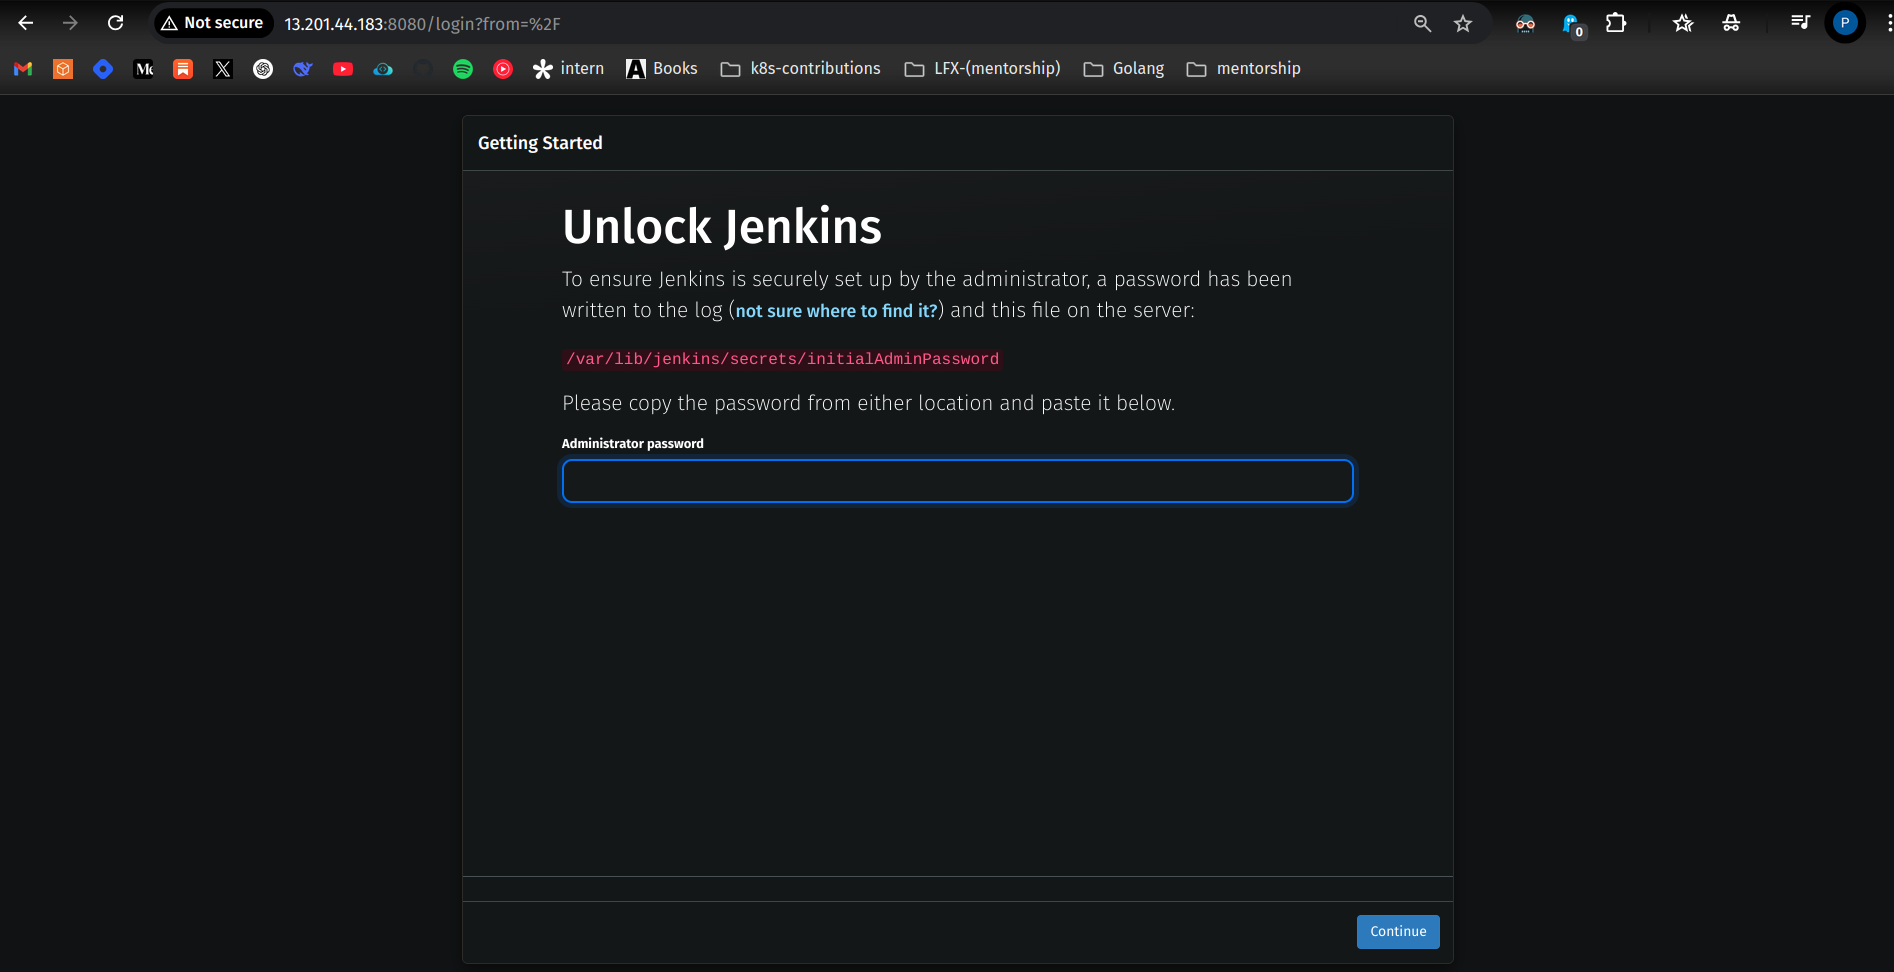
Retrieve Initial Admin Password
Run this command:
sudo cat /var/lib/jenkins/secrets/initialAdminPassword

Copy the admin password and paste it into the Jenkins web interface.
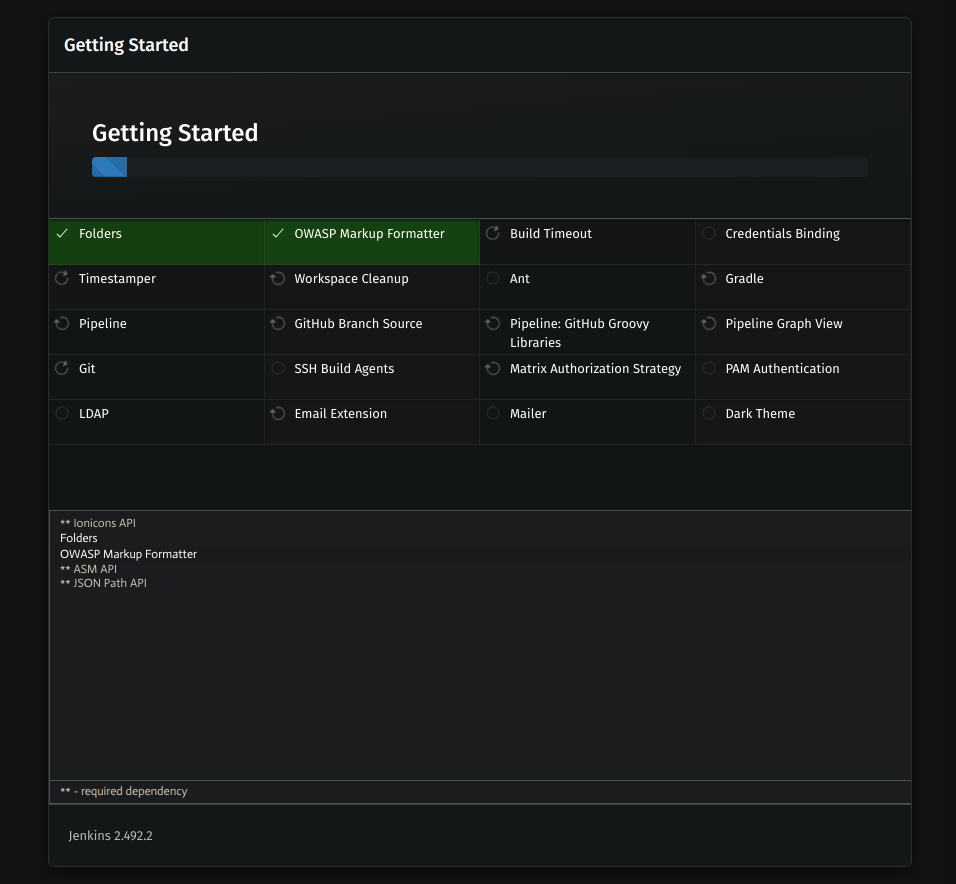
Jenkins Setup Wizard
Install Suggested Plugins (Recommended for most setups).
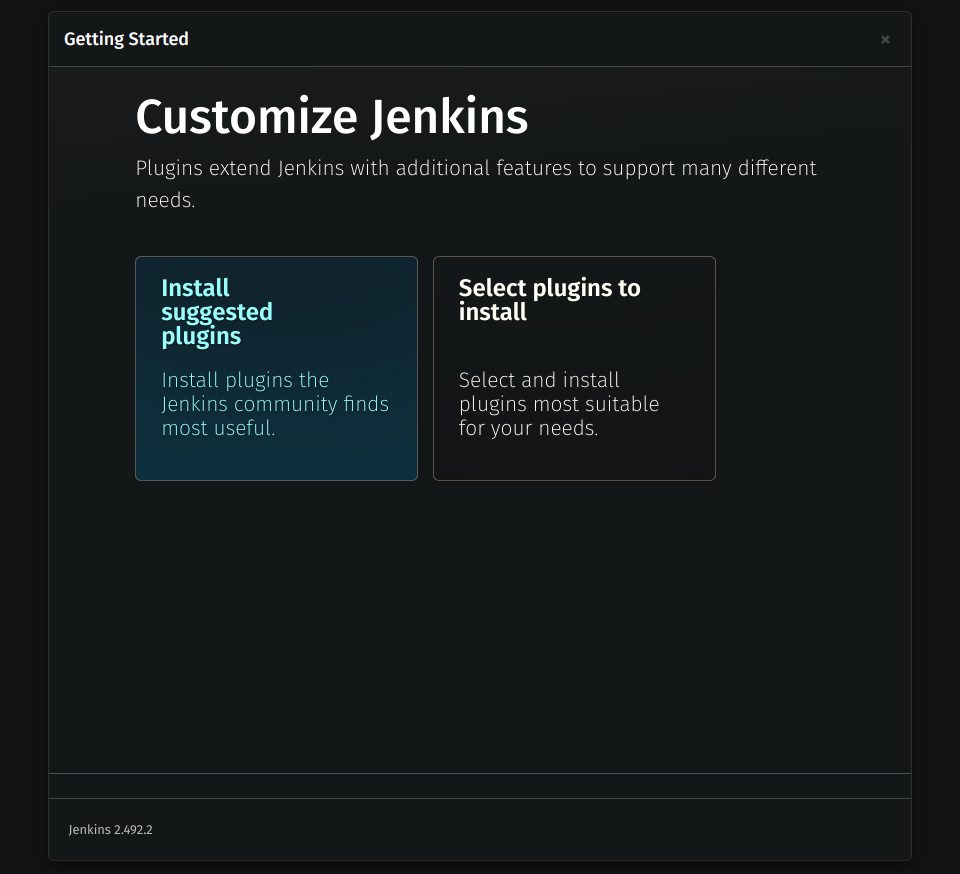
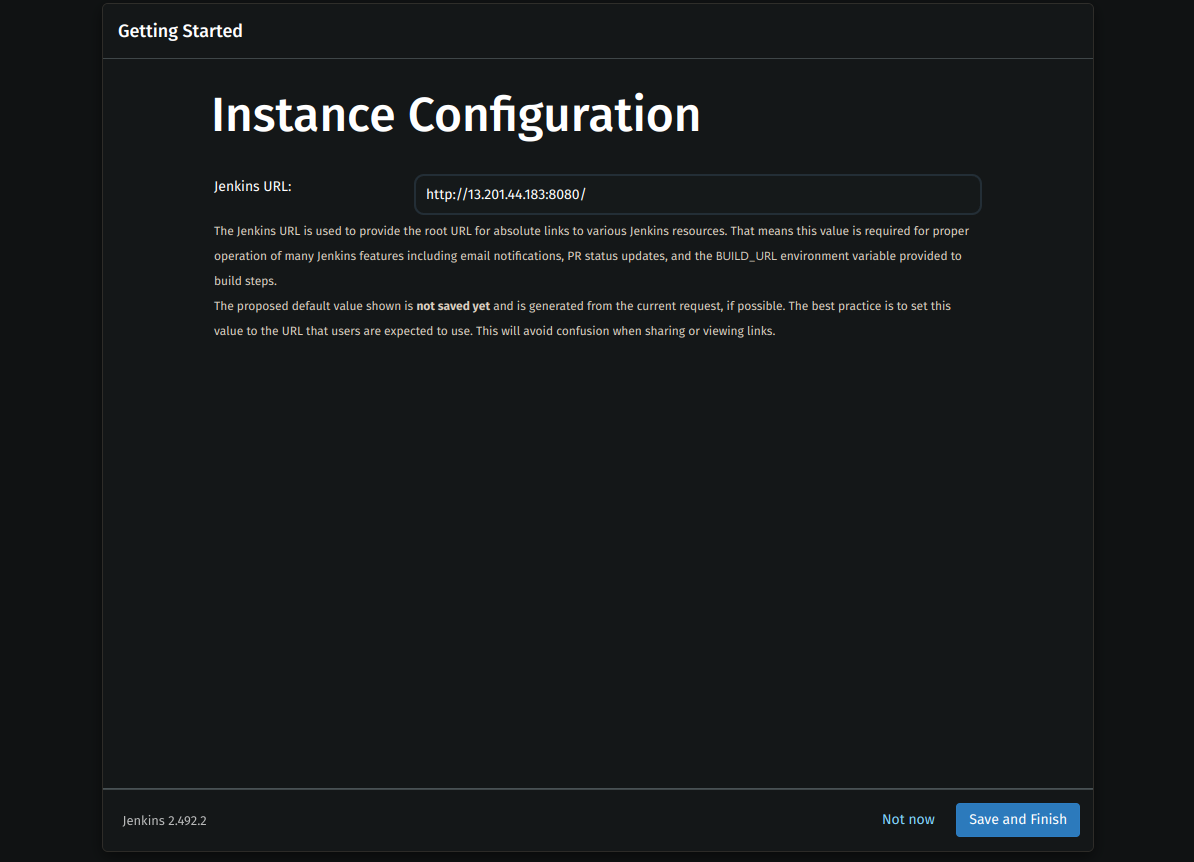
Create an Admin User (Set username, password, and email).
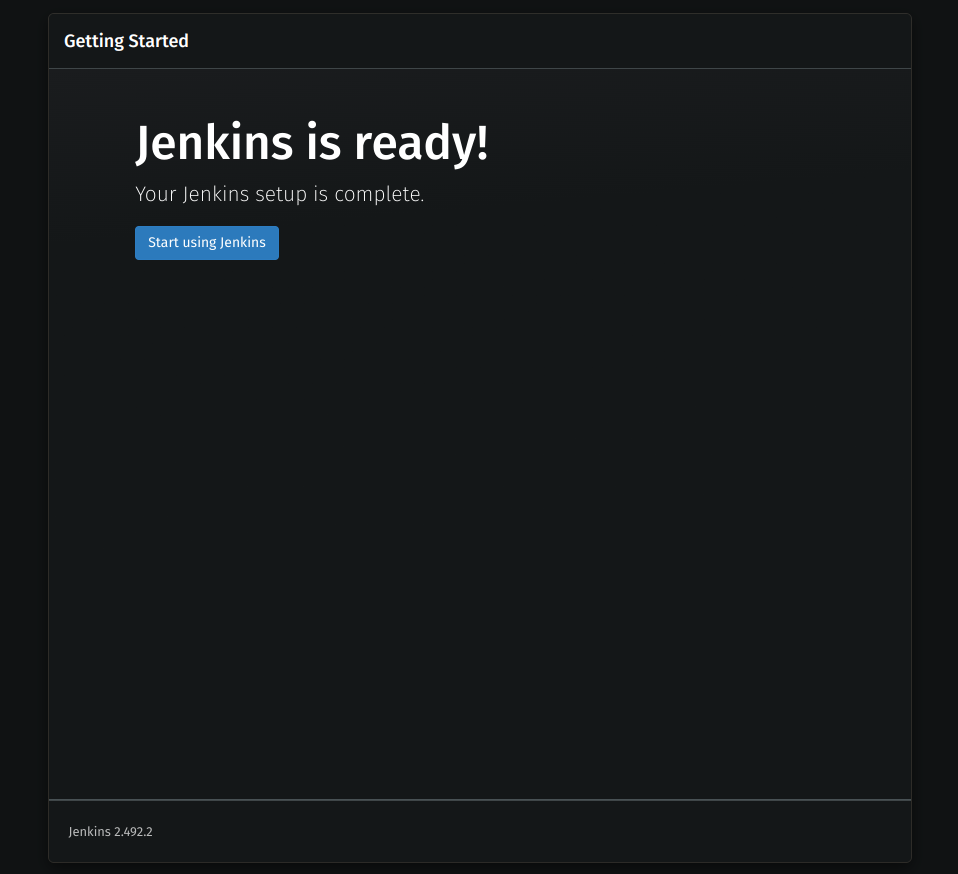
Start Using Jenkins 🎉
Install Required Jenkins Plugins
To enhance CI/CD functionality, install these plugins:
Step 1: Navigate to Plugin Manager
Manage Jenkins → Manage Plugins → Available Plugins
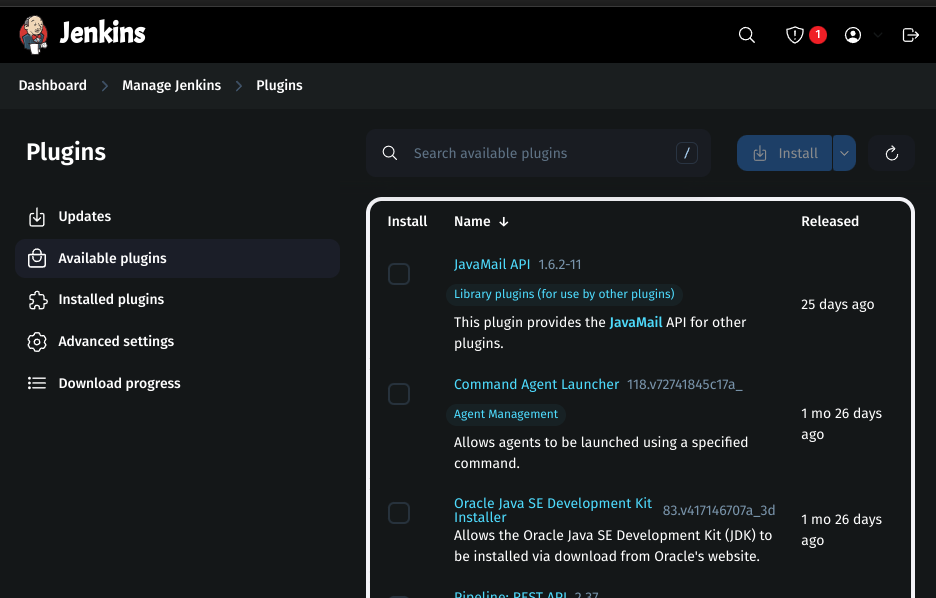
Step 2: Install the Following Plugins
Eclipse Temurin Installer (Installs required Java versions)
Config File Provider (Manages configuration files for builds)
Pipeline Maven Integration (For running Maven builds inside pipelines)
SonarQube Scanner (For static code analysis integration)
Docker (Integrates Docker with Jenkins)
Docker Pipeline (Allows defining Docker containers in pipelines)
Kubernetes (For running Jenkins on Kubernetes)
Kubernetes CLI (Provides
kubectlinside Jenkins)Kubernetes Credentials (Manages Kubernetes authentication)
Kubernetes Client API (Allows Jenkins to interact with Kubernetes clusters)
Maven Integration (For building Java projects)
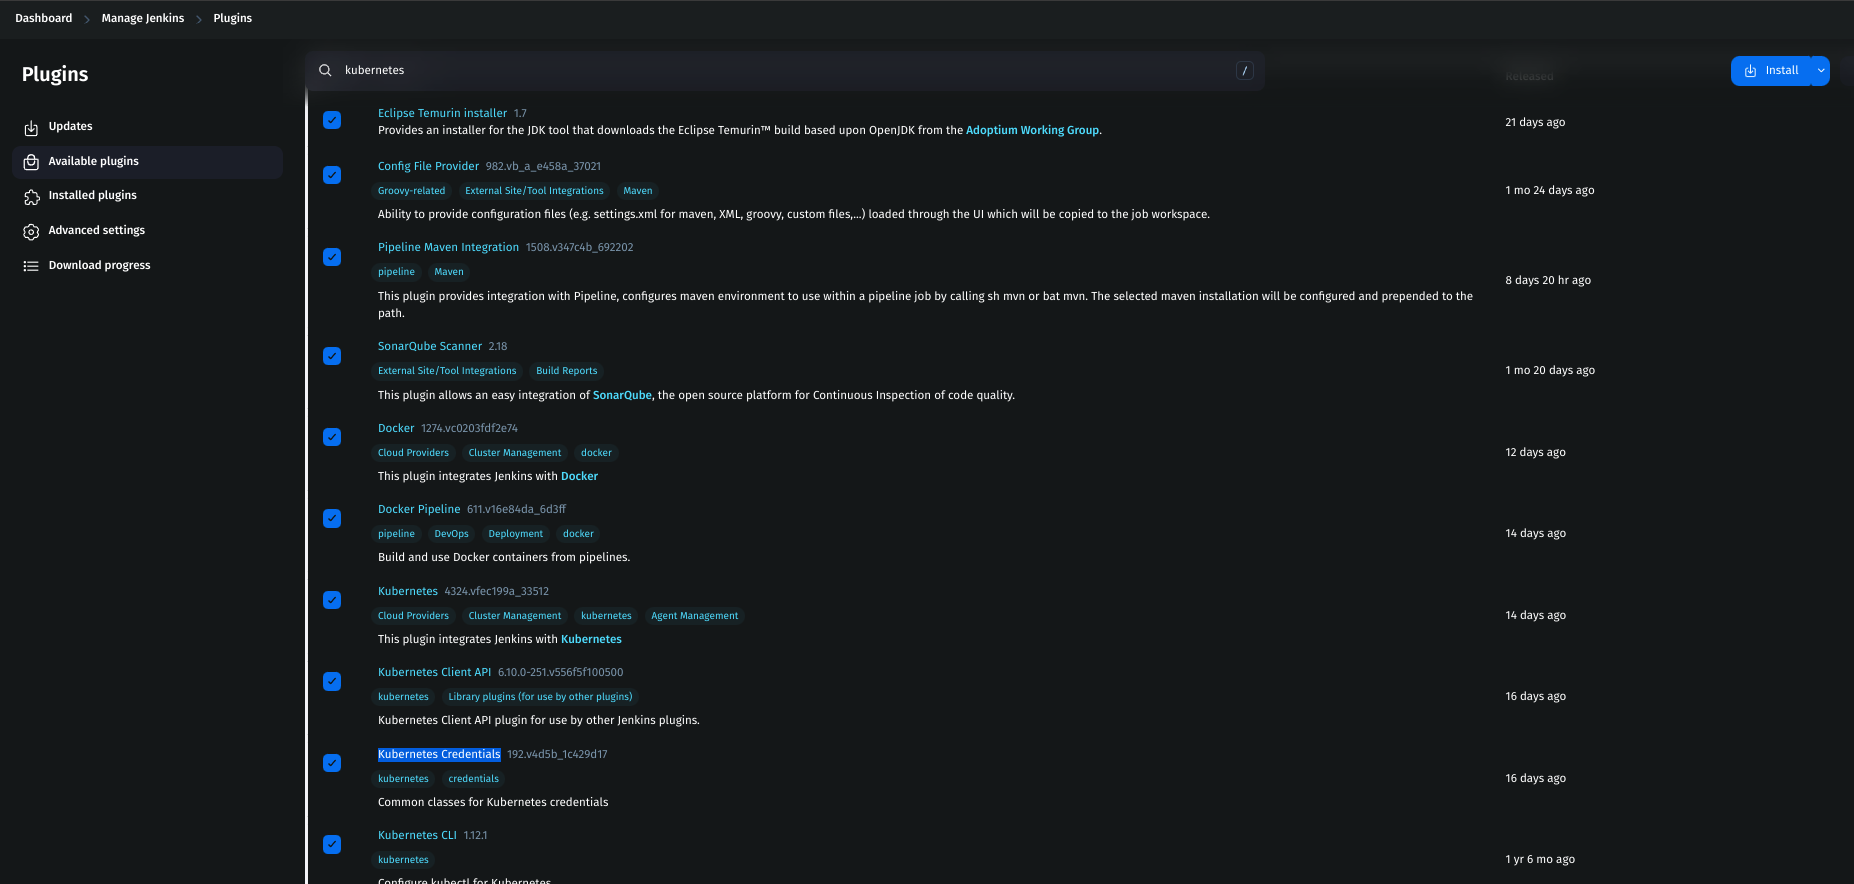
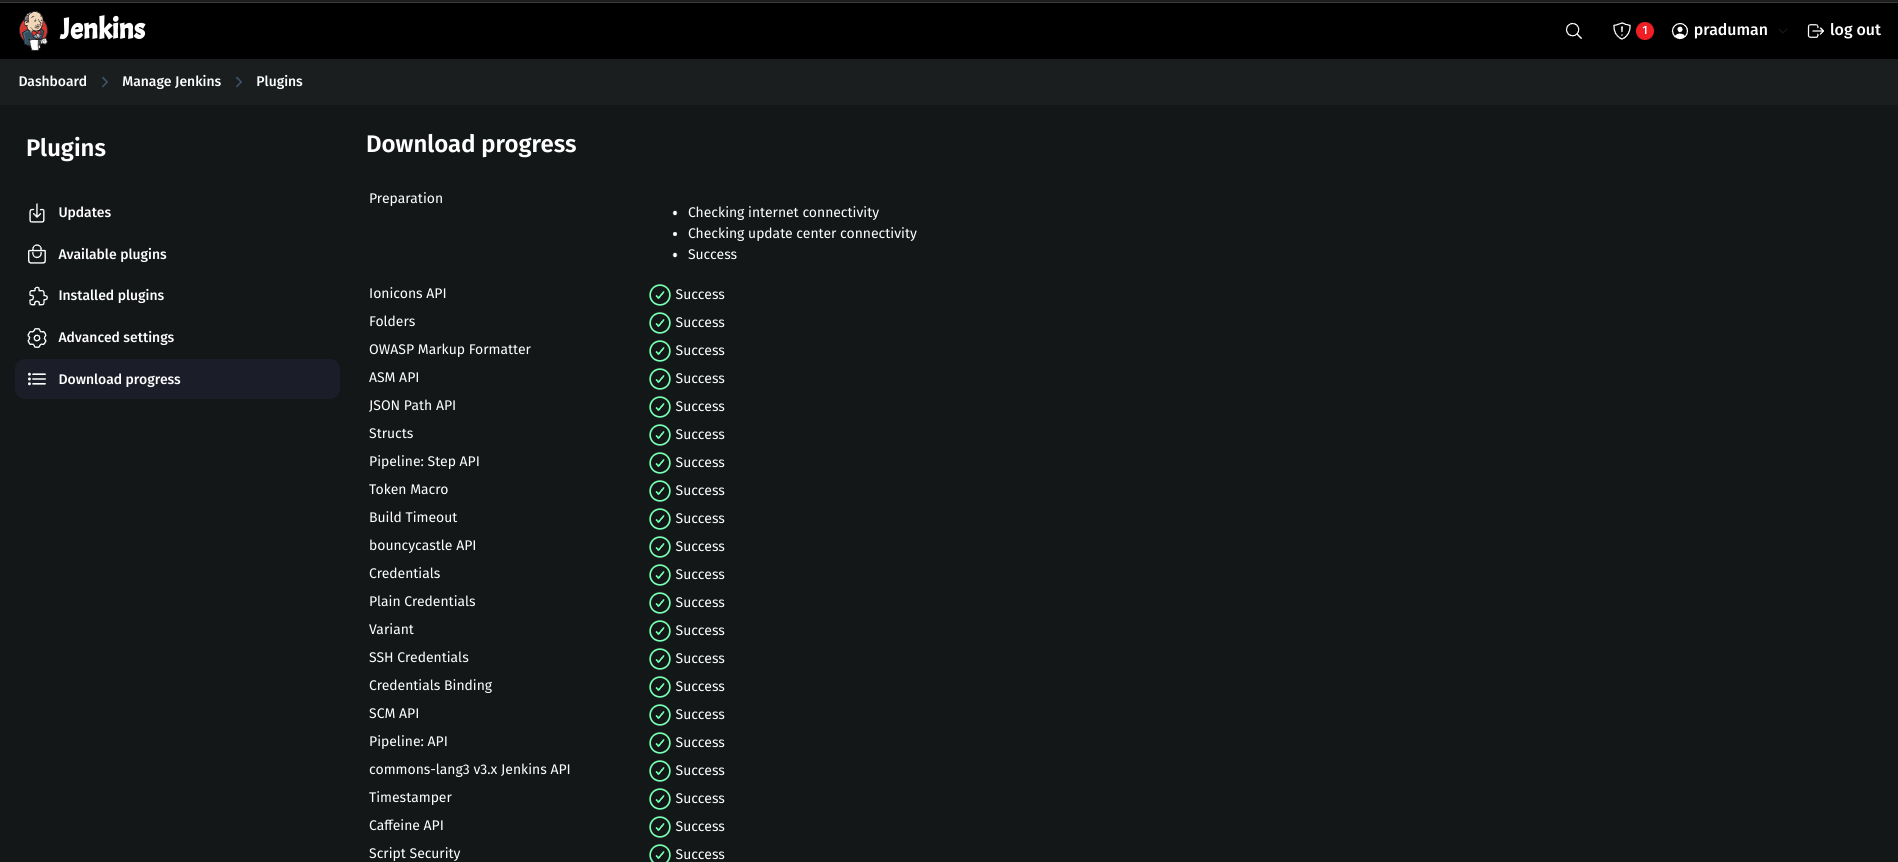
Click Install and wait for the installation to complete.
🎯 Final Verification
- Check Jenkins Service
sudo systemctl status jenkins
You should see "active (running)" status.
- Check Docker Installation
docker --version
It should display the installed Docker version.
- Check
kubectlInstallation
kubectl version --short --client
It should show the Kubernetes client version.
- Test Jenkins Web Access
Open:http://<Jenkins-server-public-IP>:8080
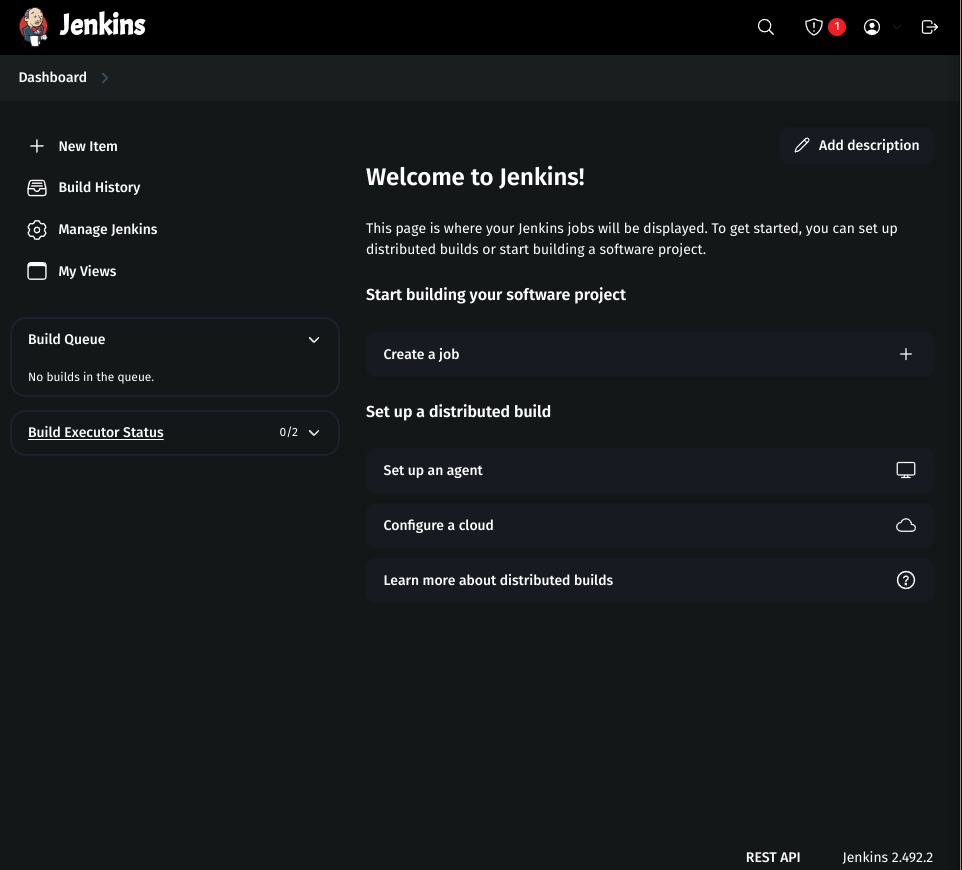
🎉 Jenkins is Now Fully Set Up on AWS! 🚀
Jenkins is installed & running
Docker is set up for containerized builds
kubectlis installed for Kubernetes integrationEssential plugins are installed
Start Creating CI/CD Pipelines! 🚀
Jenkins is now fully set up! You can start creating Jenkins Pipelines to automate builds, tests, and deployments for your applications.
Step 1: Configure Essential Tools in Jenkins
1. Install Required Plugins
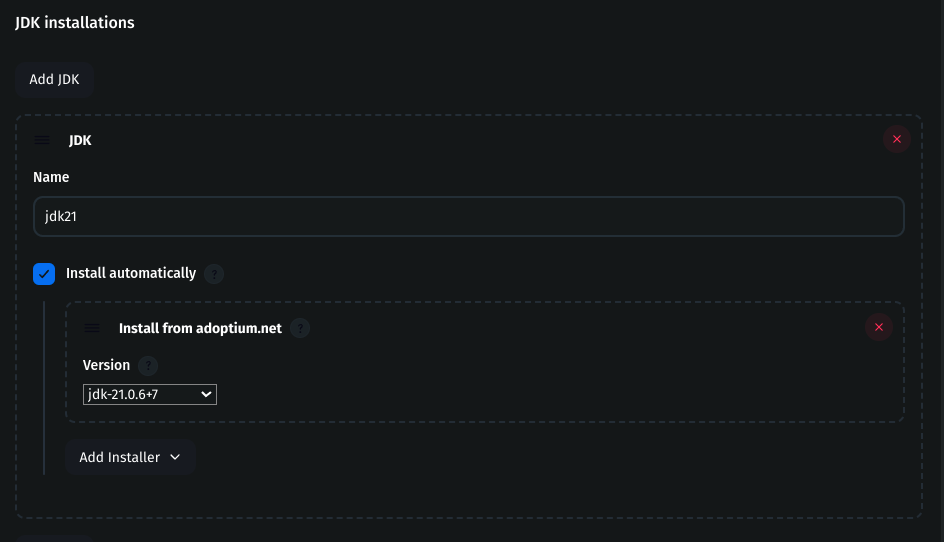
Install JDK
Navigate to Manage Jenkins → Tools
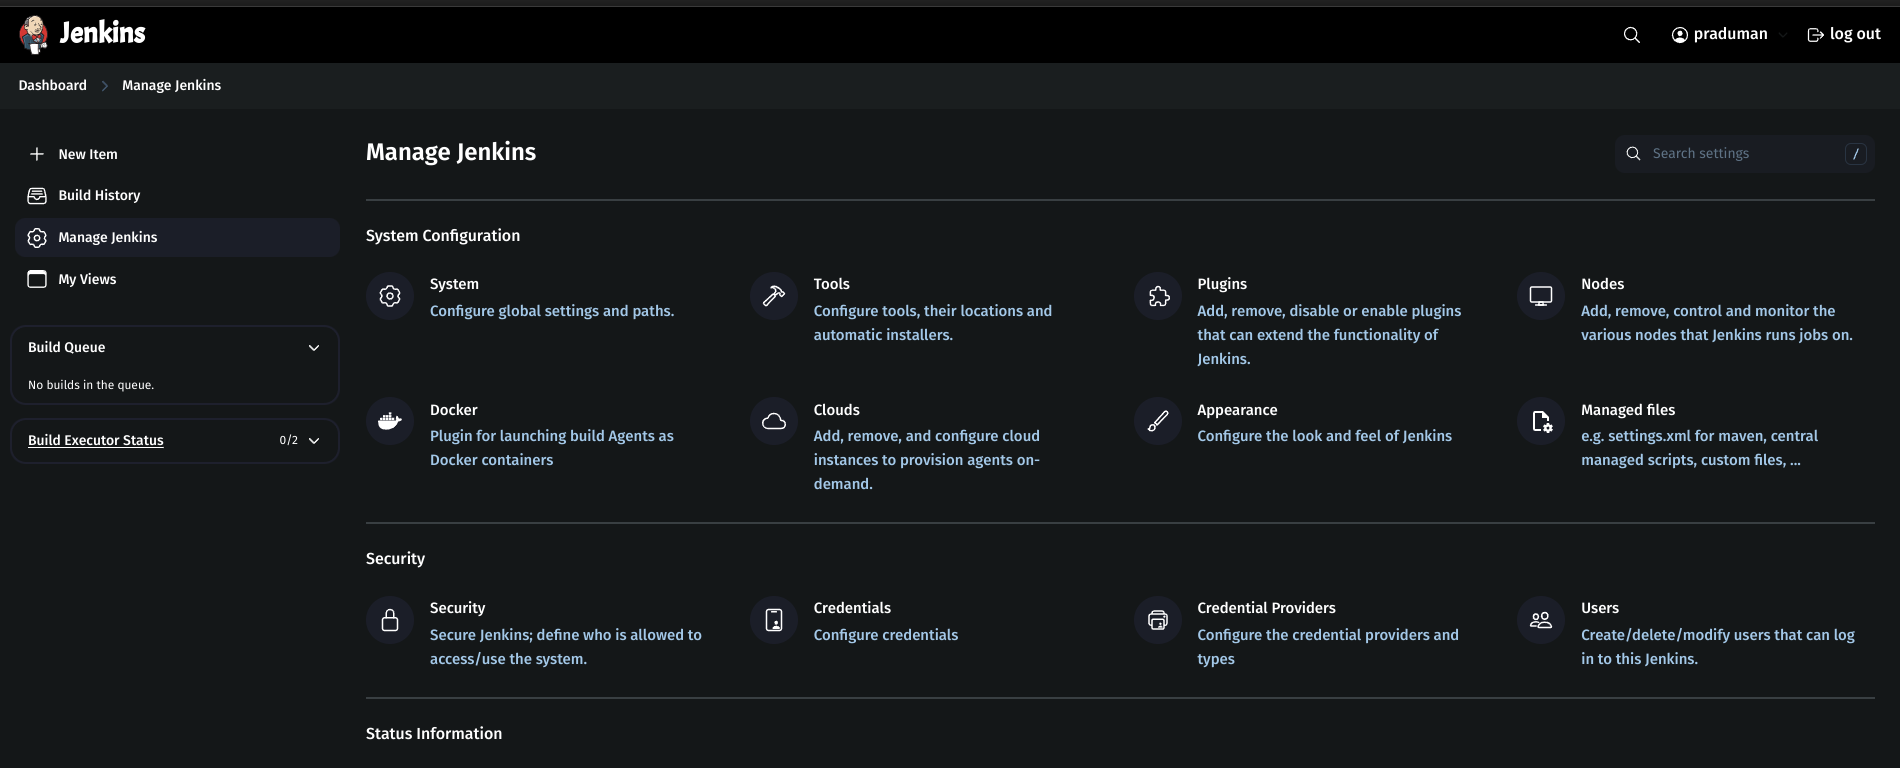
Under JDK, click Add JDK
Name:
jdk17Check Install automatically
Installer:
adoptium.netVersion:
jdk-17
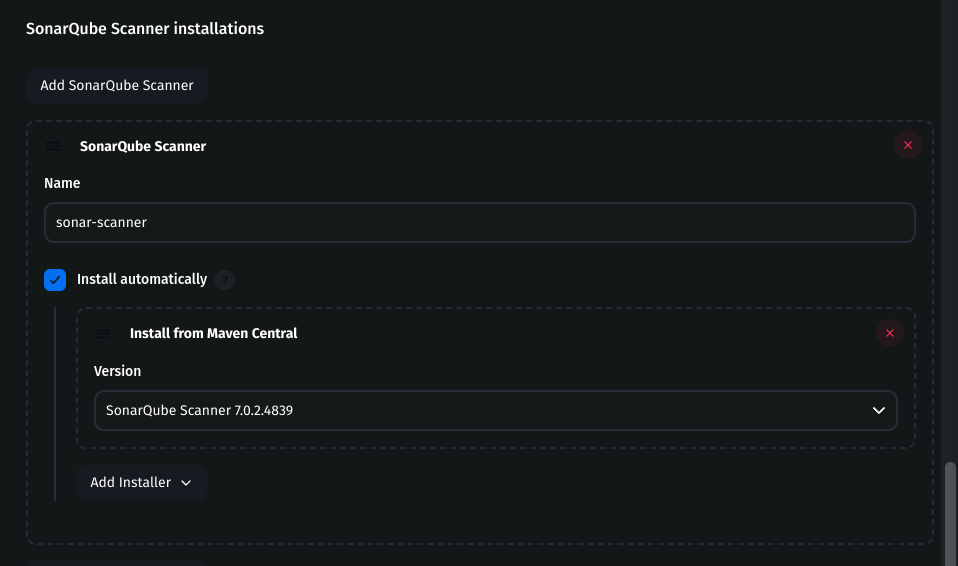
Install SonarQube Scanner
Under SonarQube Scanner, click Add SonarQube Scanner
Name:
sonar-scannerCheck Install automatically
Choose the latest version
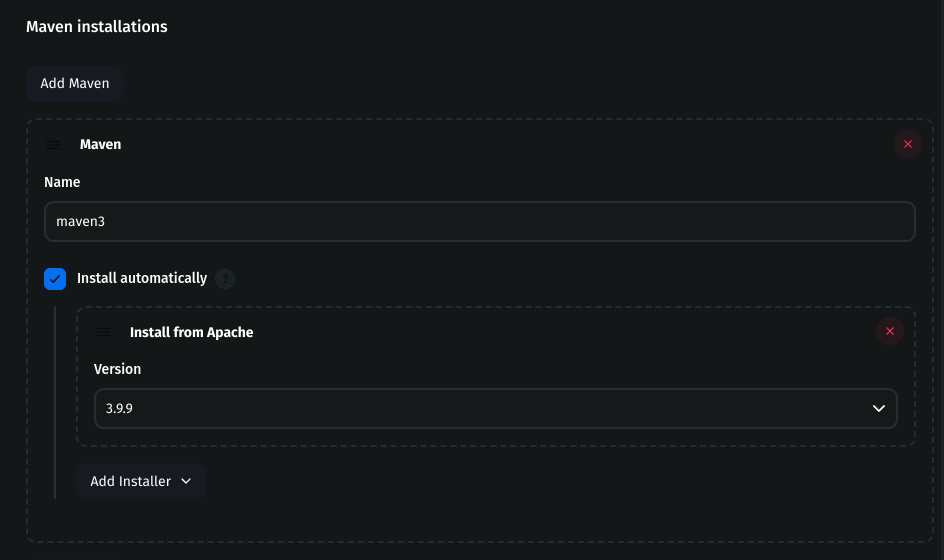
Install Maven
Under Maven, click Add Maven
Name:
maven3Check Install automatically
Choose the latest version
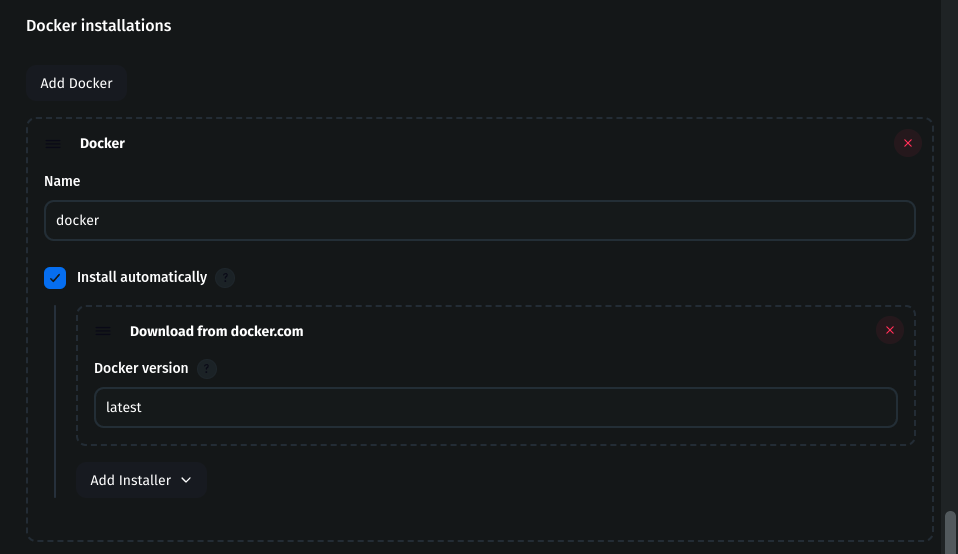
Install Docker
Under Docker, click Add Docker
Name:
dockerCheck Install automatically
Installer: Download from
docker.com
Once these tools are set up, you are ready to create a pipeline.
Step 2: Create a Jenkins Pipeline
A Jenkins pipeline automates the software development lifecycle, including building, testing, and deploying applications.
1. Access Jenkins Dashboard
Log in to Jenkins using your browser.
On the Jenkins Dashboard, click New Item to create a new job.
2. Define Pipeline Details
Enter an Item Name (Example:
BoardGame).Select Item Type → Choose Pipeline.
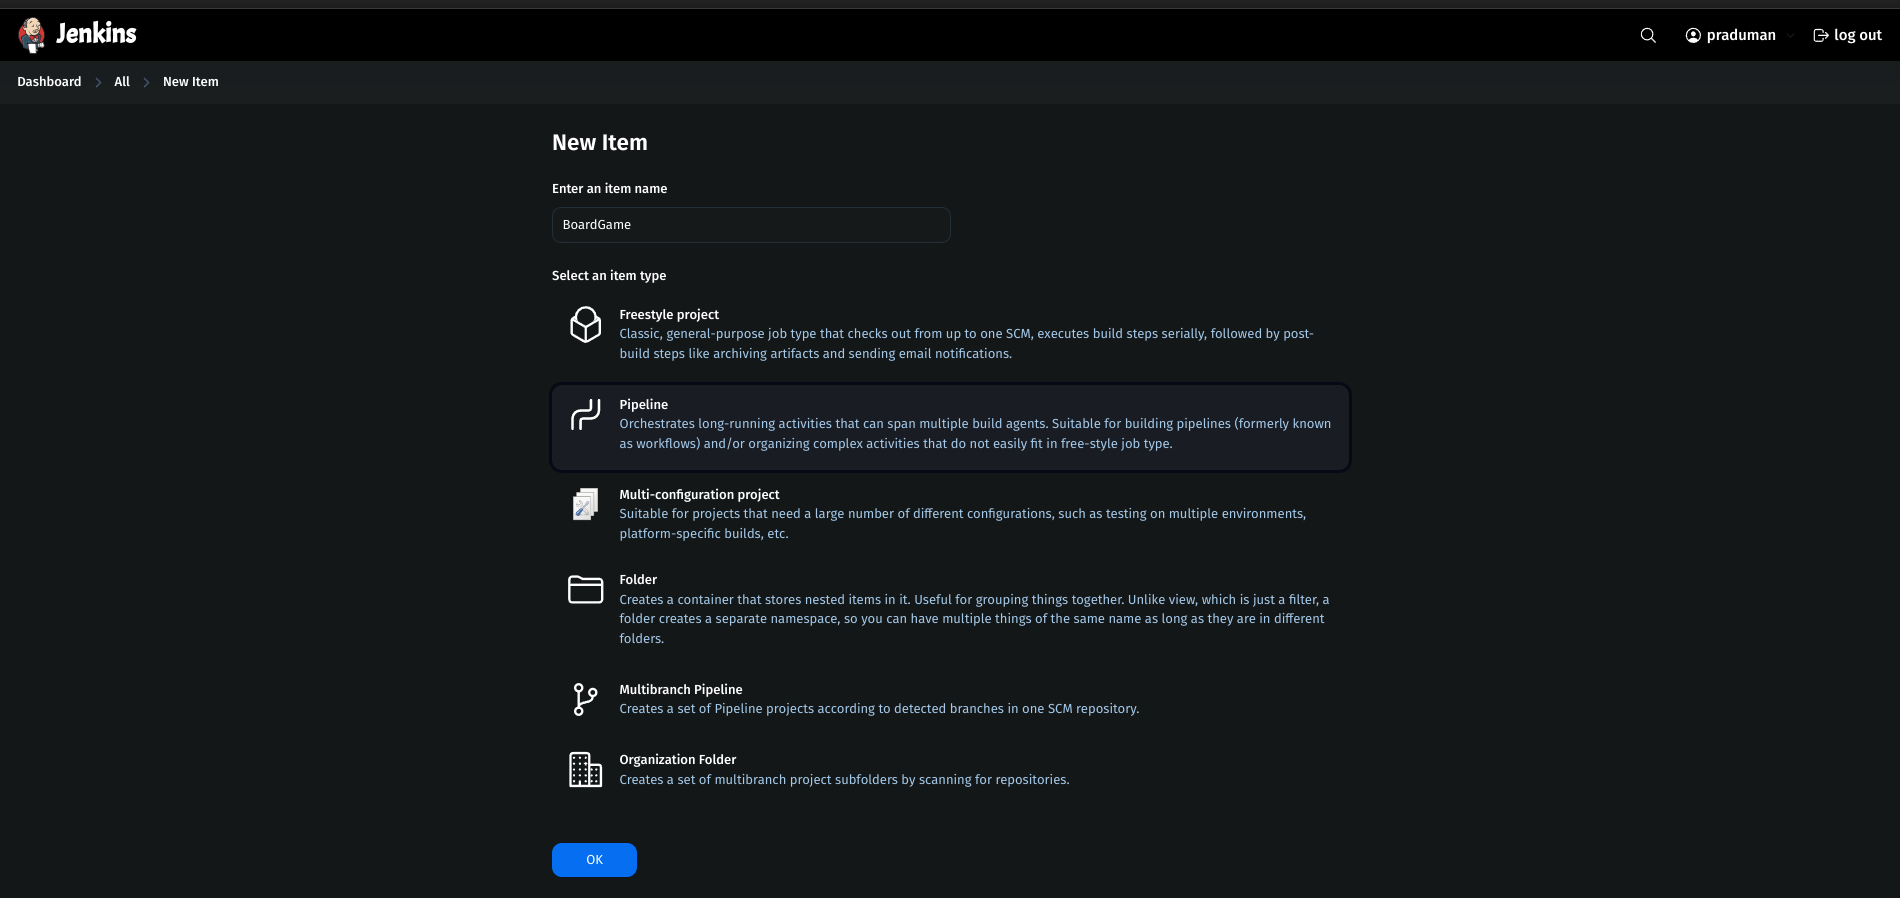
Click OK to proceed.
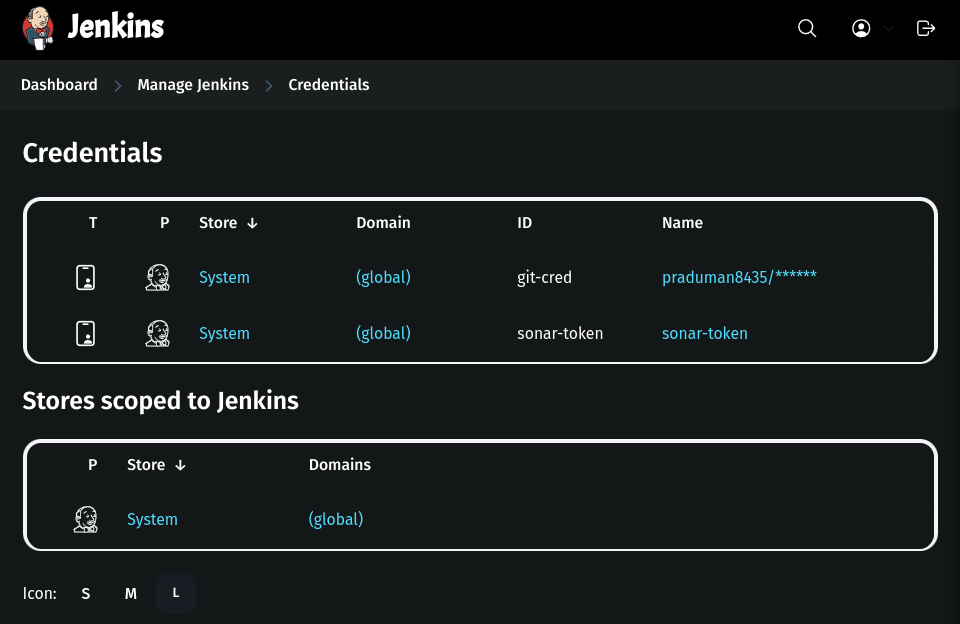
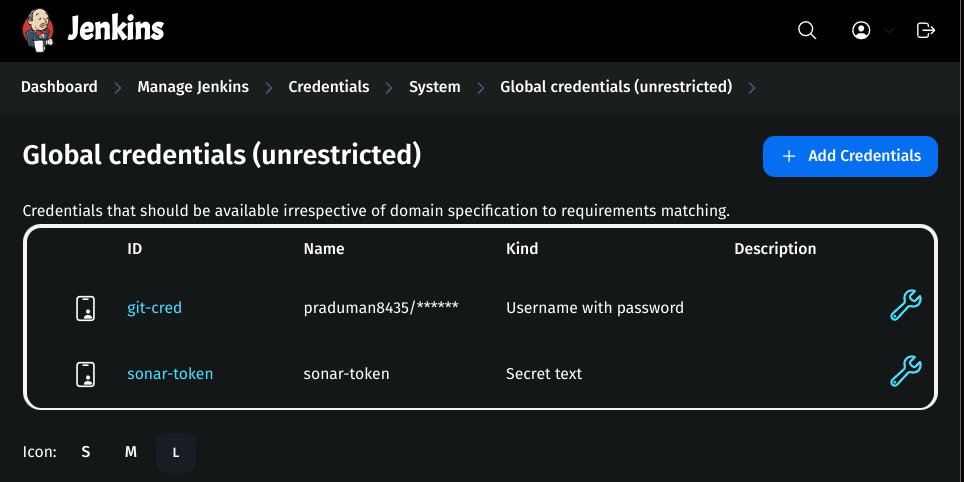
3. Add GitHub Token in Jenkins Credentials
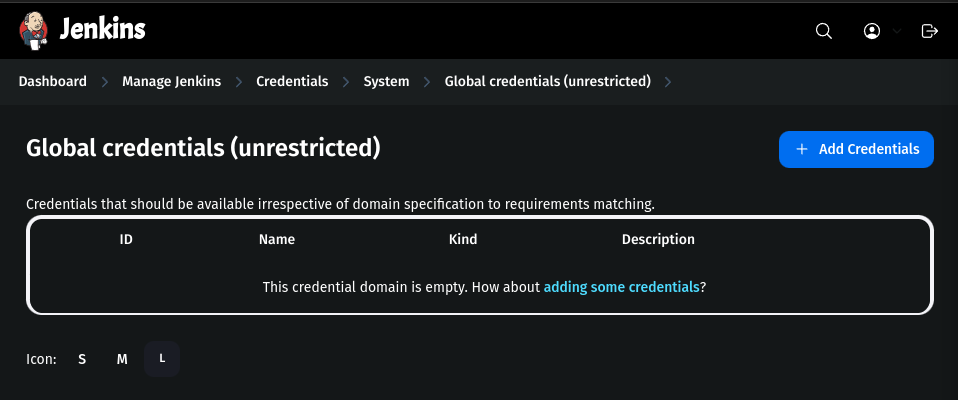
Go to Jenkins Dashboard → Manage Jenkins → Credentials.
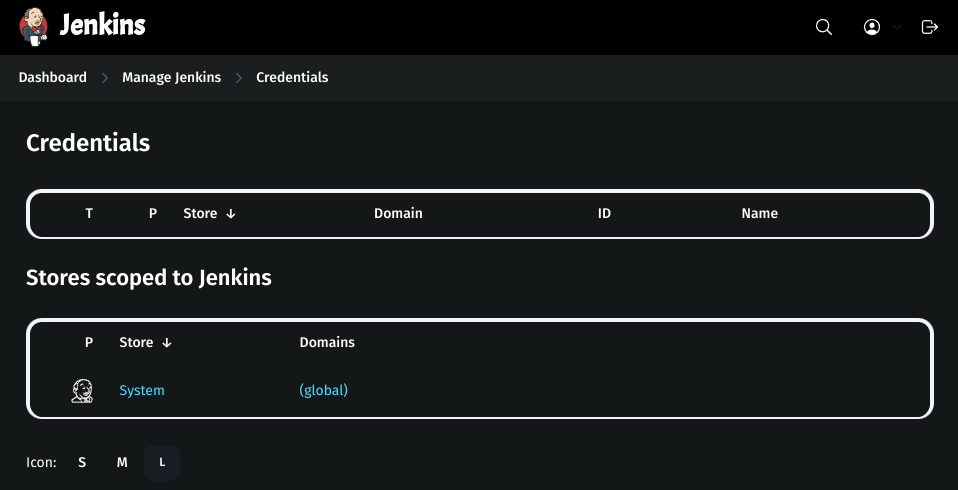
Click on global → Add Credentials.
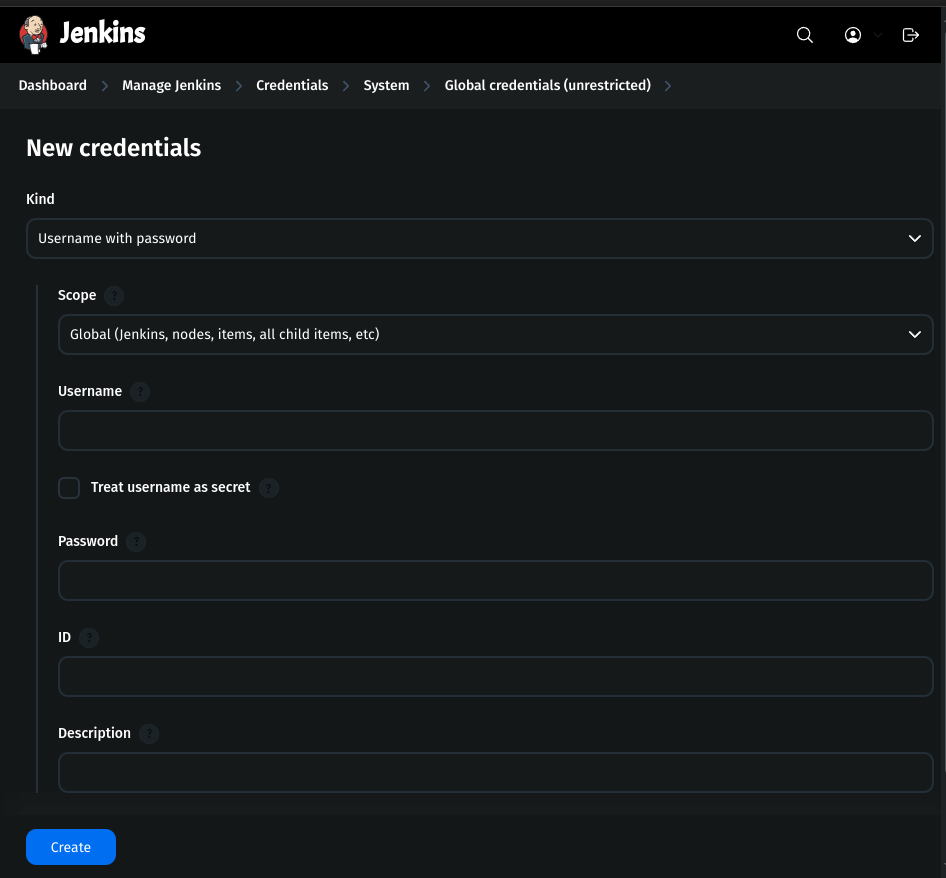
Fill the details:
Kind:
Username & PasswordScope:
GlobalUsername:
GitHub usernamePassword:
Personal Access Token from GitHubID:
git-cred
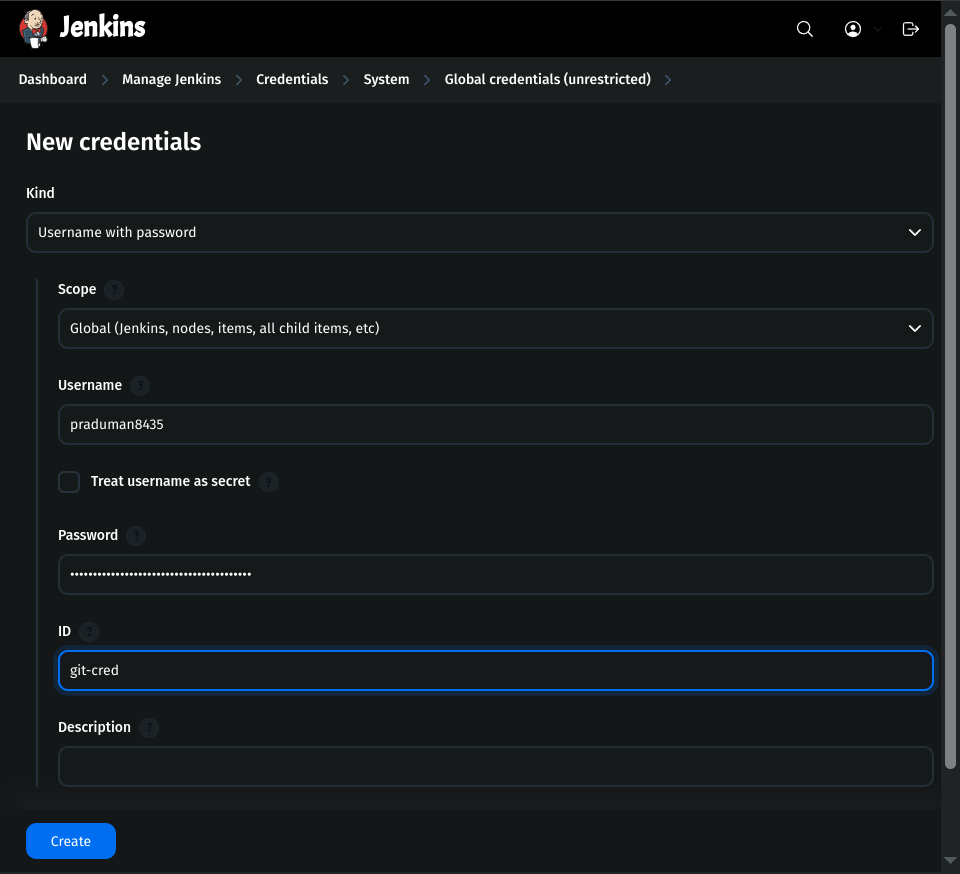
- Click Create.
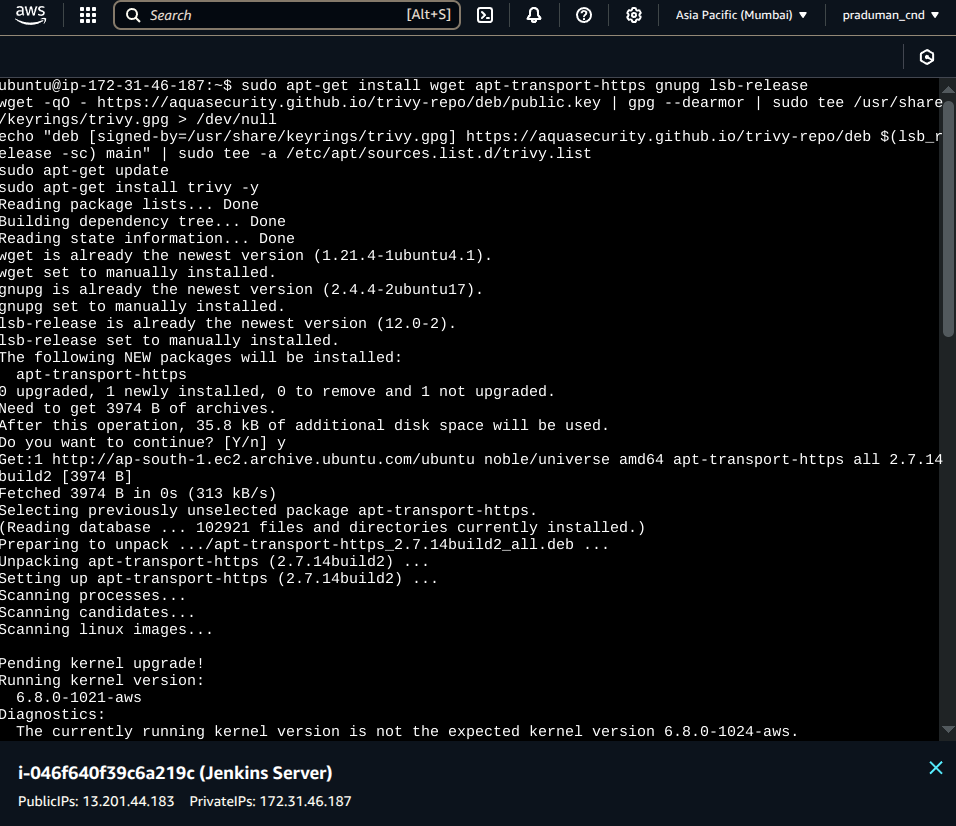
4. Install Trivy on the Jenkins Instance
sudo apt-get install wget apt-transport-https gnupg lsb-release
wget -qO - https://aquasecurity.github.io/trivy-repo/deb/public.key | gpg --dearmor | sudo tee /usr/share/keyrings/trivy.gpg > /dev/null
echo "deb [signed-by=/usr/share/keyrings/trivy.gpg] https://aquasecurity.github.io/trivy-repo/deb $(lsb_release -sc) main" | sudo tee -a /etc/apt/sources.list.d/trivy.list
sudo apt-get update
sudo apt-get install trivy -y
5. Add SonarQube Credentials in Jenkins
Go to SonarQube Server → Administration → Security → Users.
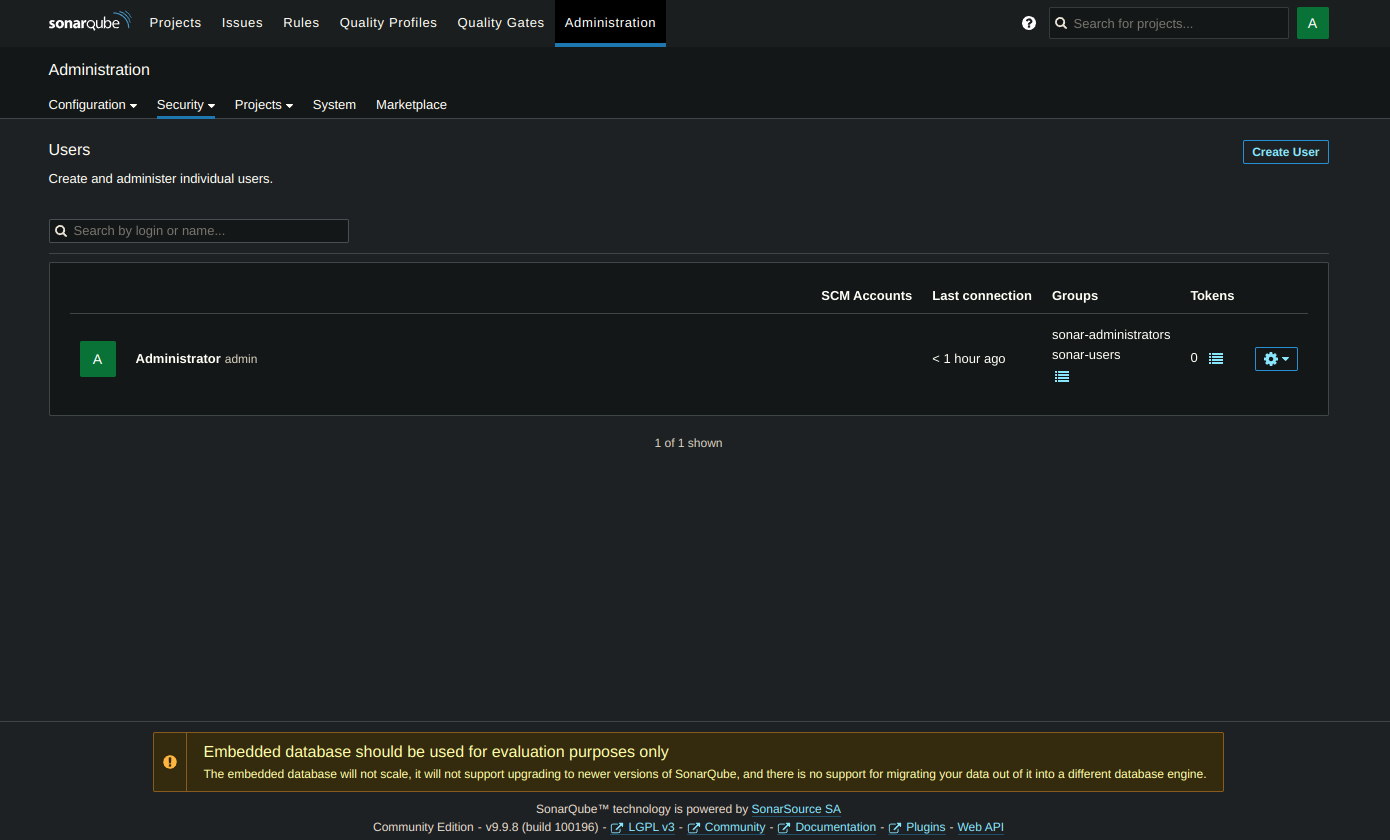
Update the token.
Set a name and expiry date of the token and click on generate.
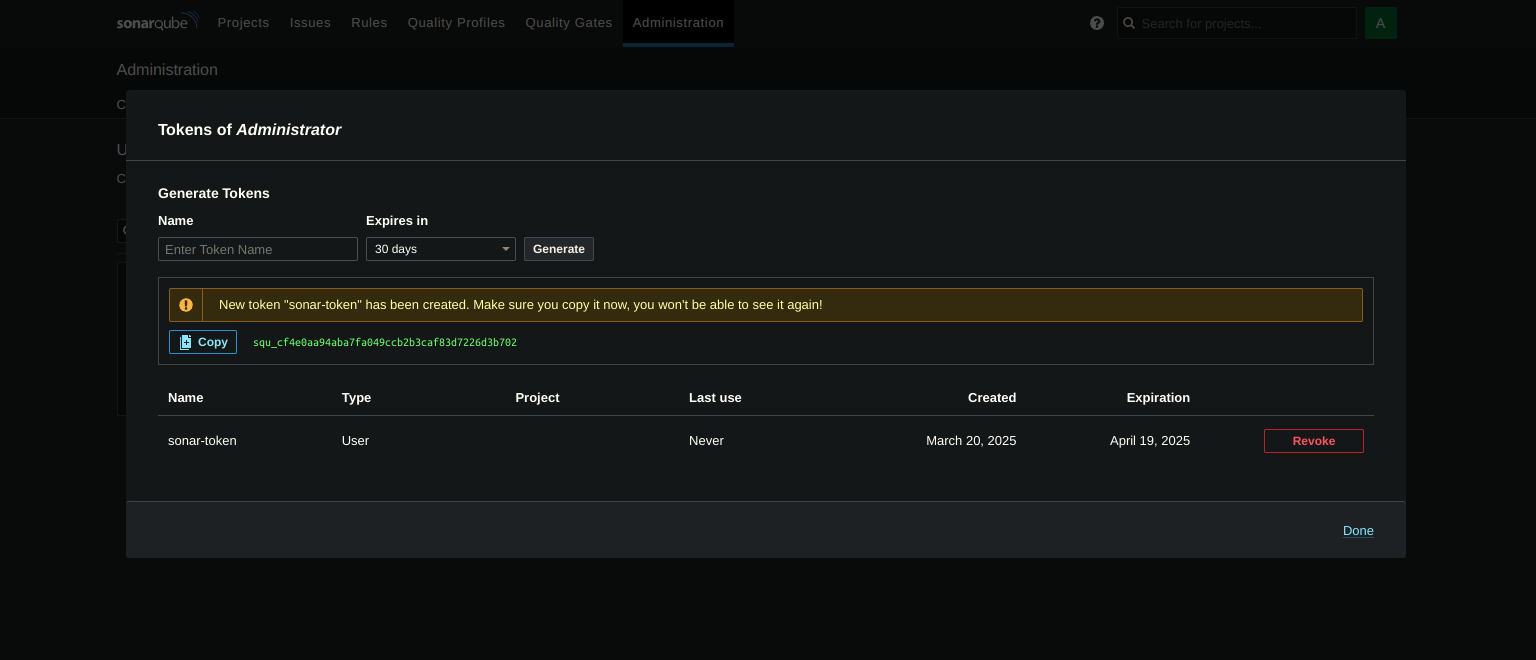
Go to Jenkins Dashboard → Manage Jenkins → Credentials.
Click global → Add new Credential.
Kind:
Secret textScope:
GlobalSecret:
<token-generated>ID:
sonar-token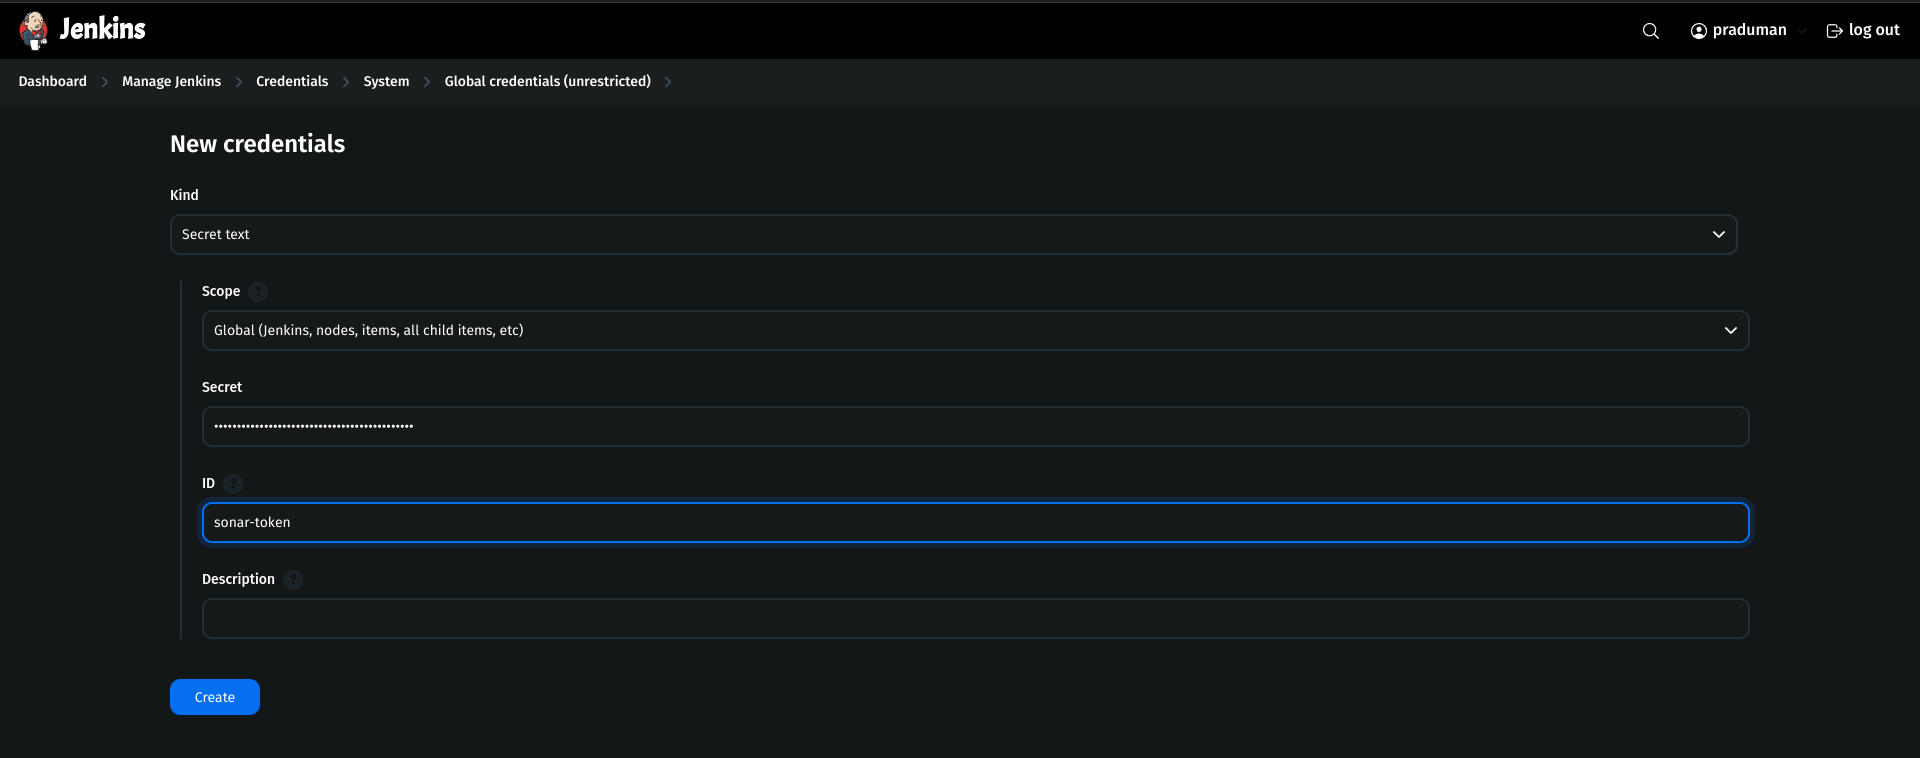
Click Create.
6. Set Up SonarQube Server in Jenkins
Go to Jenkins Dashboard → Manage Jenkins → System.
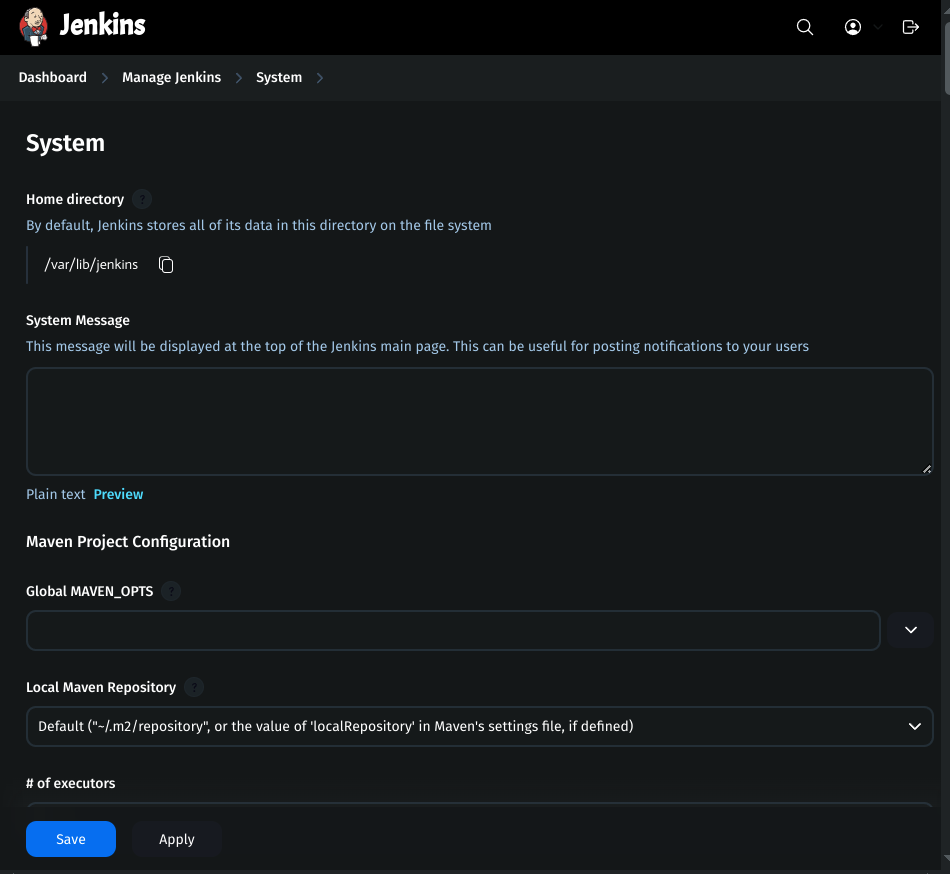
Click Add SonarQube:
Name:
sonarServer URL:
<SonarQube-public-IP>:9000Authentication Token:
sonar-token
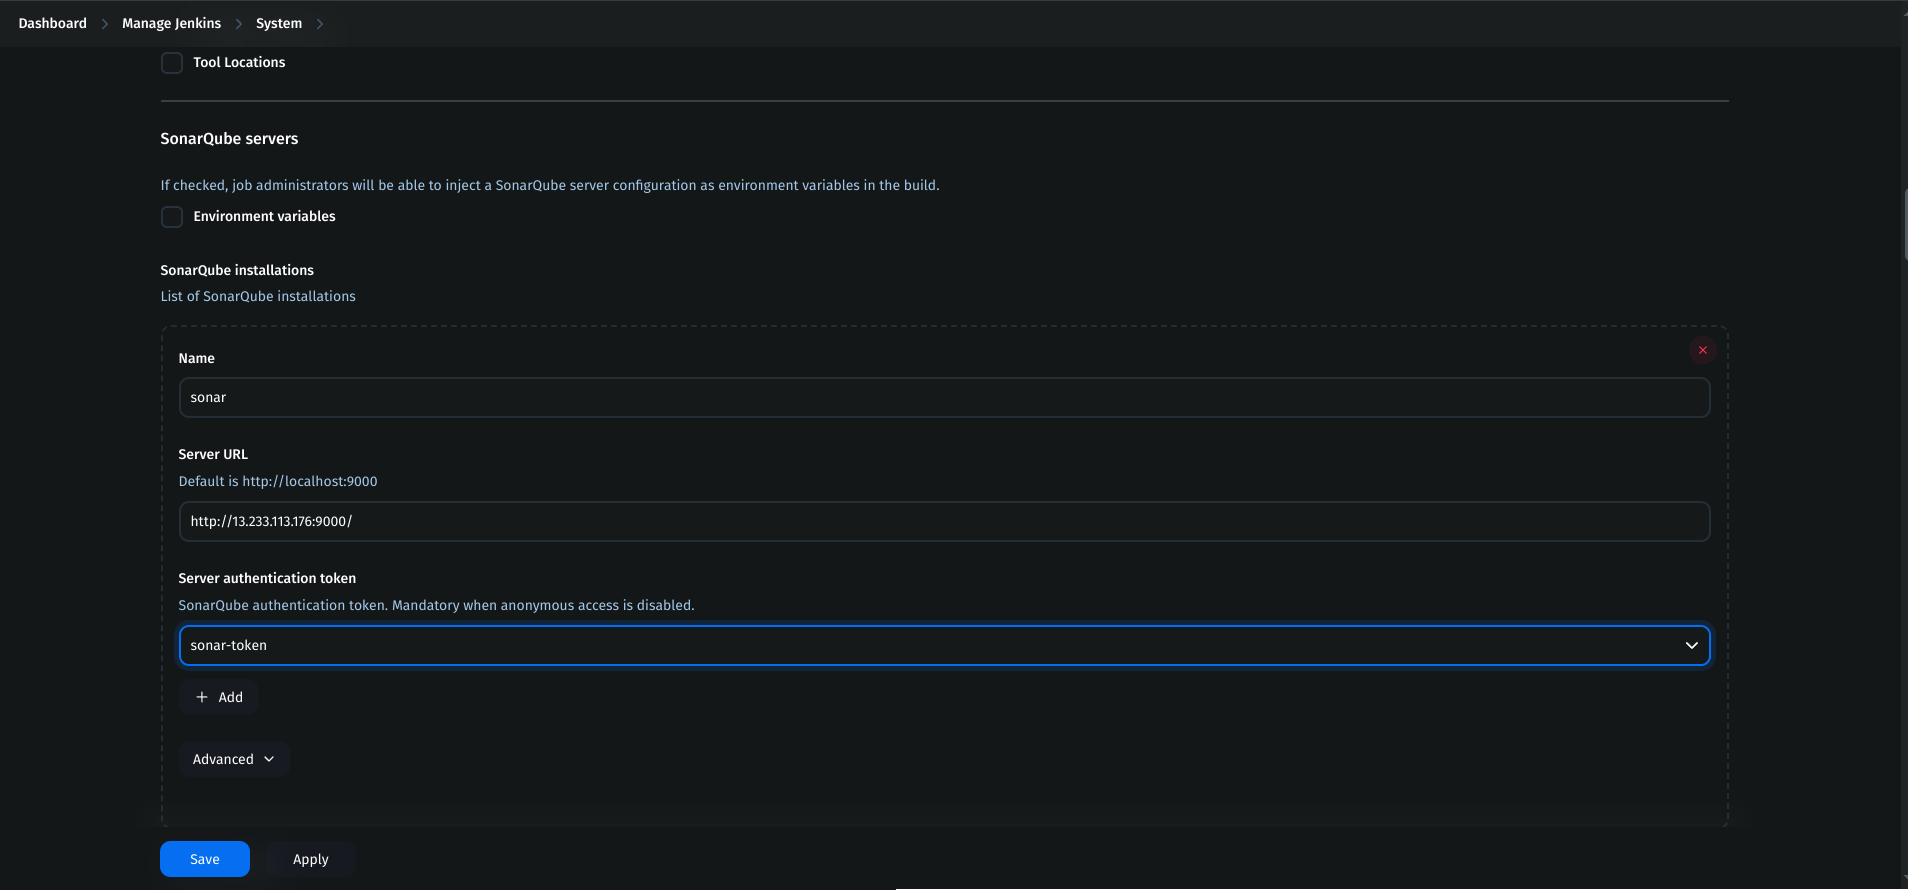
- Apply and Save.
7. Configure SonarQube Webhook
Go to SonarQube Server → Administration → Configuration → Webhook.
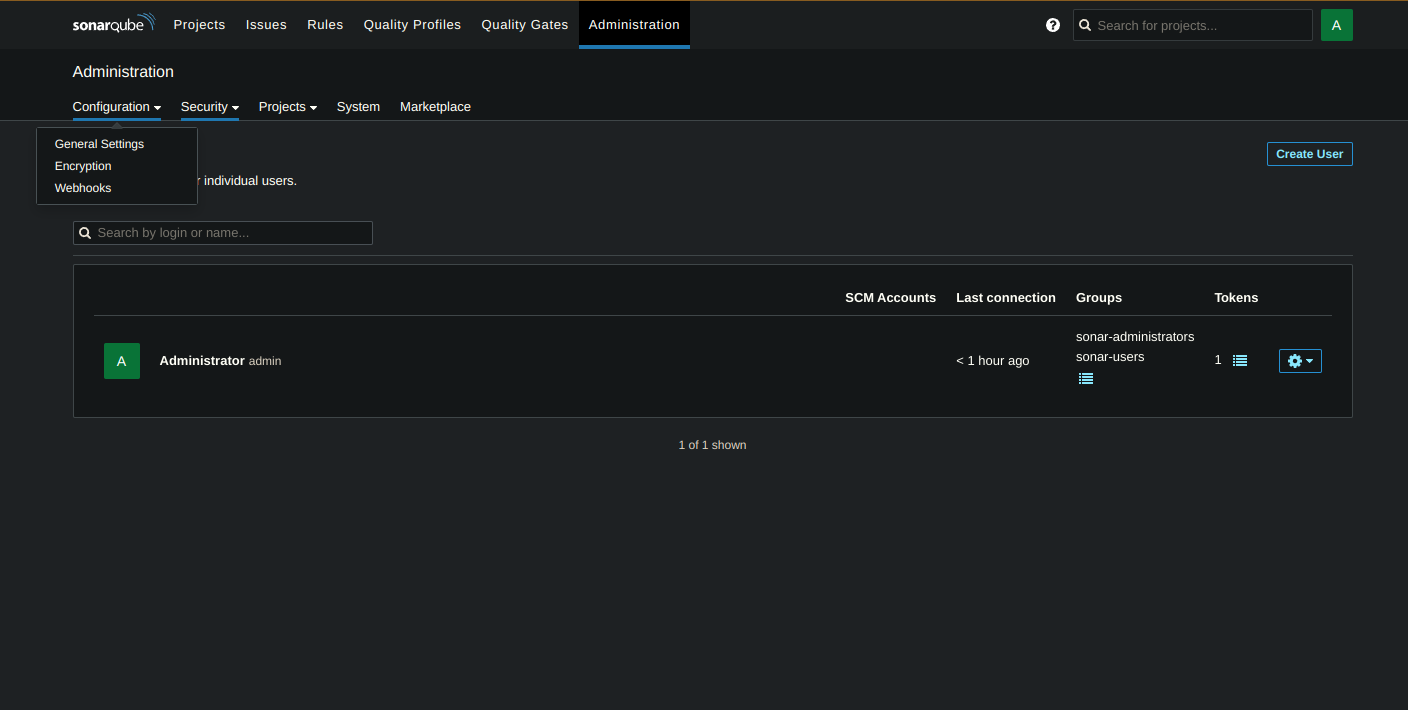
Create a new webhook:
URL:
<Jenkins-public-IP>:8080/sonarqube-webhook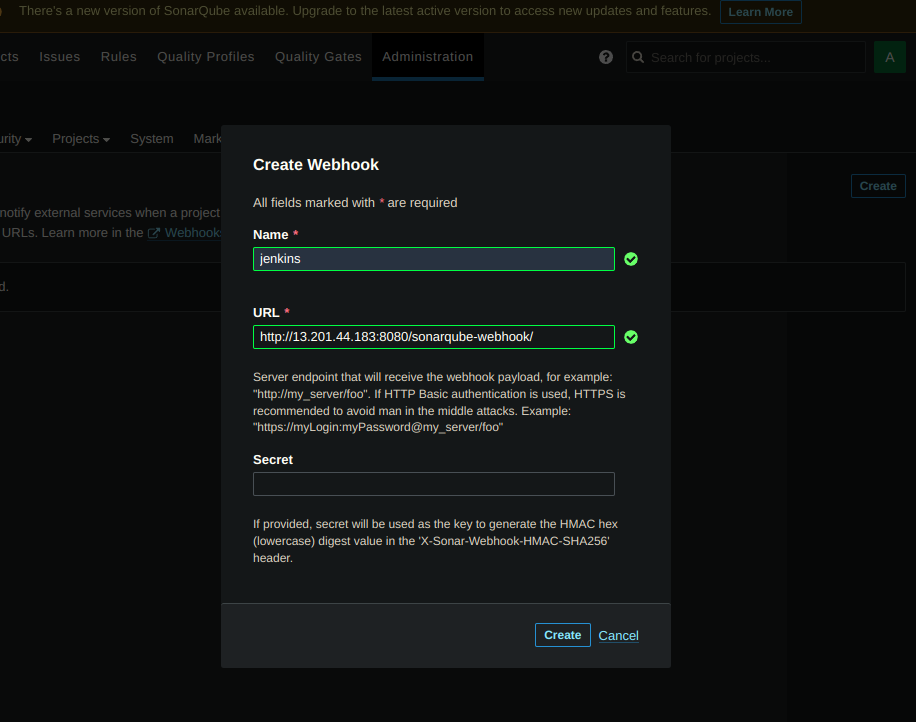
Click Create.
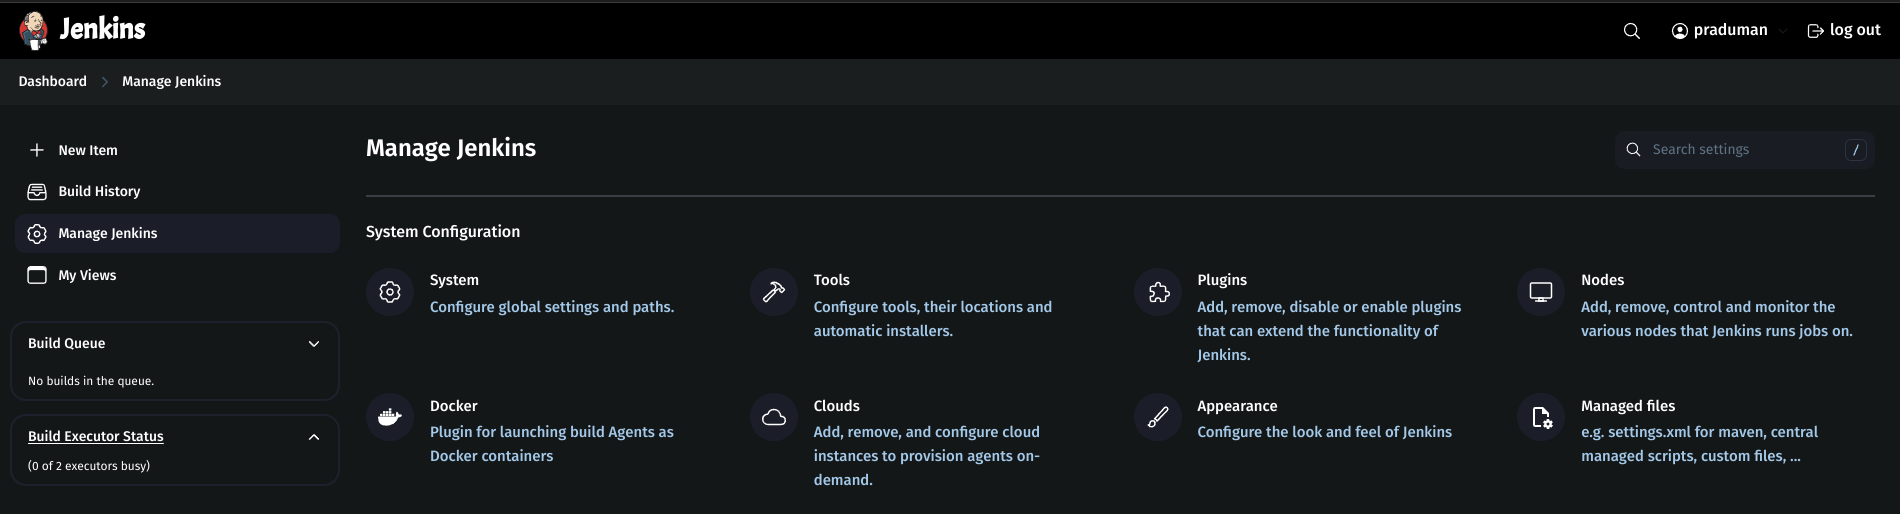
8. Add Nexus Repository Credentials
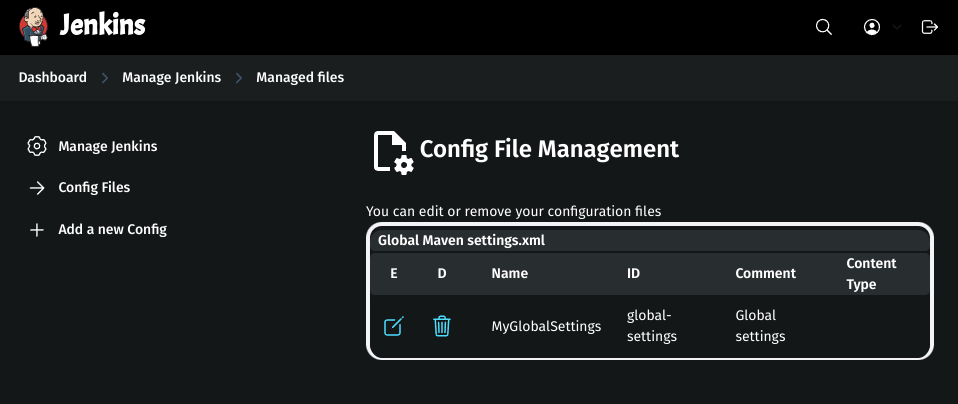
Go to Jenkins Dashboard → Manage Jenkins → Managed files.
Add a new config: Global Maven settings.xml.
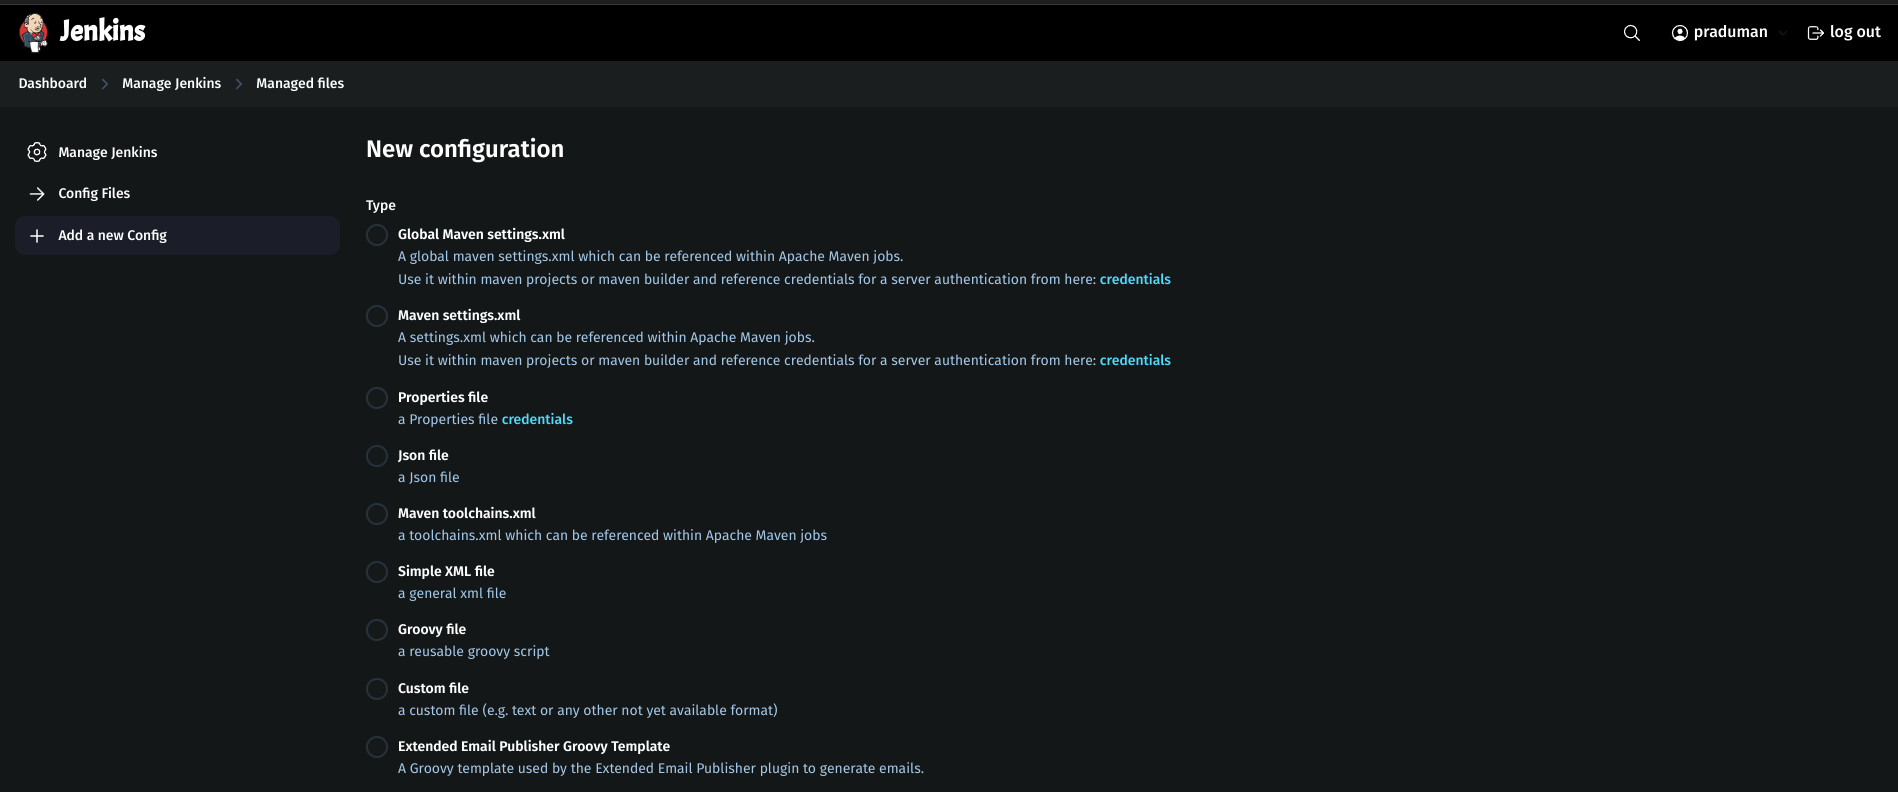
ID:
global-settings.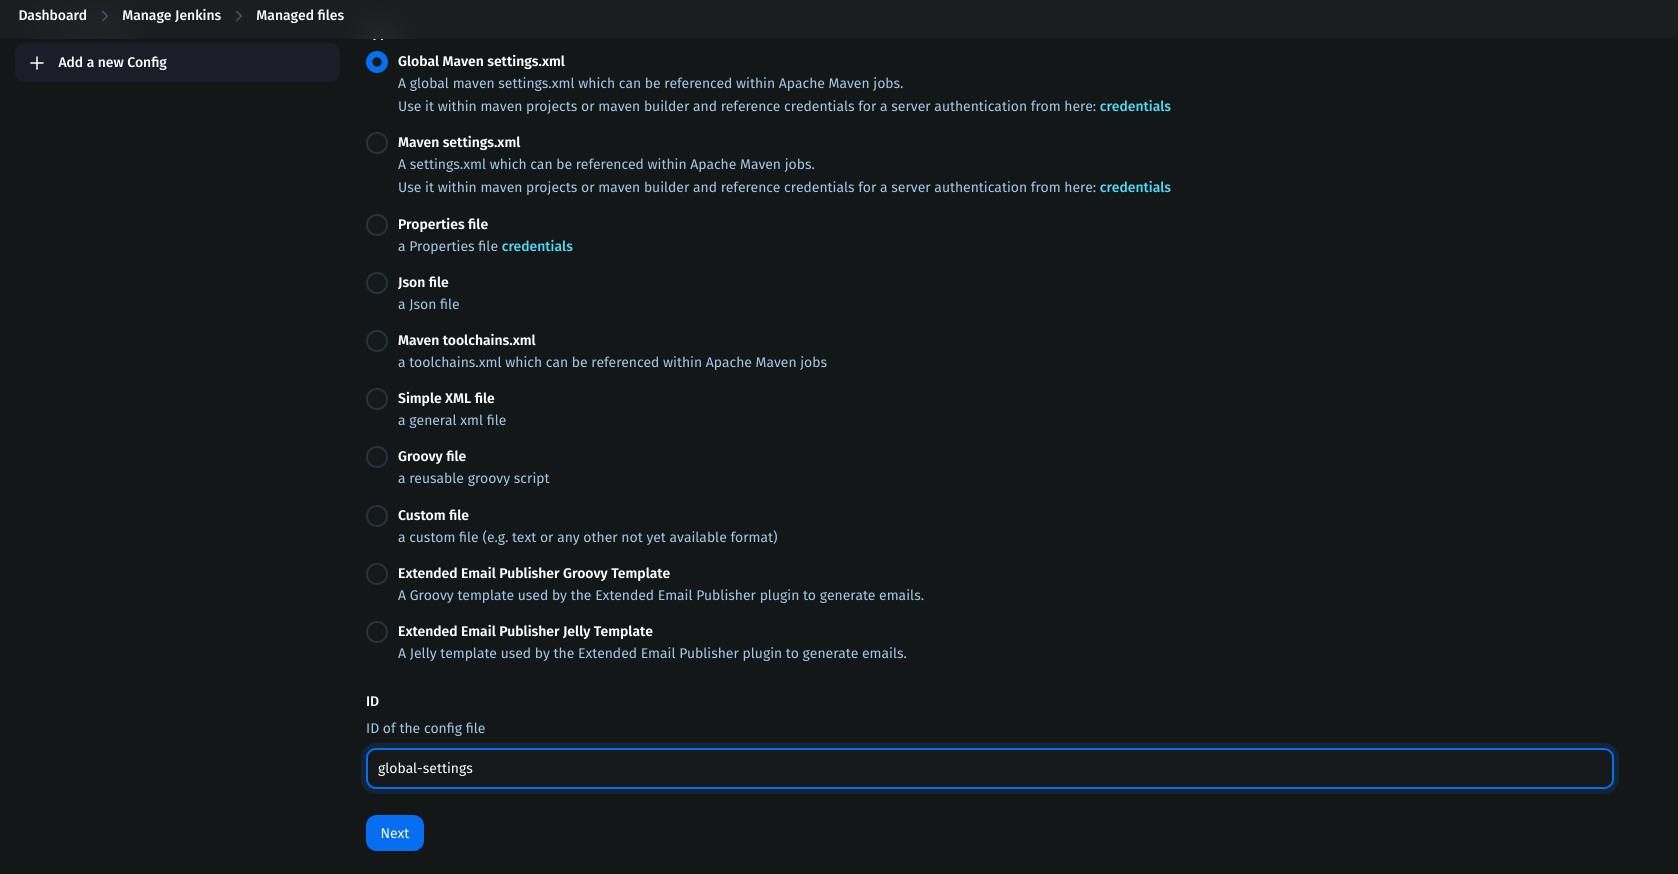
In the content section, update
<servers></servers>:<server> <id>maven-releases</id> <username>nexus-username</username> <password>nexus-password</password> </server> <server> <id>maven-snapshots</id> <username>nexus-username</username> <password>nexus-password</password> </server>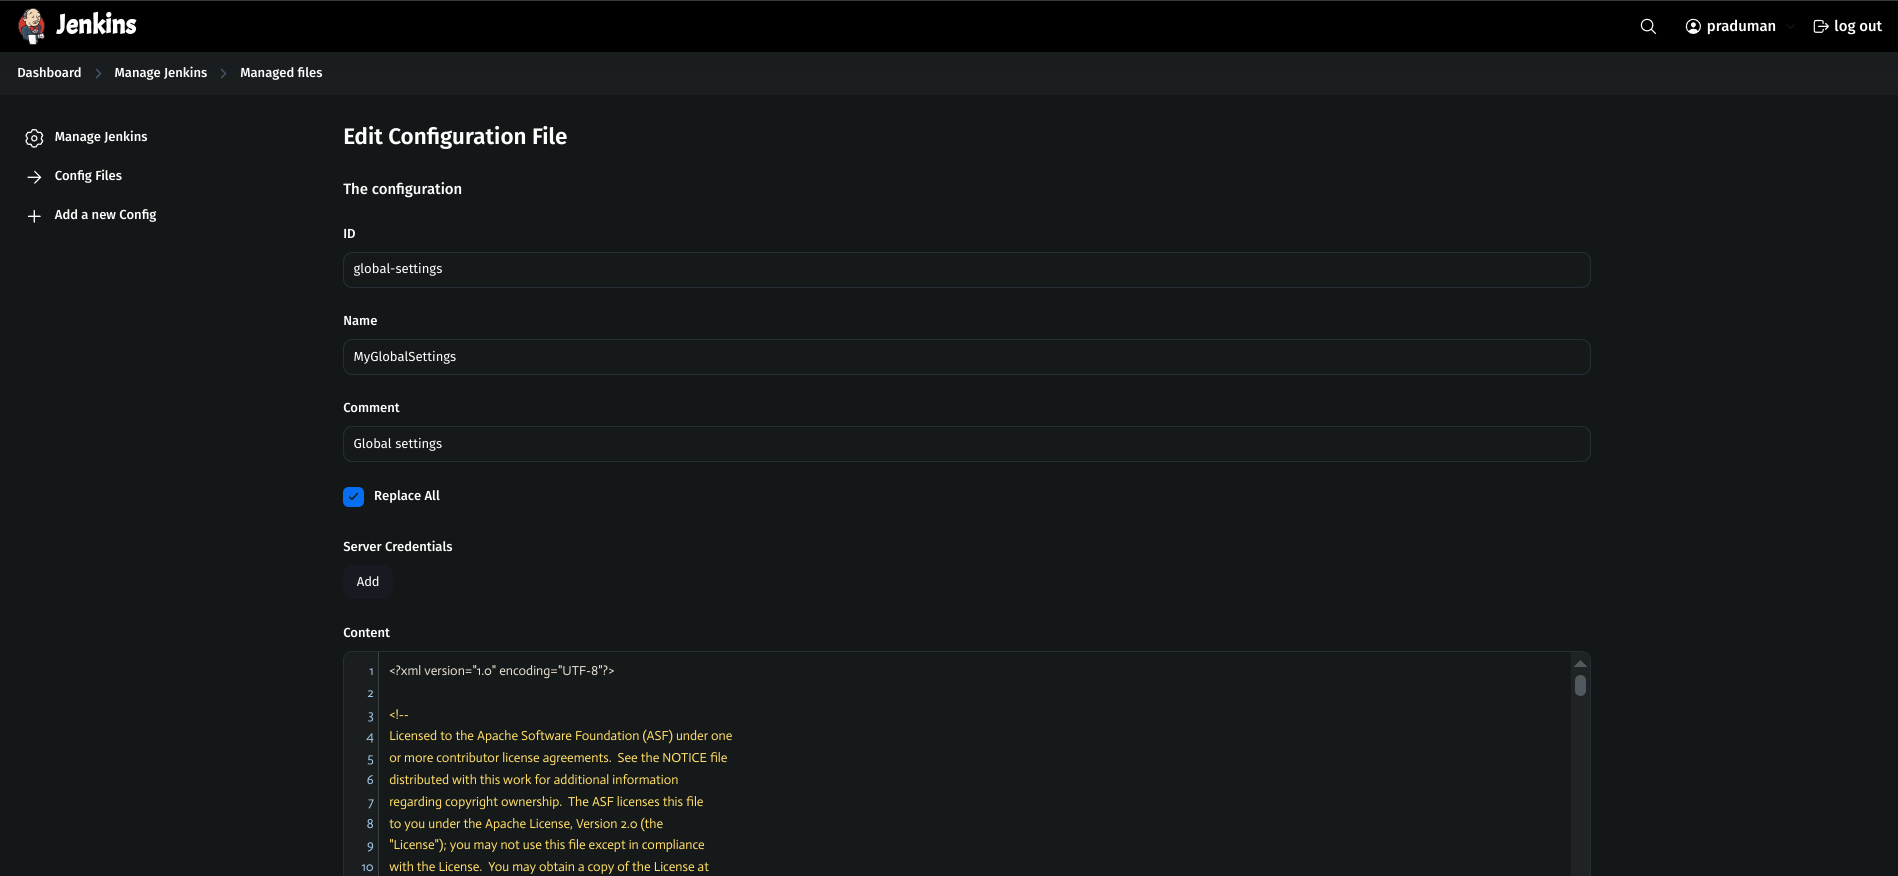
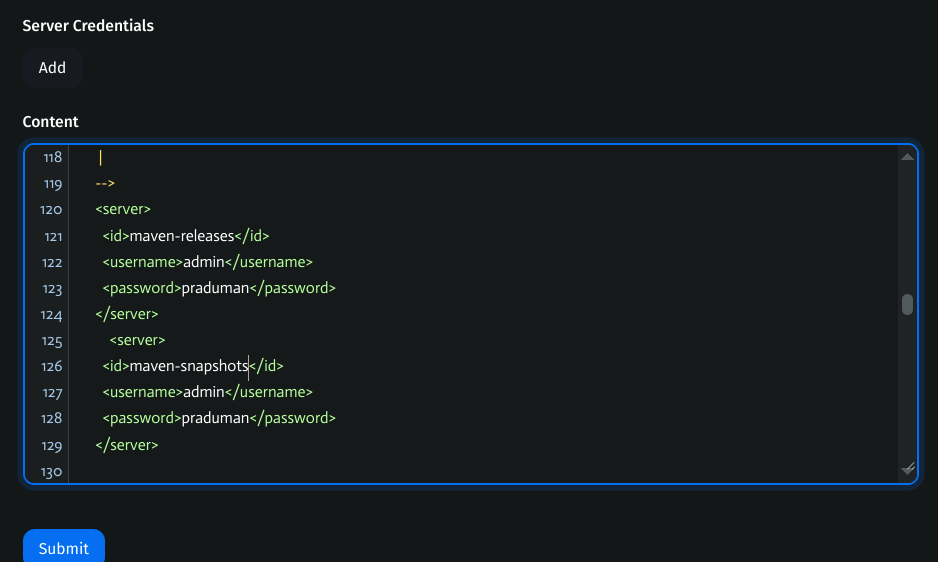
Click Submit.
9. Add DockerHub Credentials
Go to Jenkins Dashboard → Manage Jenkins → Credentials.
Click global → Add Credential.
Kind:
Username with PasswordScope:
GlobalUsername:
DockerHub-usernamePassword:
DockerHub-passwordID:
docker-cred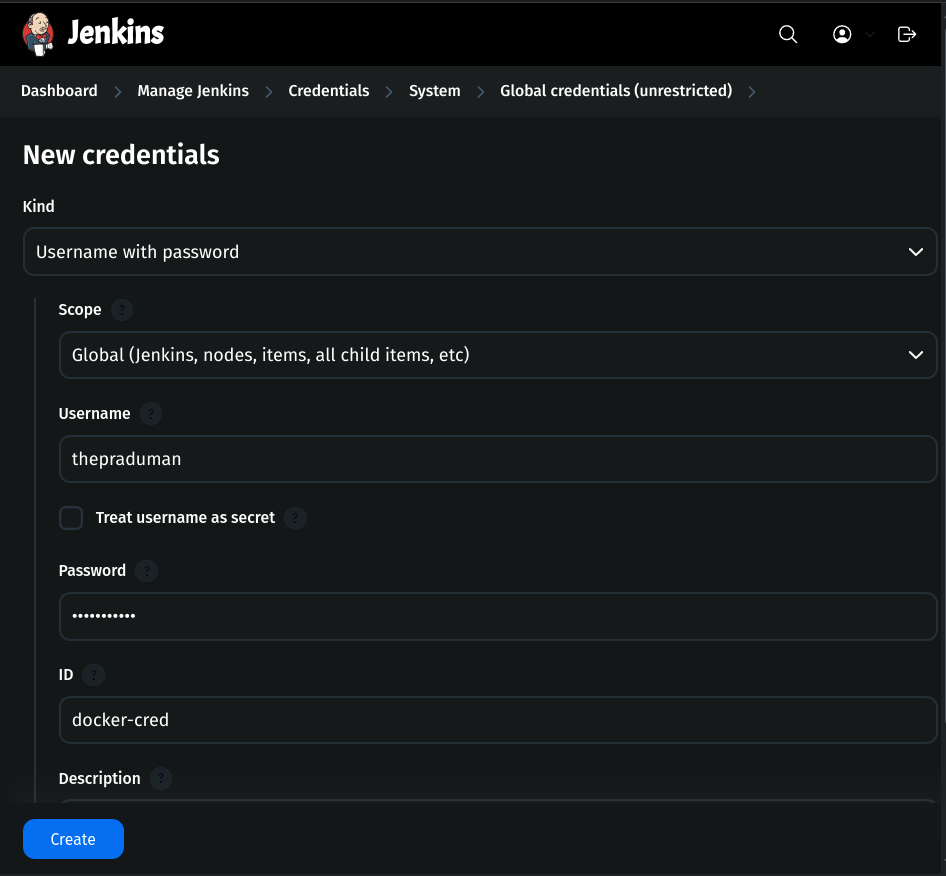
Click Create.
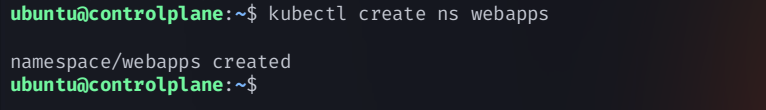
10. Create a Kubernetes Service Account
Create Namespace
kubectl create ns webapps
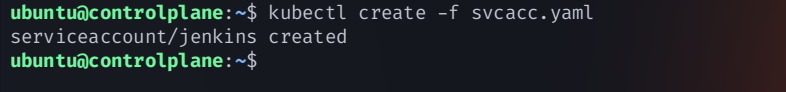
Create Service Account
apiVersion: v1
kind: ServiceAccount
metadata:
   name: jenkins
   namespace: webapps
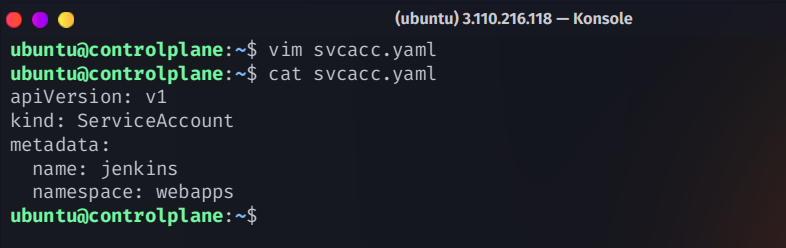
kubectl apply -f svcacc.yaml
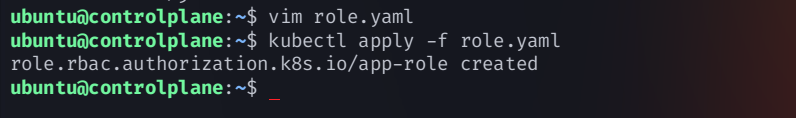
11. Create a Role using in kubernetes cluster
create a
role.yamlconfiguration fileapiVersion: rbac.authorization.k8s.io/v1 kind: Role metadata: name: app-role namespace: webapps rules: - apiGroups: - "" - apps - autoscaling - batch - extensions - policy - rbac.authorization.k8s.io resources: - pods - secrets - componentstatuses - configmaps - daemonsets - deployments - events - endpoints - horizontalpodautoscalers - ingress - jobs - limitranges - namespaces - nodes - pods - persistentvolumes - persistentvolumeclaims - resourcequotas - replicasets - replicationcontrollers - serviceaccounts - services verbs: ["get", "list", "watch", "create", "update", "patch", "delete"]create the role using the command
kubectl apply -f role.yaml
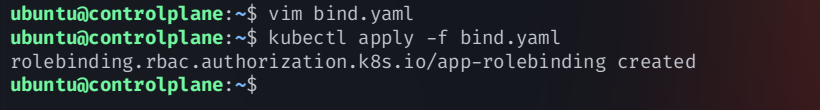
12. Bind Role to Service Account
create a
bind.yamlconfiguration fileapiVersion: rbac.authorization.k8s.io/v1 kind: RoleBinding metadata: name: app-rolebinding namespace: webapps roleRef: apiGroup: rbac.authorization.k8s.io kind: Role name: app-role subjects: - namespace: webapps kind: ServiceAccount name: jenkinscreate the
rolebindingusing the commandkubectl apply -f bind.yaml
13. Create Kubernetes Secret for Jenkins
Create a
secretresource configuration file:secrets.yamlapiVersion: v1 kind: Secret metadata: name: mysecretname annotations: kubernetes.io/service-account.name: jenkins type: kubernetes.io/service-account-tokenCreate secret using the kubectl command
kubectl apply -f secrets.yaml -n webapps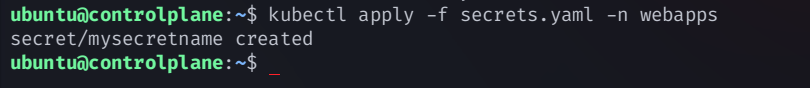
Get the token to connect to jenkins and copy that
kubectl describe secret mysecretname -n webapps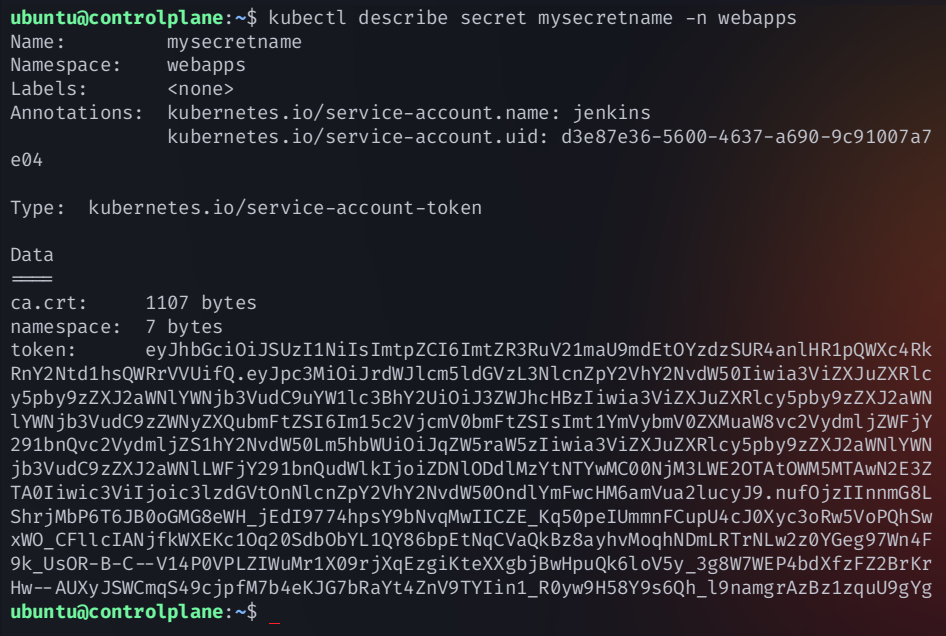
Copy the token and add it to Jenkins Credentials.
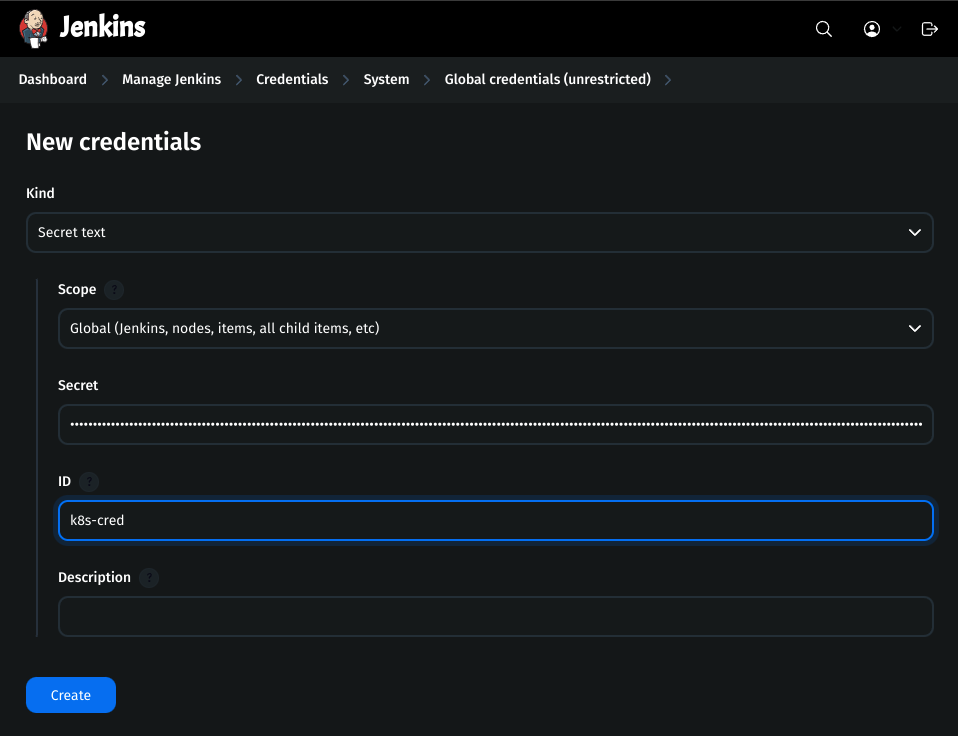
Add the token in the jenkins credentials
Go to Jenkins Dashboard → Manage Jenkins → Credentials
Click on Global and Add a new credential
Kind:
secret textscope:
globalsecret:
token-that-you-copiedID:
k8s-cred
Step 3: Configure Mail Notification
1. Generate Gmail App Password
Search for App Password on any browser.
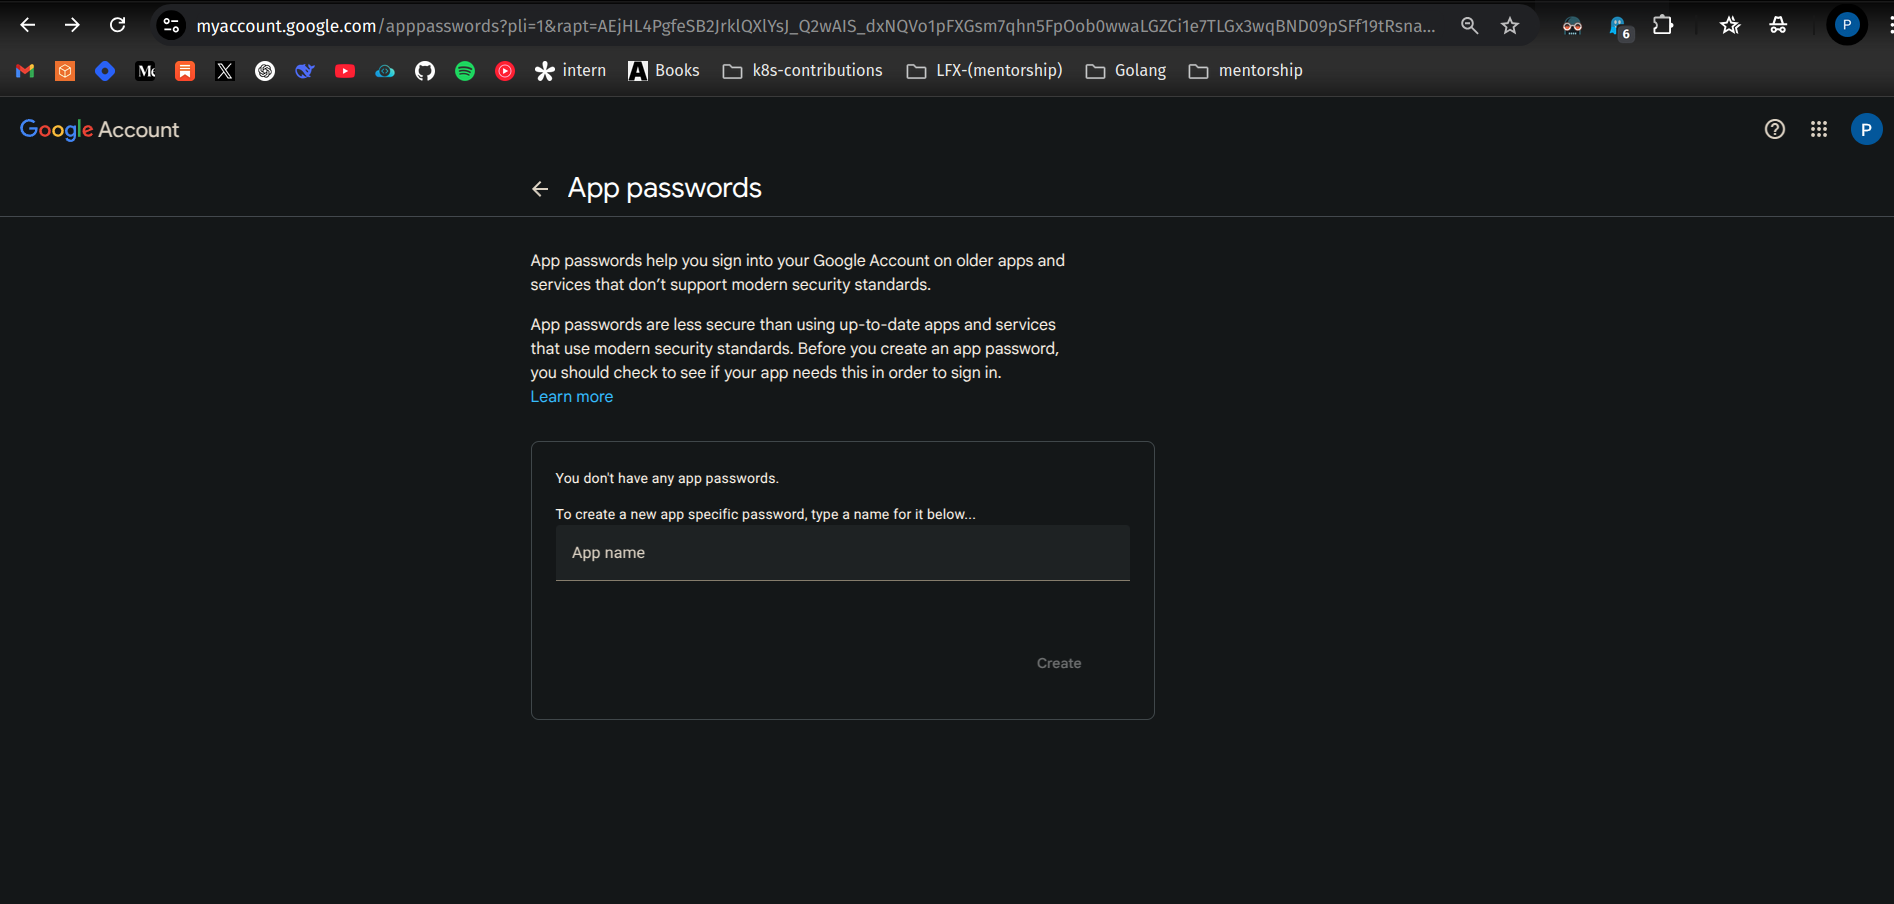
Create a new App password with the name:
Jenkins.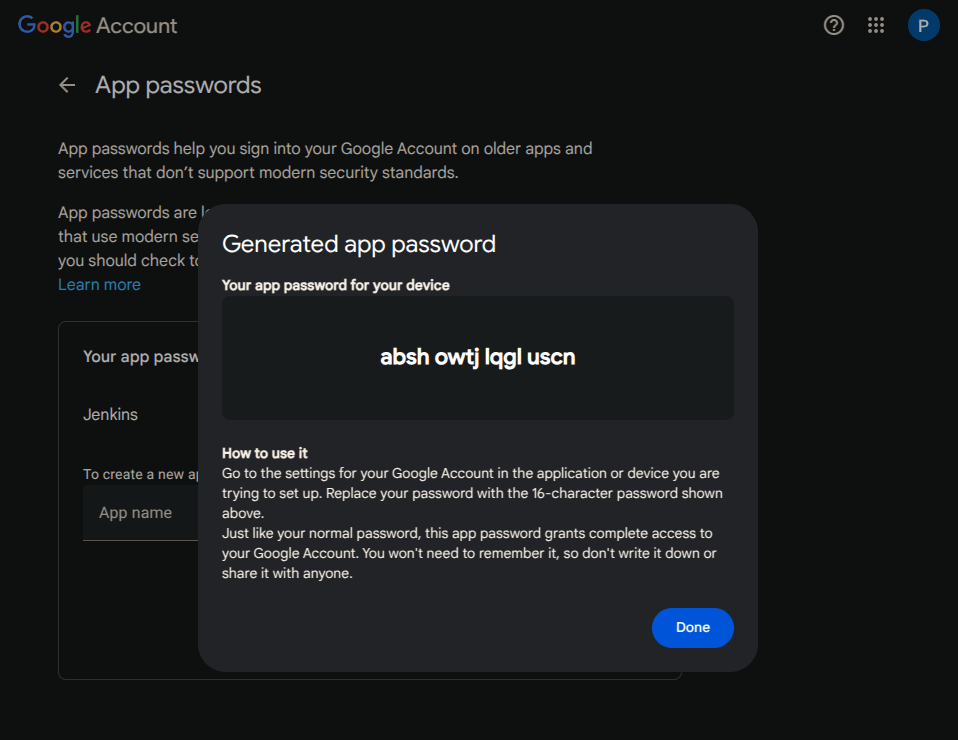
Copy the generated token.
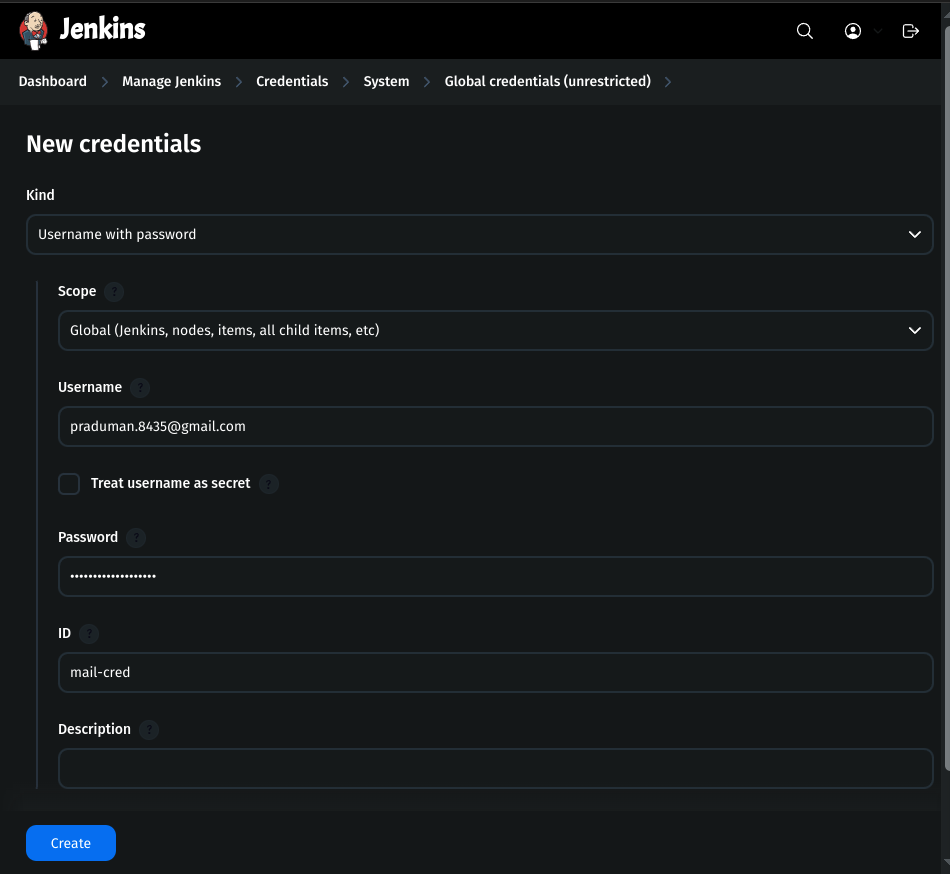
2. Add Gmail Credentials to Jenkins
Go to Jenkins Dashboard → Manage Jenkins → Credentials.
Click on Global and add a new credential:
Kind: Username with password
Scope: Global
Username: your-gmail
Password: generated token
ID:
mail-cred
3. Configure Mail Server in Jenkins
Go to Jenkins Dashboard → Manage Jenkins → System.
Search for Extended E-mail Notification.
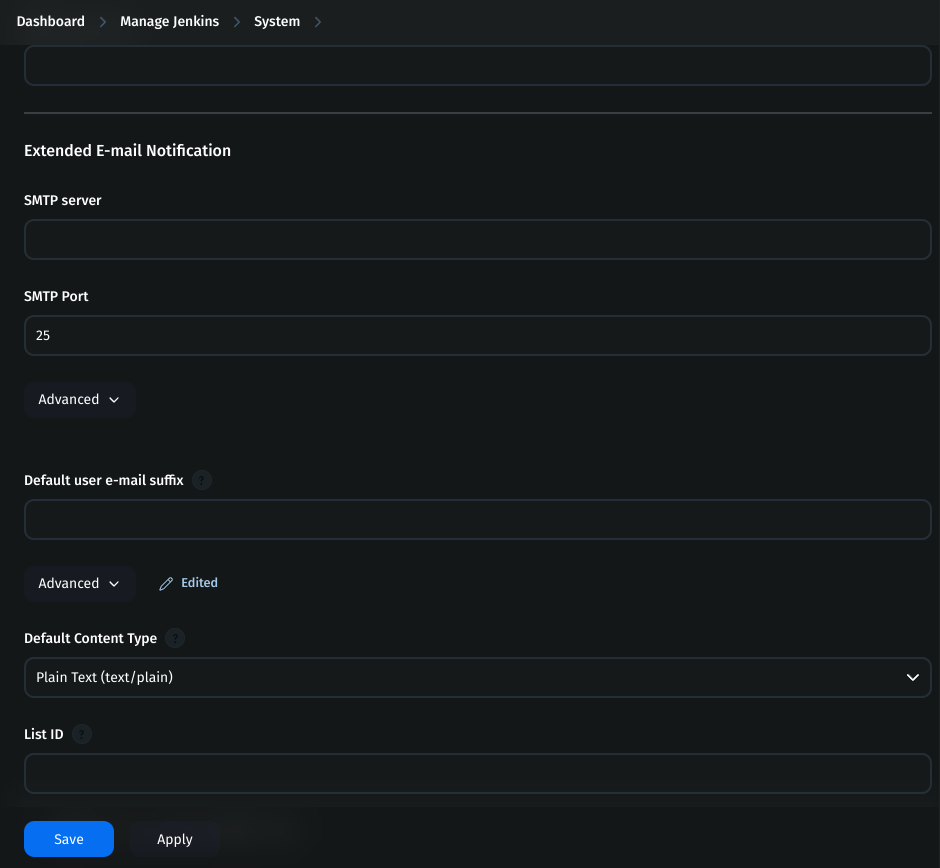
Fill in the details:
SMTP server:
smtp.gmail.comSMTP port:
465Credentials: Choose
mail-credCheck Use SSL
Find the E-mail Notification section and configure
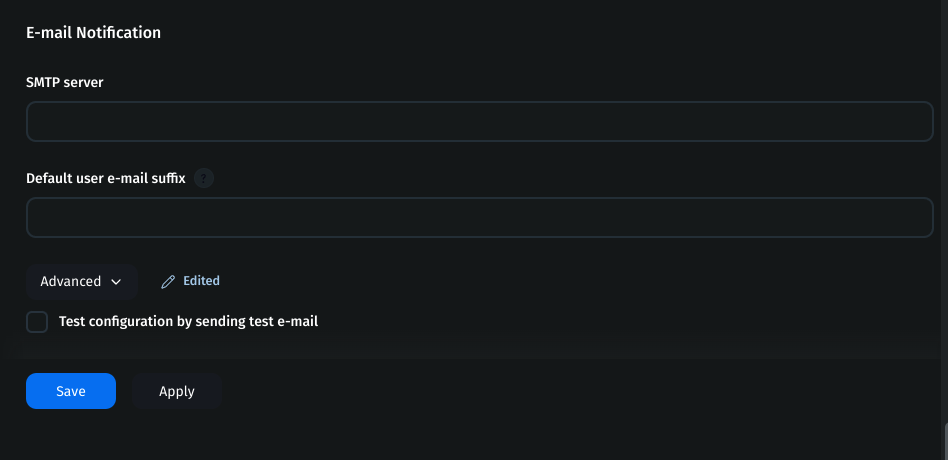
SMTP server:
smtp.gmail.comSMTP port:
465Check Use SSL
Check Use SMTP Authentication
Username: email ID
Password: copied app token
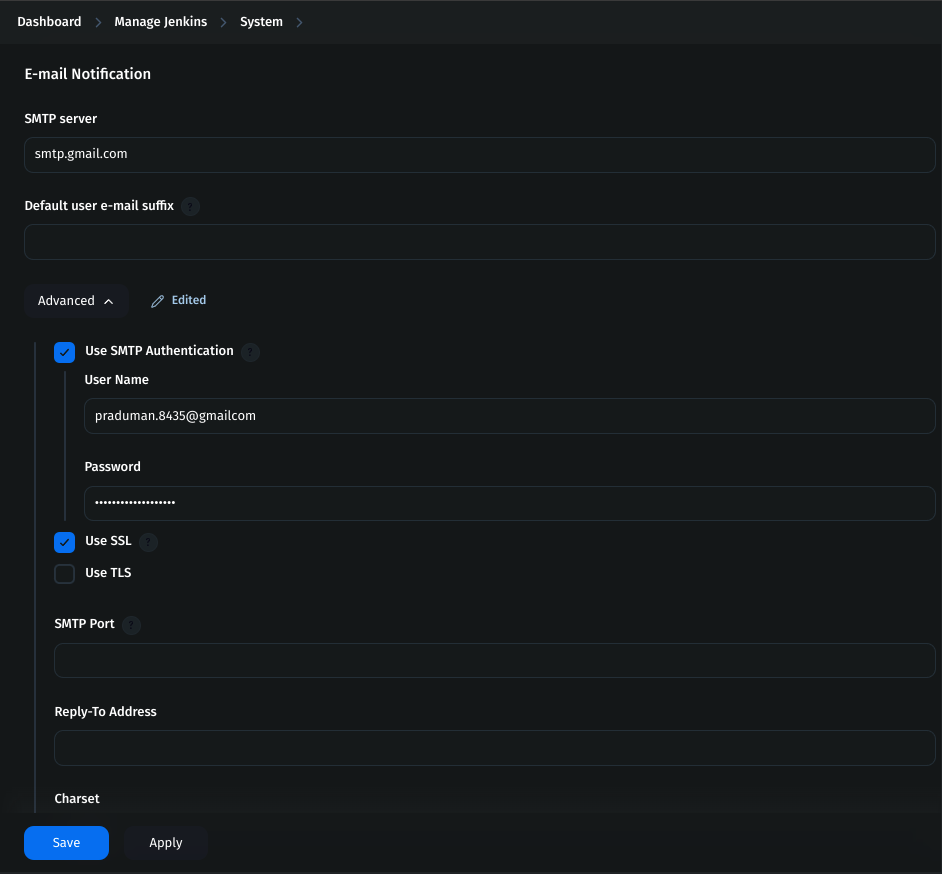
- Save the changes.
Step 4: Create a Jenkins Pipeline
A Jenkins pipeline automates the software development lifecycle, including building, testing, and deploying applications.
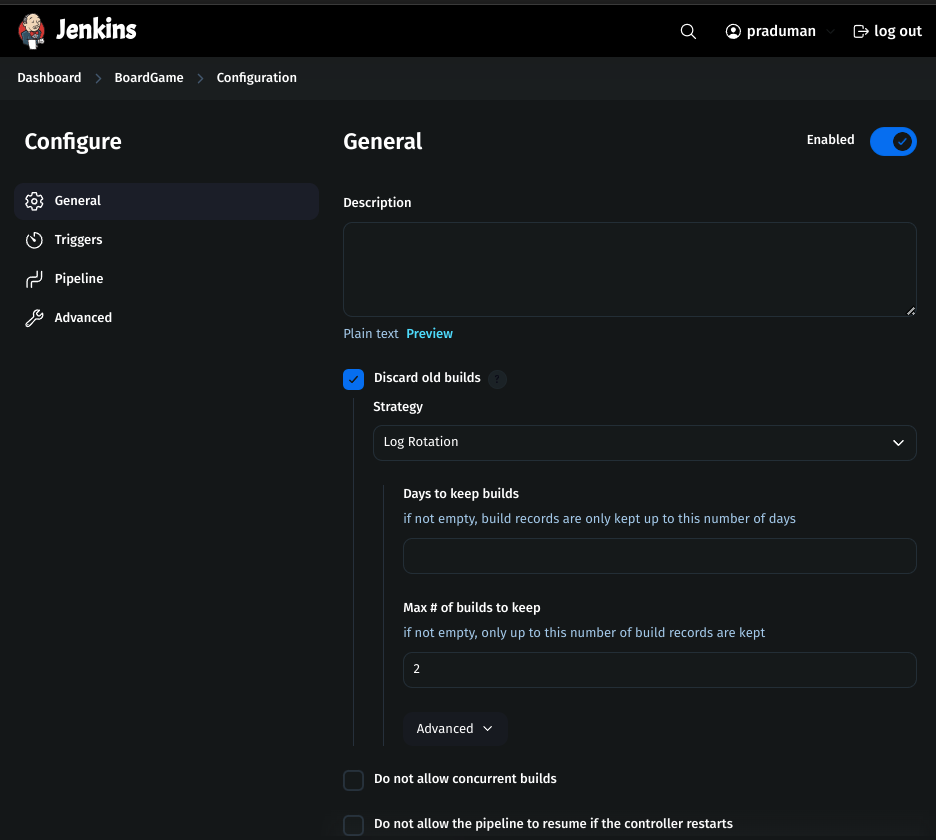
1. General Settings
Check Discard Old Builds to limit stored build history.
Configure:
Max builds to keep: 10
Max days to keep builds: 30
2. Define the Pipeline Script
pipeline {
    agent any

    tools{
        jdk 'jdk17'
        maven 'maven3'
    }
    environment {
        SCANNER_HOME= tool 'sonar-scanner'
    }

    stages {
        stage('Git Checkout') {
            steps {
                git credentialsId: 'git-cred', url: 'https://github.com/praduman8435/Boardgame.git'
            }
        }
        stage('Compile') {
            steps {
                sh "mvn compile"
            }
        }
        stage('Test') {
            steps {
                sh "mvn test"
            }
        }
        stage('File System Scan') {
            steps {
                sh "trivy fs --format table -o trivy-fs-report.html ."
            }
        }
        stage('Code Quality Analysis') {
            steps {
                withSonarQubeEnv('sonar') {
                    sh ''' $SCANNER_HOME/bin/sonar-scanner -Dsonar-projectName=BoardGame -Dsonar.projectKey=BoardGame \
                            -Dsonar.java.binaries=. '''
                }
            }
        }
        stage('Quality Gate') {
            steps {
                script {
                    waitForQualityGate abortPipeline: false, credentialsId: 'sonar-token'
                }
            }
        }
        stage('Build') {
            steps {
                sh "mvn package"
            }
        }
        stage('Publish Artifacts to Nexus') {
            steps {
                withMaven(globalMavenSettingsConfig: 'global-settings', jdk: 'jdk17', maven: 'maven3', mavenSettingsConfig: '', traceability: true) {
                    sh "mvn deploy"
                }
            }
        }
        stage('Build & Tag Docker Image') {
            steps {
                script {
                    withDockerRegistry(credentialsId: 'docker-cred', toolName: 'docker') {
                        sh "docker build -t thepraduman/boardgame:latest ."
                    }
                }
            }
        }
        stage('Docker Image Scan') {
            steps {
                sh "trivy image --format table -o trivy-image-report.html  thepraduman/boardgame:latest"
            }
        }
        stage('Push Docker Image') {
            steps {
                script {
                    withDockerRegistry(credentialsId: 'docker-cred', toolName: 'docker') {
                        sh "docker push thepraduman/boardgame:latest"
                    }
                }
            }
        }
        stage('Deploy to k8s') {
            steps {
                withKubeConfig(caCertificate: '', clusterName: 'kubernetes', contextName: '', credentialsId: 'k8s-cred', namespace: 'webapps', restrictKubeConfigAccess: false, serverUrl: 'https://172.31.39.125:6443') {
                    sh "kubectl apply -f k8s-manifest"
                }
            }
        }
        stage('Verify the deployment') {
            steps {
                withKubeConfig(caCertificate: '', clusterName: 'kubernetes', contextName: '', credentialsId: 'k8s-cred', namespace: 'webapps', restrictKubeConfigAccess: false, serverUrl: 'https://172.31.39.125:6443') {
                    sh "kubectl get pods -n webapps"
                    sh "kubectl get svc -n webapps"
                }
            }
        }
    }
}
3. Build the Pipeline
Click on Build Now to build the pipeline
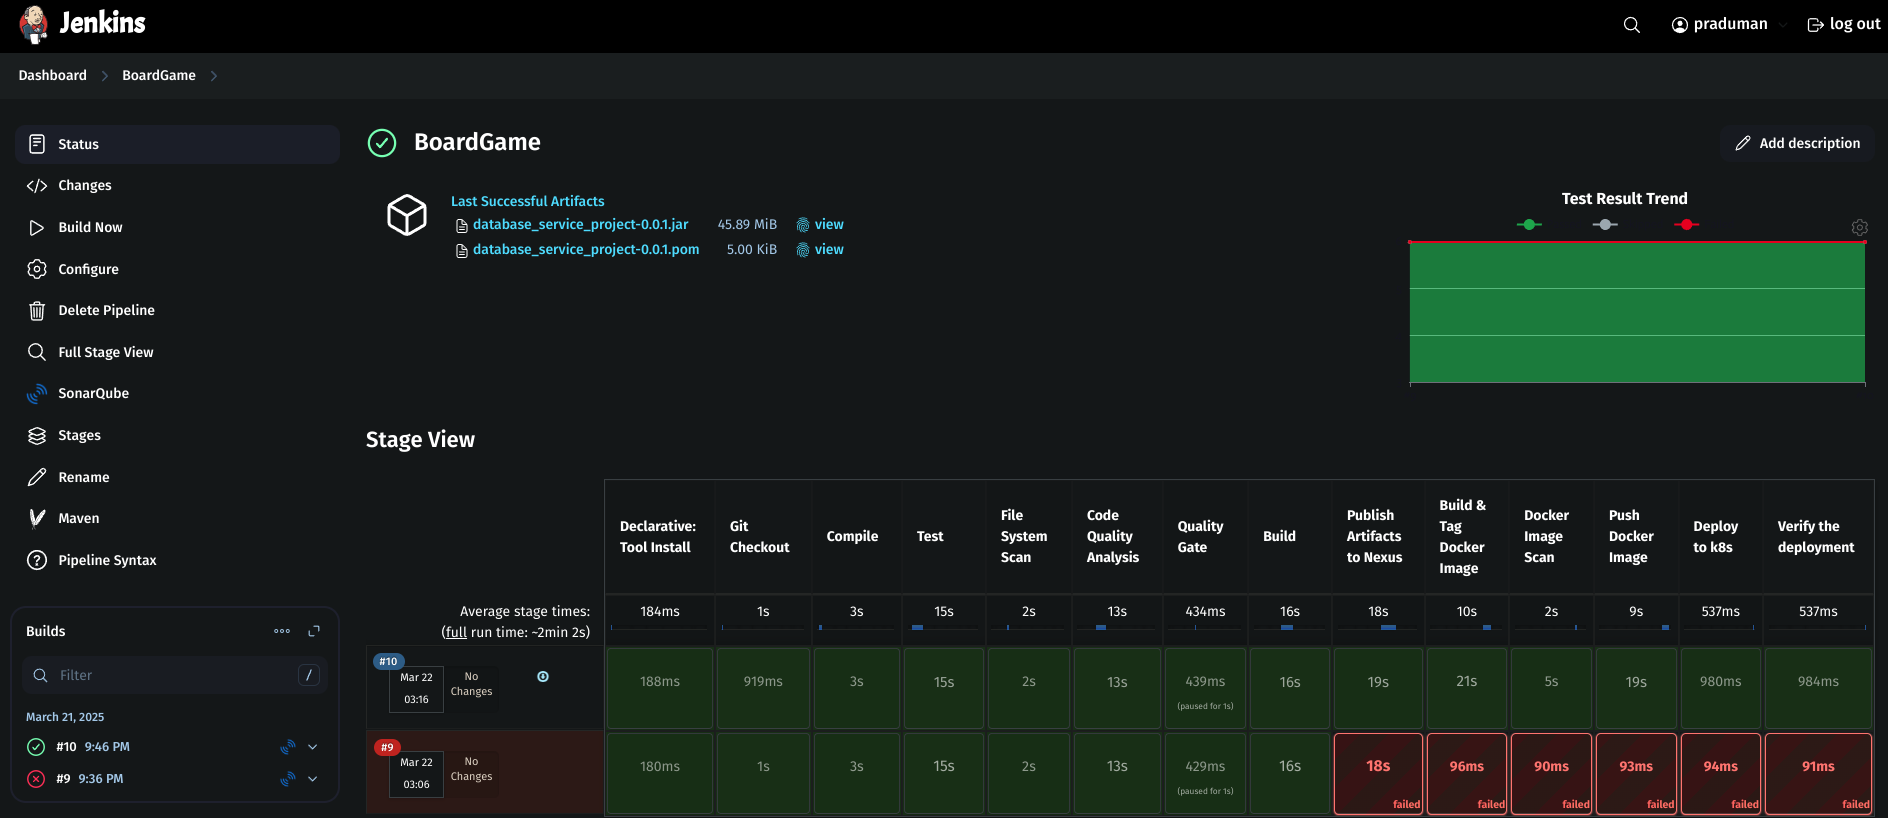
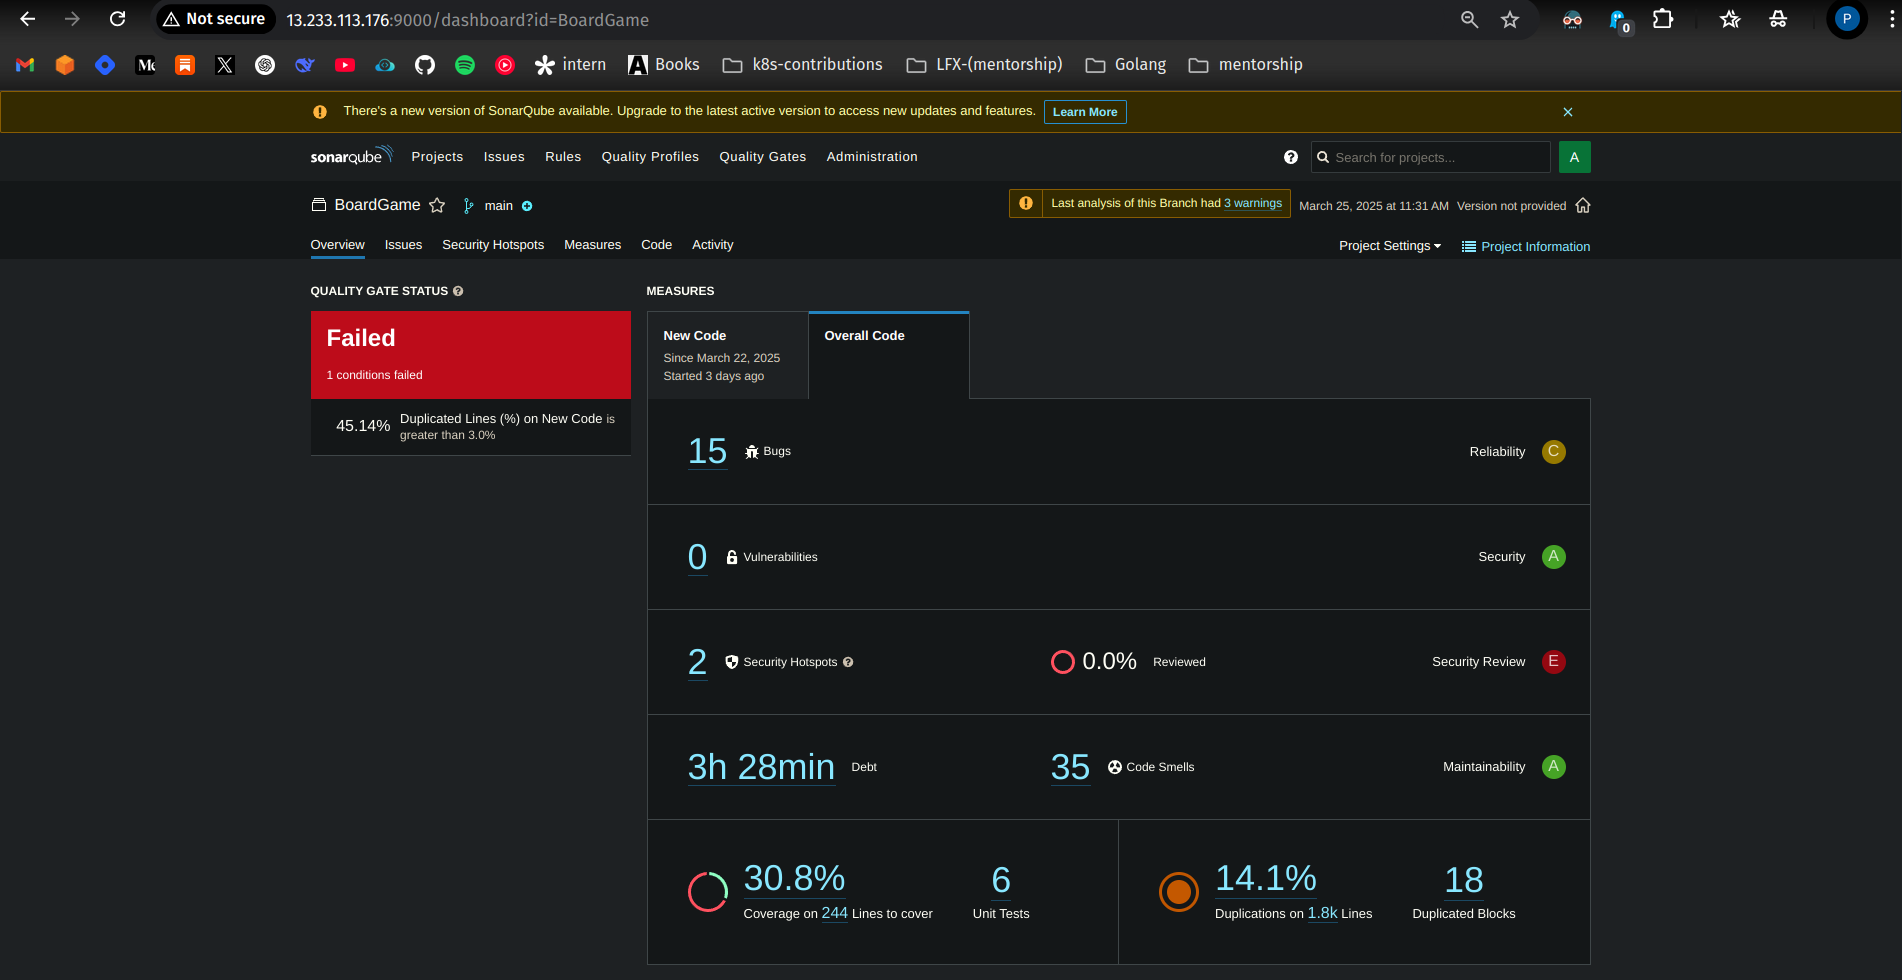
Check the SonarQube Dashboard
Setup Monitoring (Prometheus & Grafana)
Create an EC2 Instance for Monitoring
Go to AWS console and launch an EC2 instance.
Instance Name: Monitoring
AMI: Ubuntu
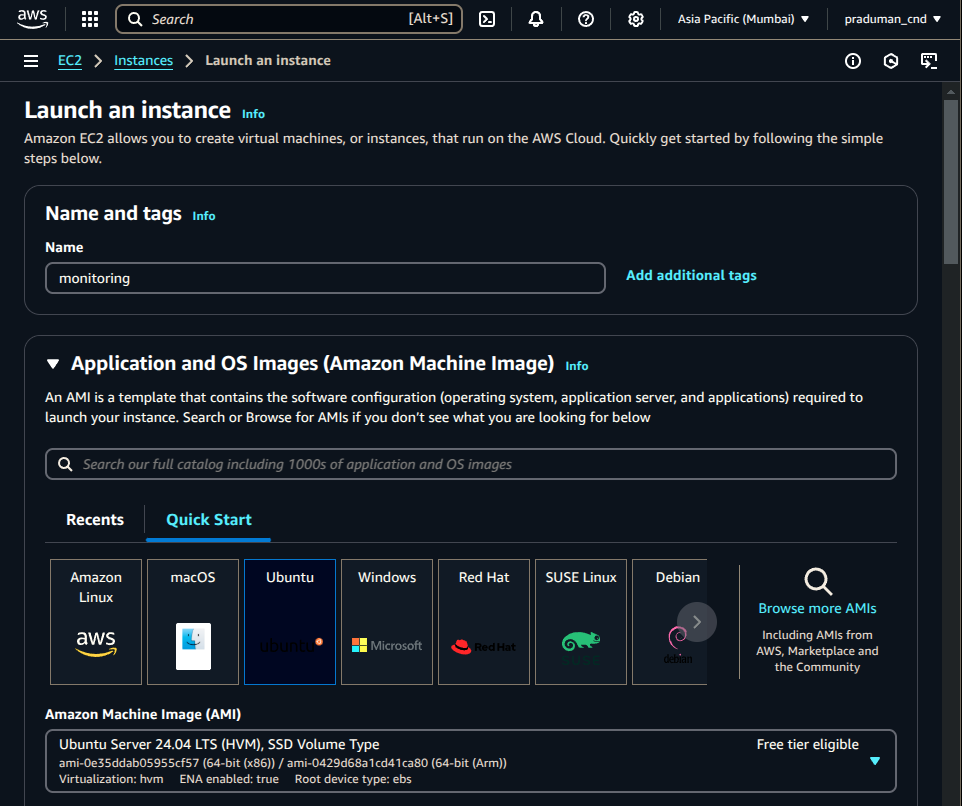
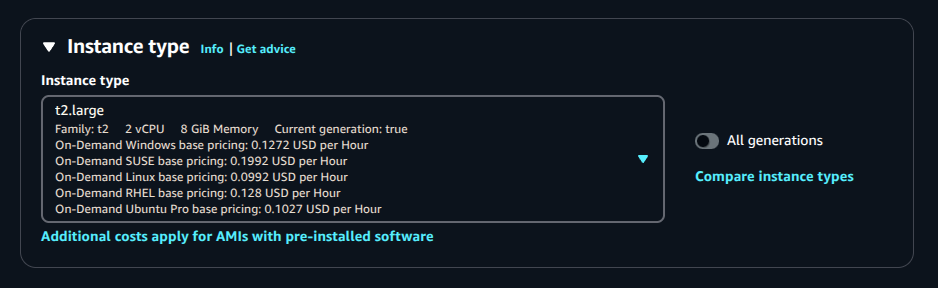
Instance Type: t2.large
Key-Pair: Create a new key-pair or use an existing one.
Security Group: Use the previously created one.
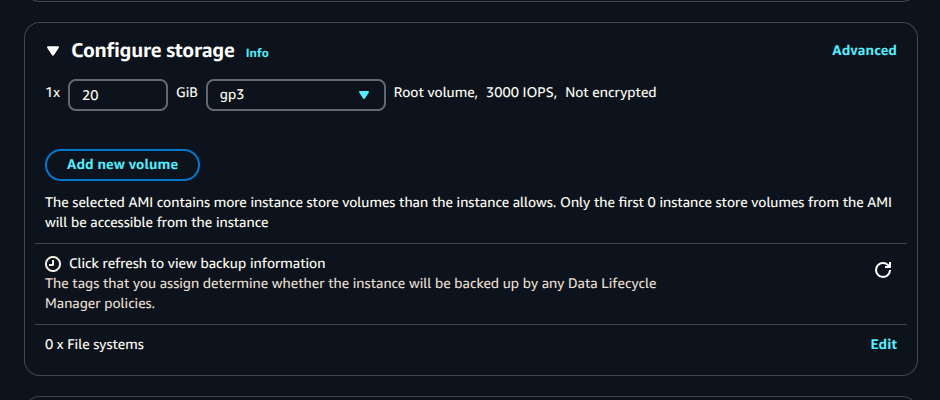
Storage: 20 GiB
Click Launch Instance.
SSH into the Monitoring Server
Copy the public IP of the monitoring server.
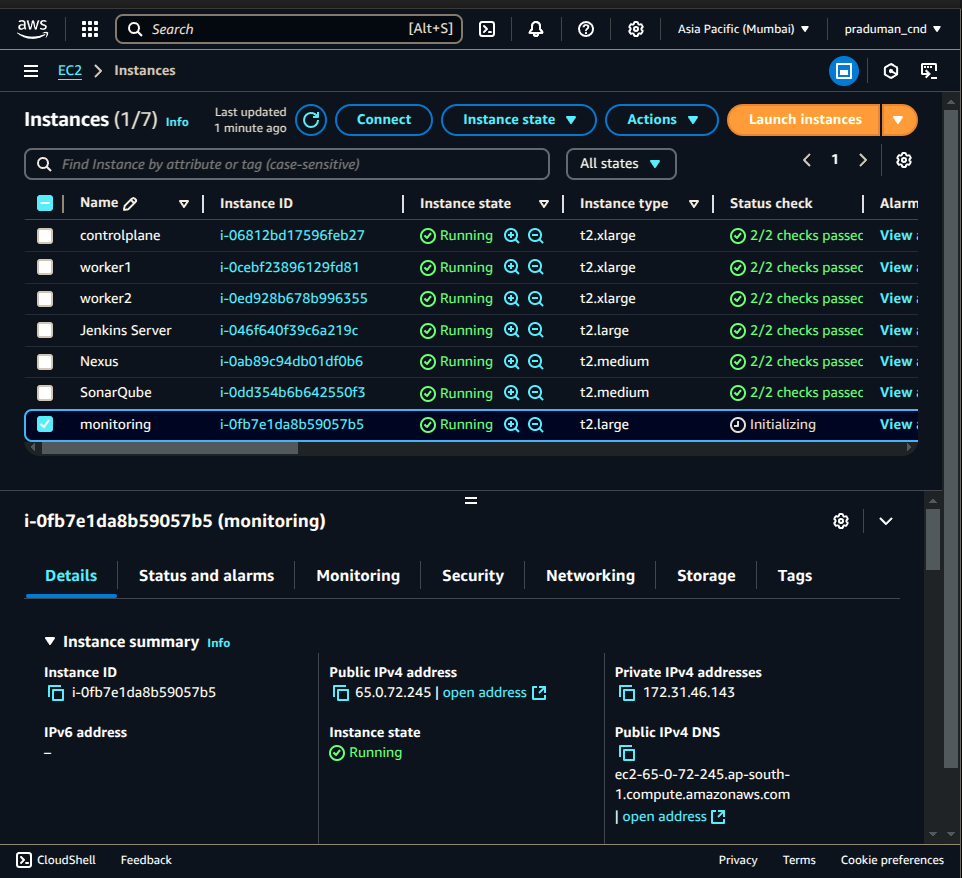
Connect via SSH from your local machine:
ssh -i <path-to-pem-file> ubuntu@<public-IP>Update the server:
sudo apt update
Install Prometheus
Download Prometheus:
wget https://github.com/prometheus/prometheus/releases/download/v3.2.1/prometheus-3.2.1.linux-amd64.tar.gz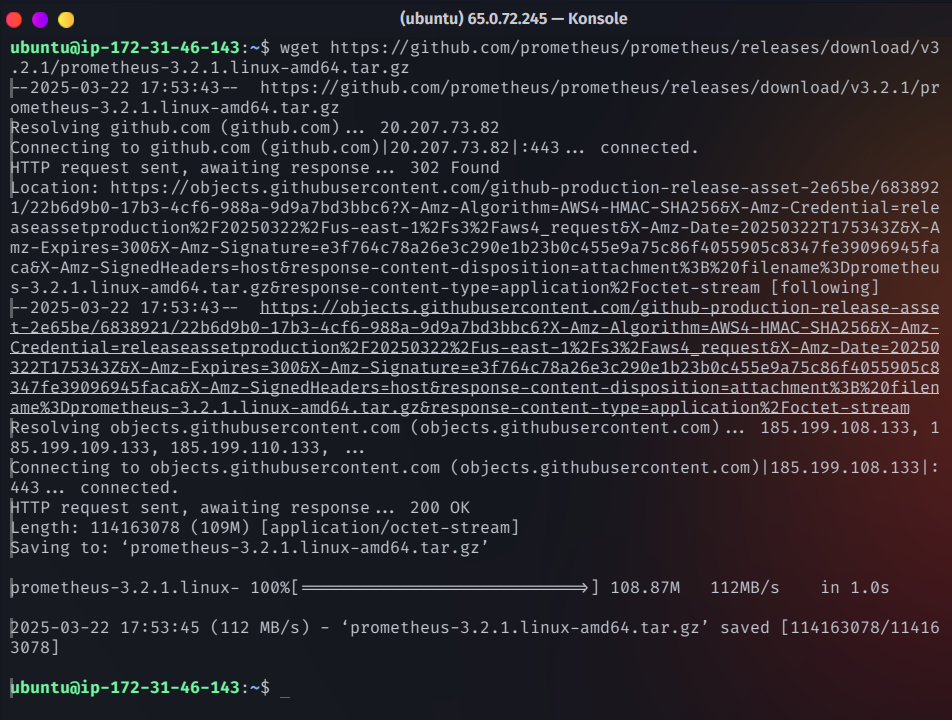
Extract the tar file:
tar -xvf prometheus-3.2.1.linux-amd64.tar.gz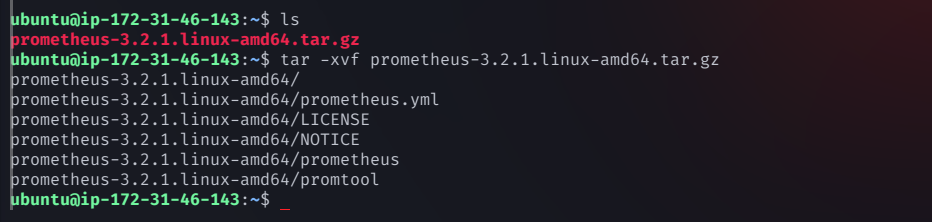
Navigate to the Prometheus directory:
cd prometheus-3.2.1.linux-amd64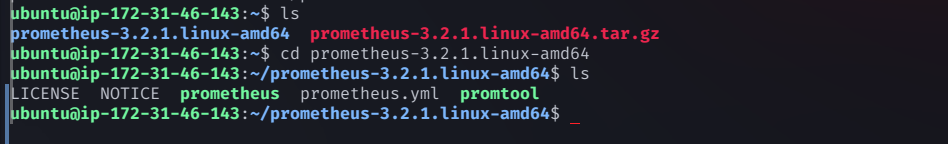
Run Prometheus in the background:
./prometheus &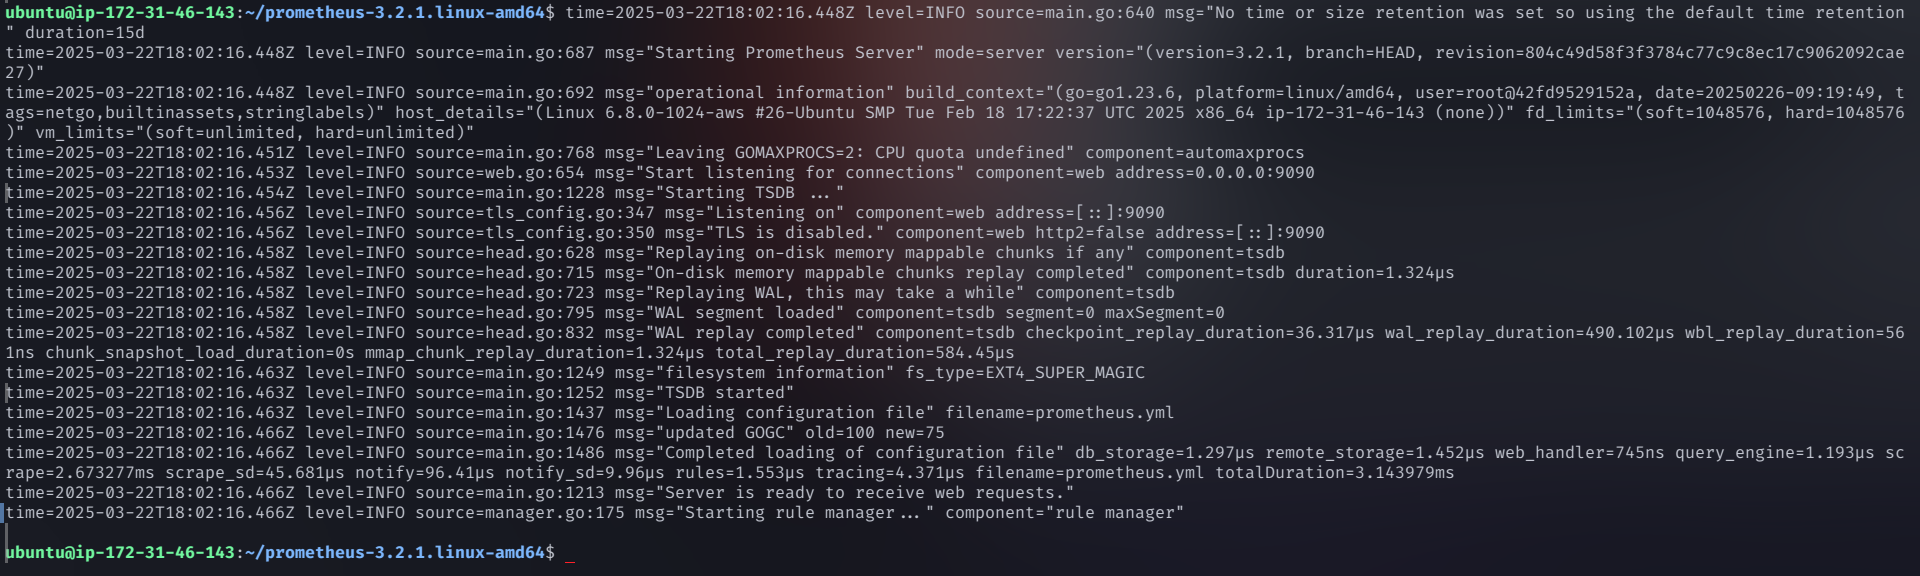
Access Prometheus at:
http://<public-IP-of-monitoring>:9090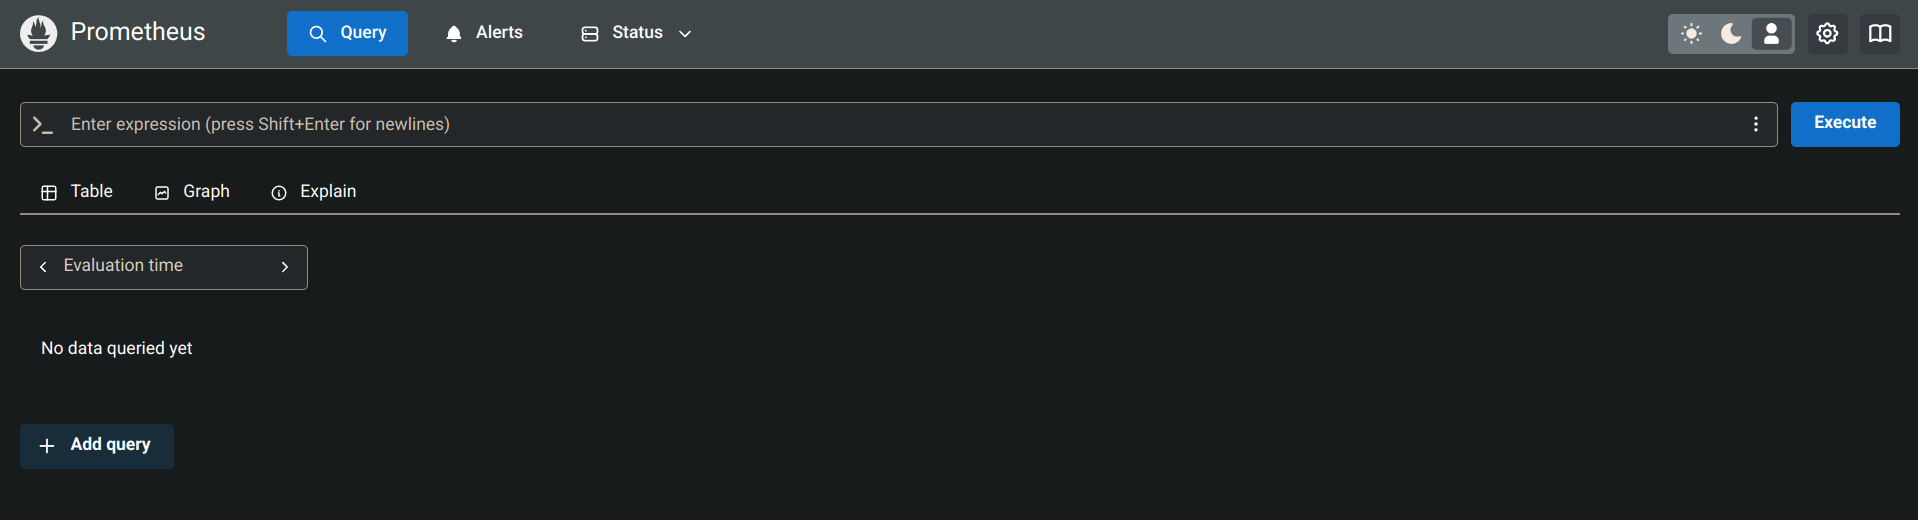
Install Grafana
Install dependencies:
sudo apt-get install -y adduser libfontconfig1 muslDownload and install Grafana:
 wget https://dl.grafana.com/enterprise/release/grafana-enterprise_11.5.2_amd64.deb
 sudo dpkg -i grafana-enterprise_11.5.2_amd64.deb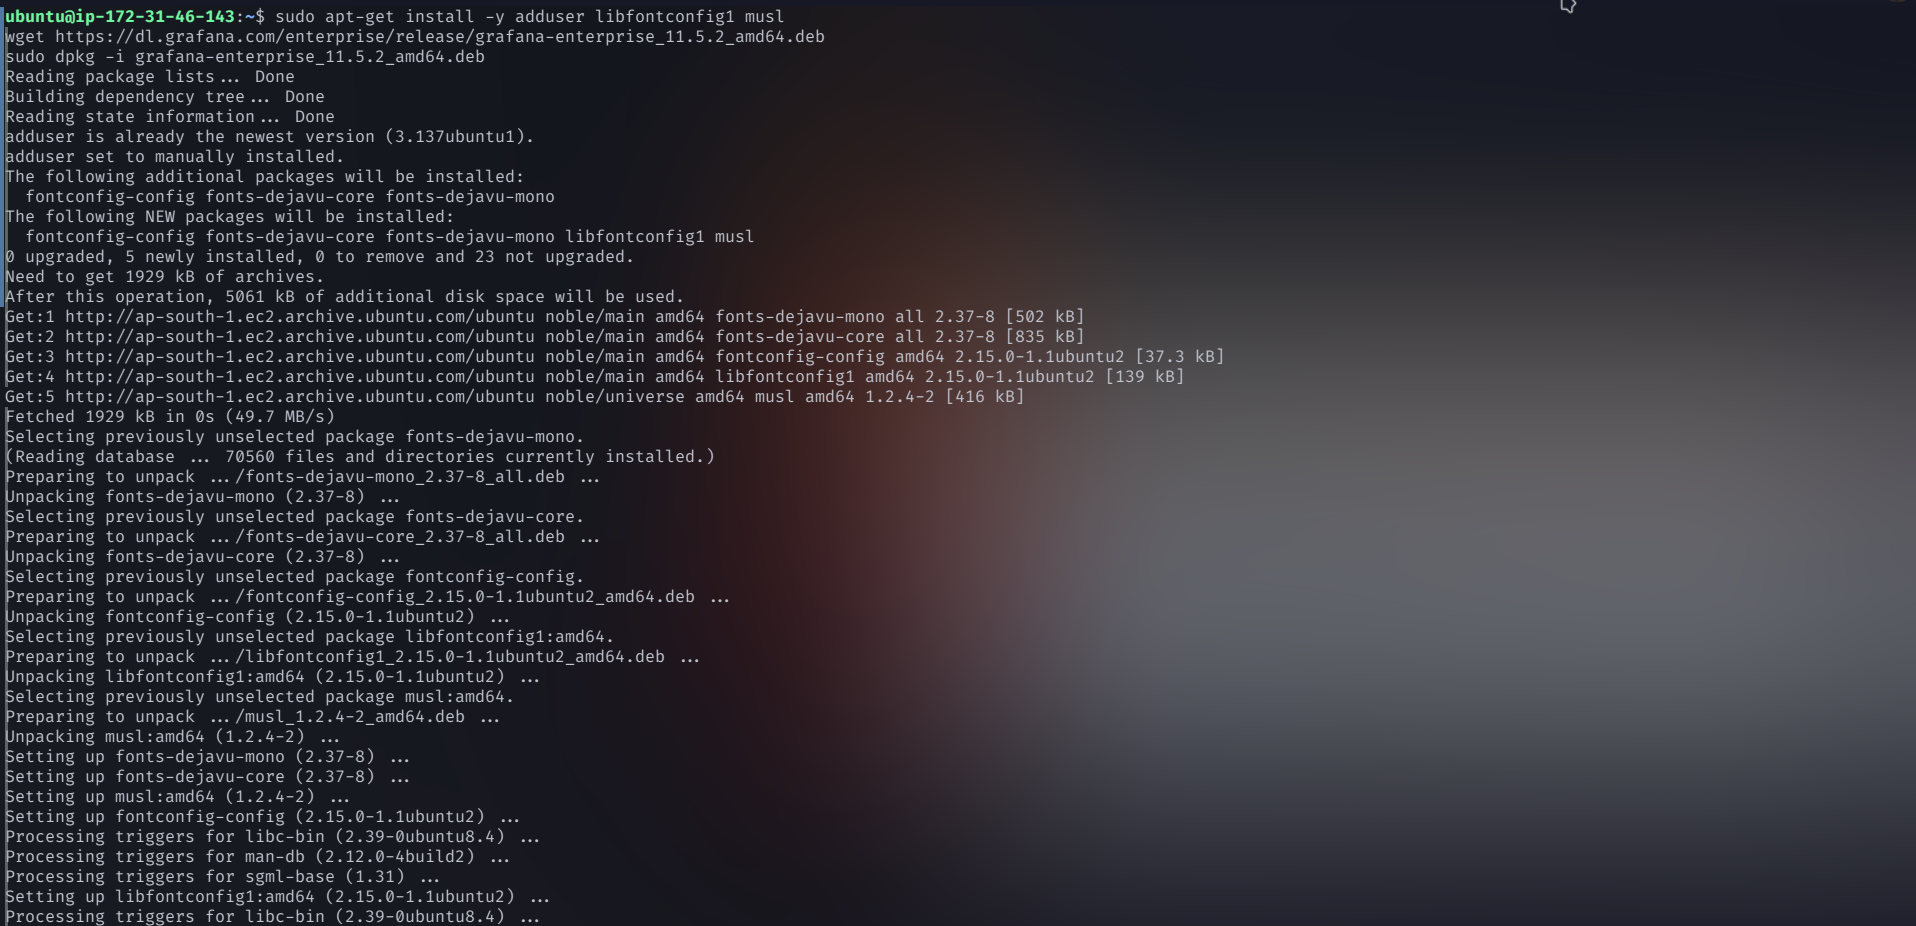
Start Grafana:
sudo systemctl start grafana-serverAccess Grafana at:
http://<public-IP-of-monitoring>:3000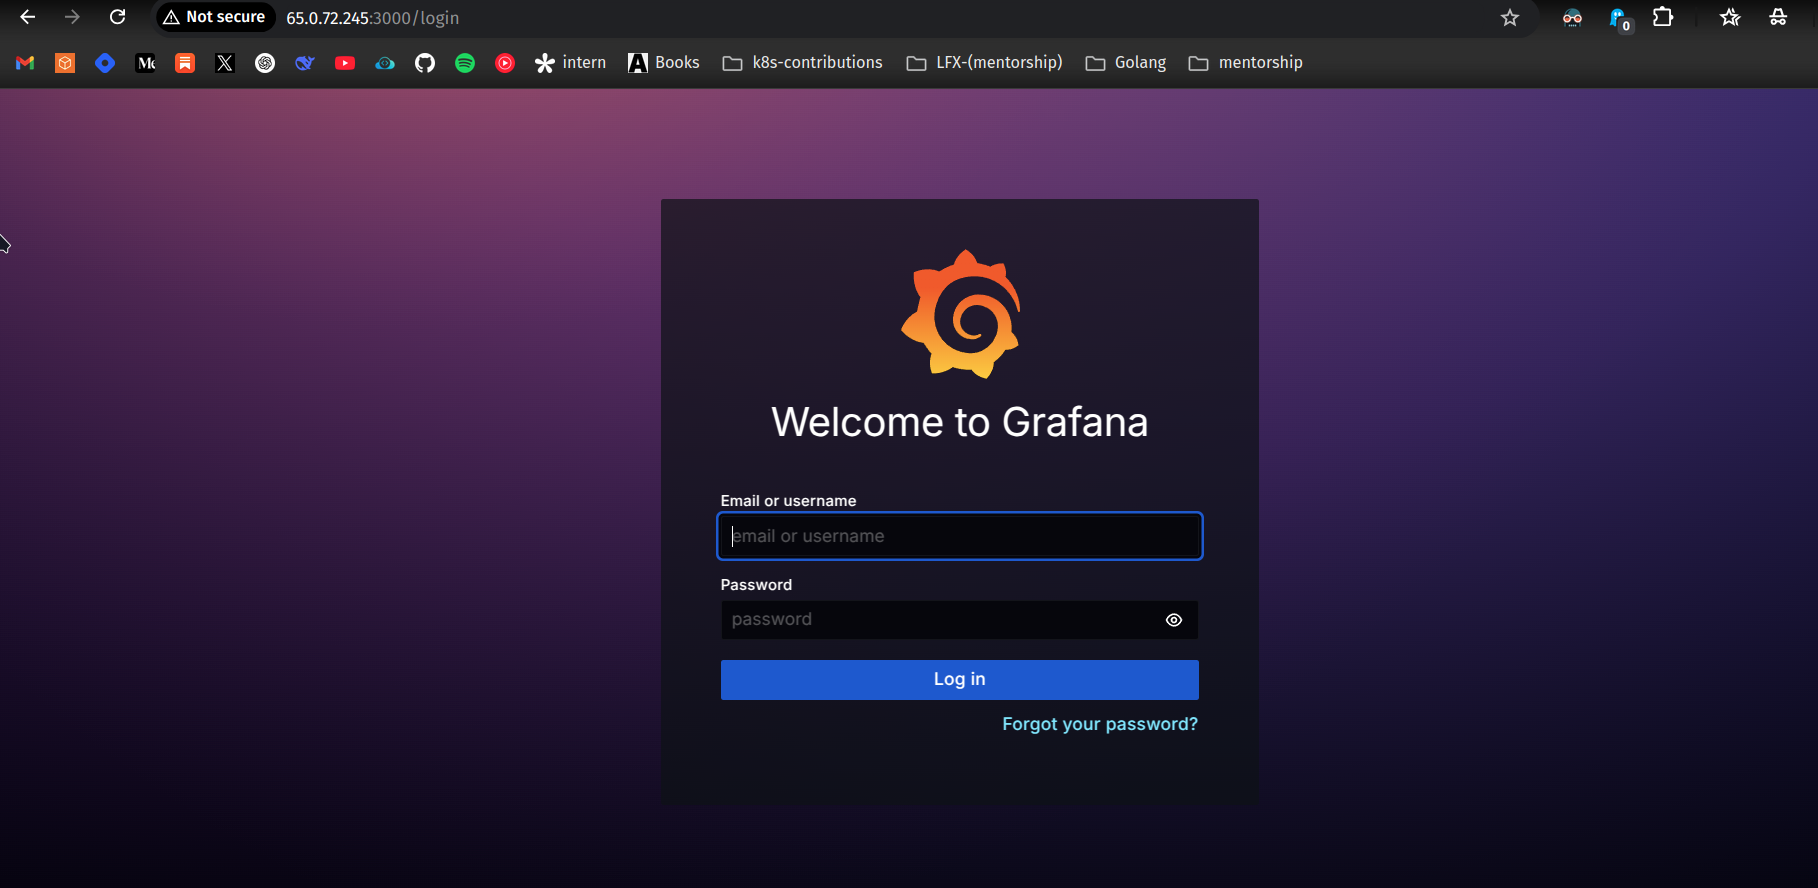
Default credentials:
Username: admin
Password: admin (Change it after logging in)
Install Blackbox Exporter
Download Blackbox Exporter:
wget https://github.com/prometheus/blackbox_exporter/releases/download/v0.26.0/blackbox_exporter-0.26.0.linux-amd64.tar.gz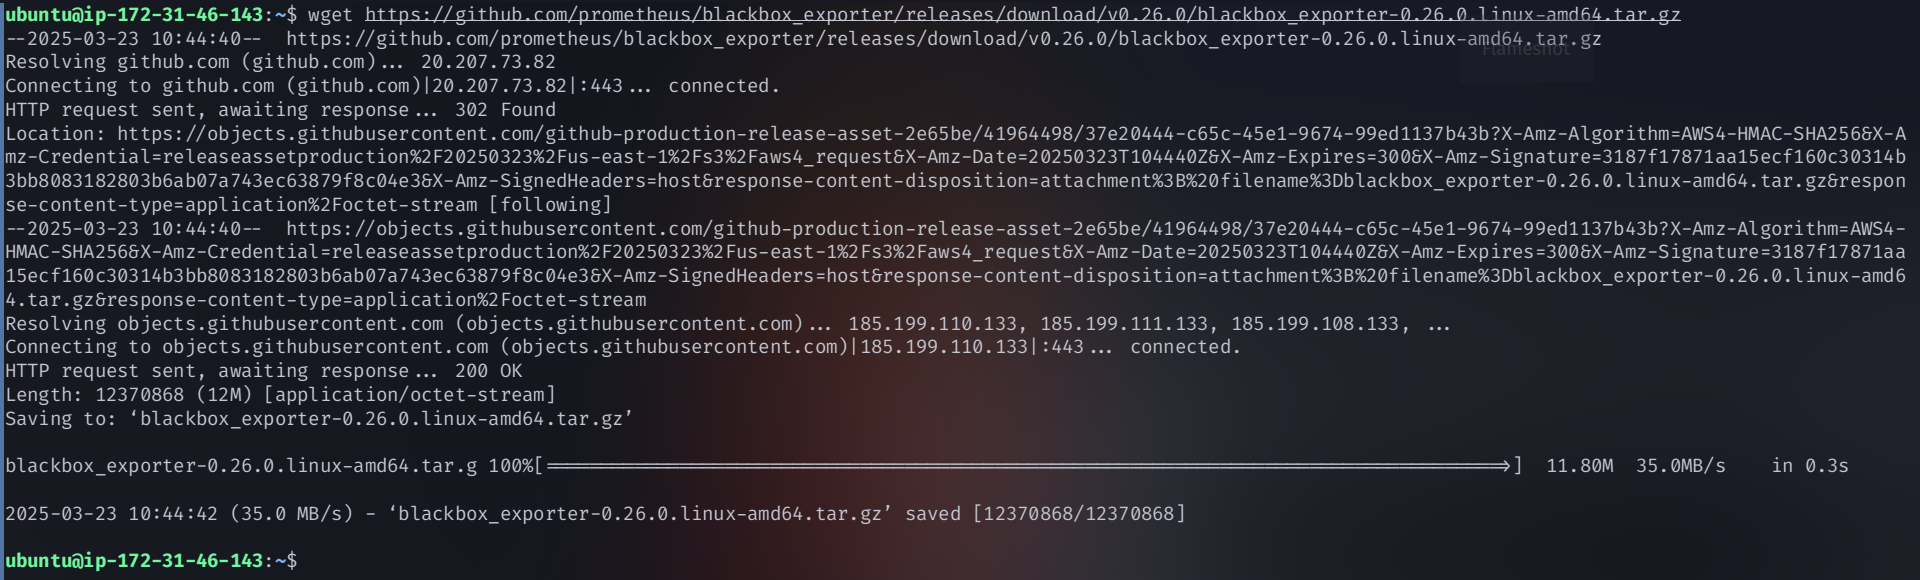
Extract the tar file:
tar -xvf blackbox_exporter-0.26.0.linux-amd64.tar.gz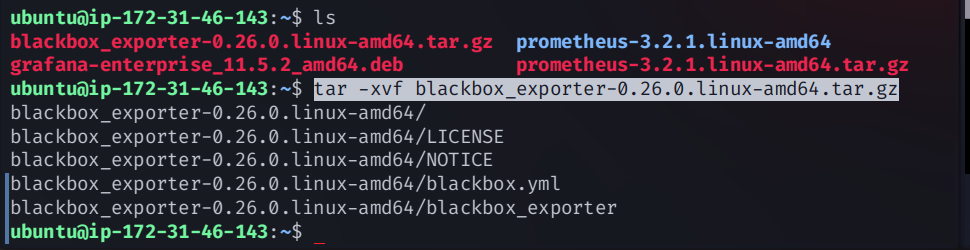
Navigate to the directory:
cd blackbox_exporter-0.26.0.linux-amd64Run Blackbox Exporter:
./blackbox_exporter &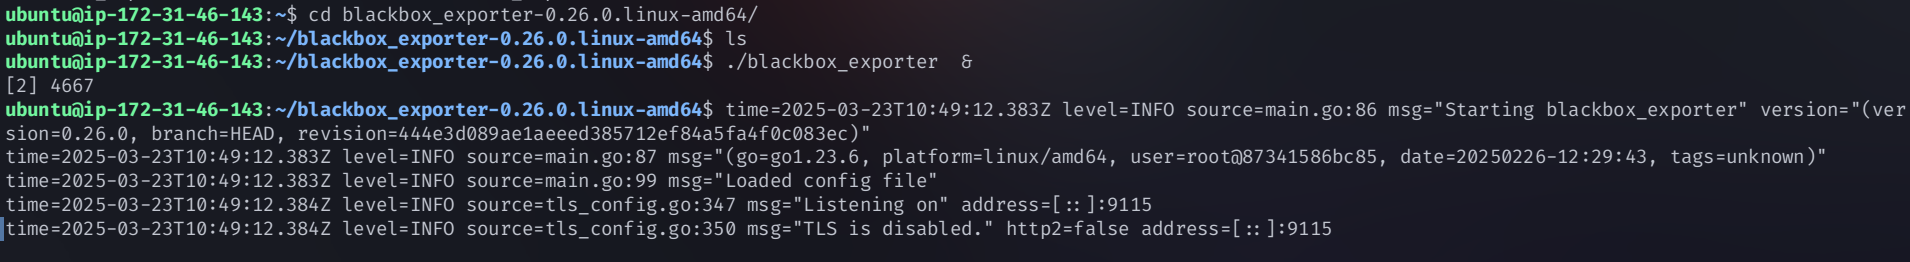
Access at:
http://<public-IP-of-monitoring>:9115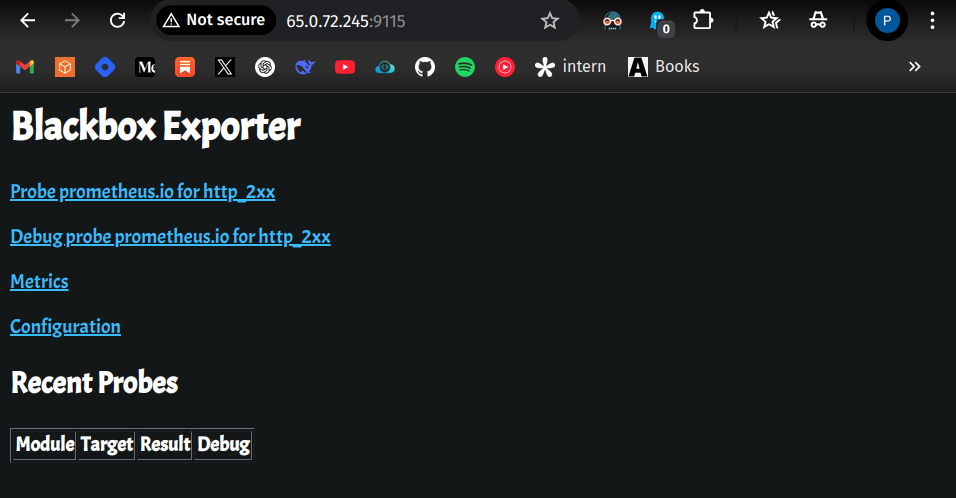
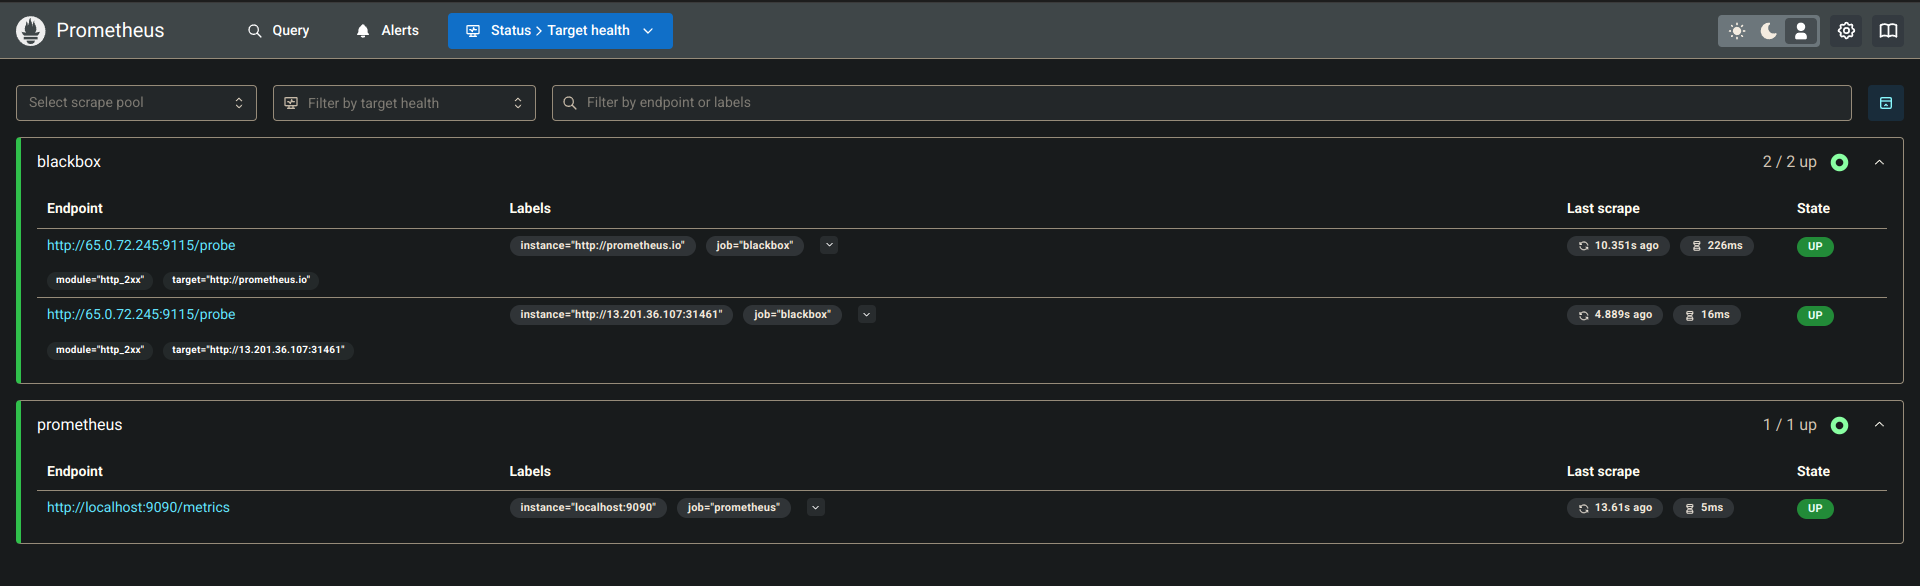
Configure Prometheus
Edit
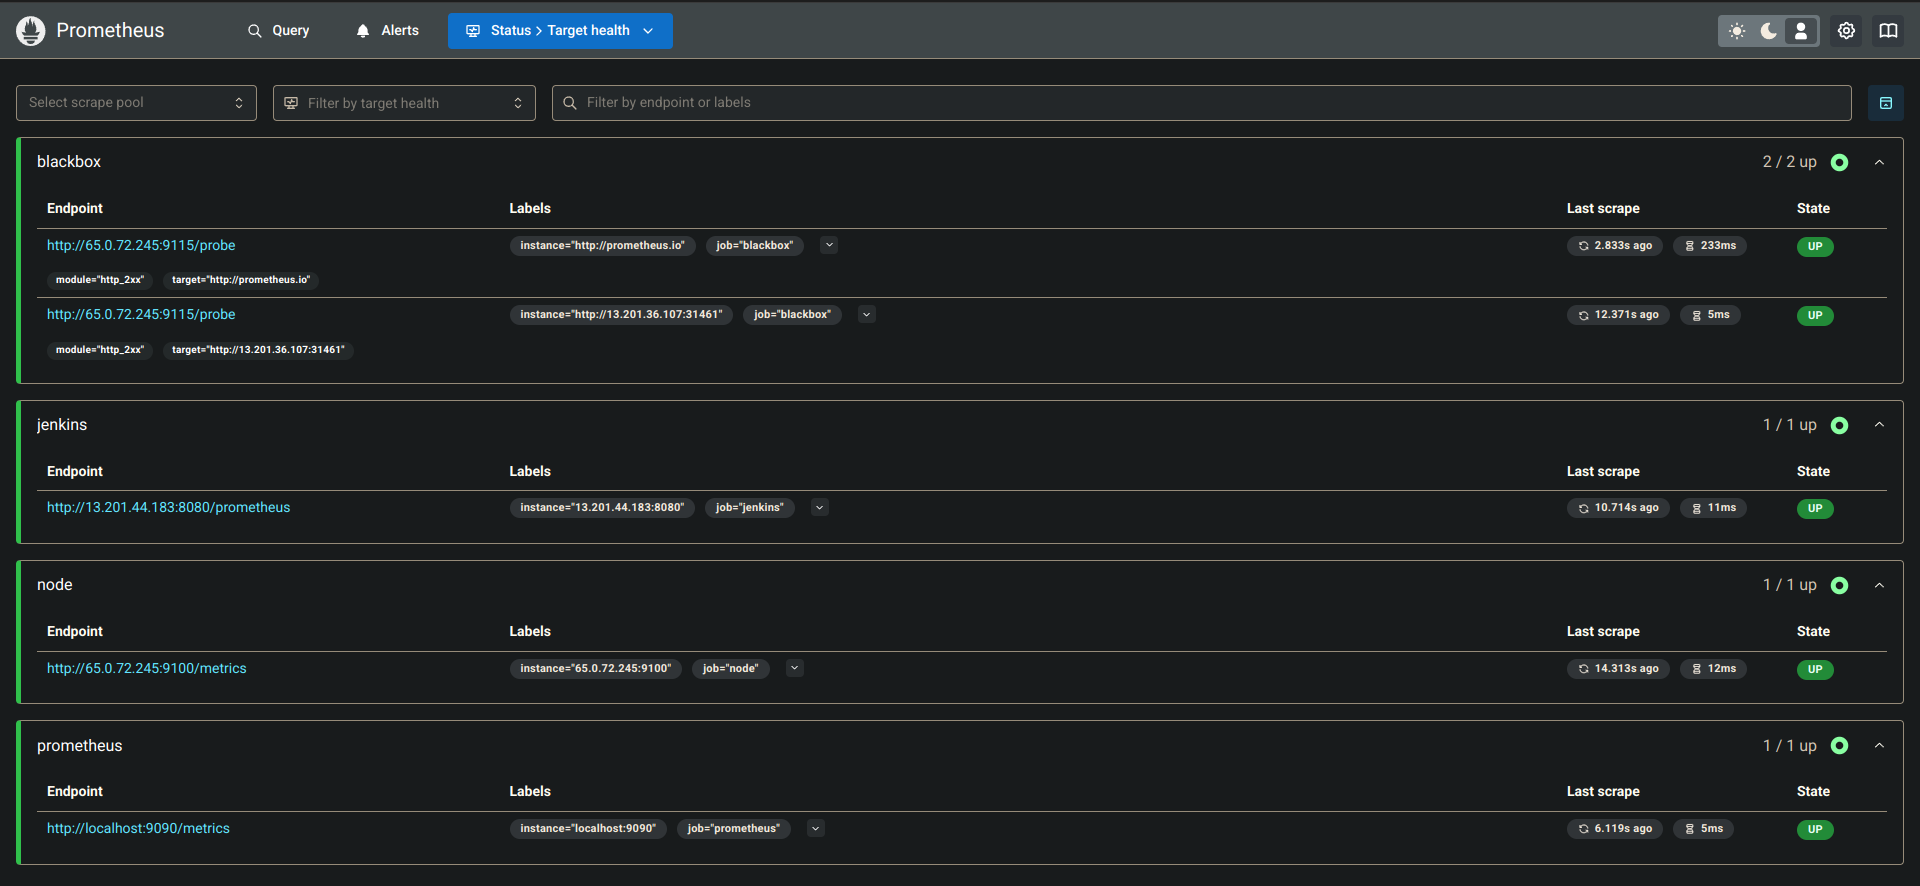
prometheus.yml:vim prometheus.ymlAdd Blackbox Exporter job:
 - job_name: 'blackbox'
   metrics_path: /probe
   params:
     module: [http_2xx]  # Look for a HTTP 200 response.
   static_configs:
     - targets:
       - http://prometheus.io    # Target to probe with http.
       - https://prometheus.io   # Target to probe with https.
       - http://example.com:8080 # Target to probe with http on port 8080.
   relabel_configs:
     - source_labels: [__address__]
       target_label: __param_target
     - source_labels: [__param_target]
       target_label: instance
     - target_label: __address__
       replacement: 127.0.0.1:9115  # The blackbox exporter's real hostname:port.
Restart Prometheus:
pgrep prometheuskill <PID>./prometheus &Check Prometheus Dashboard → Status → Target.
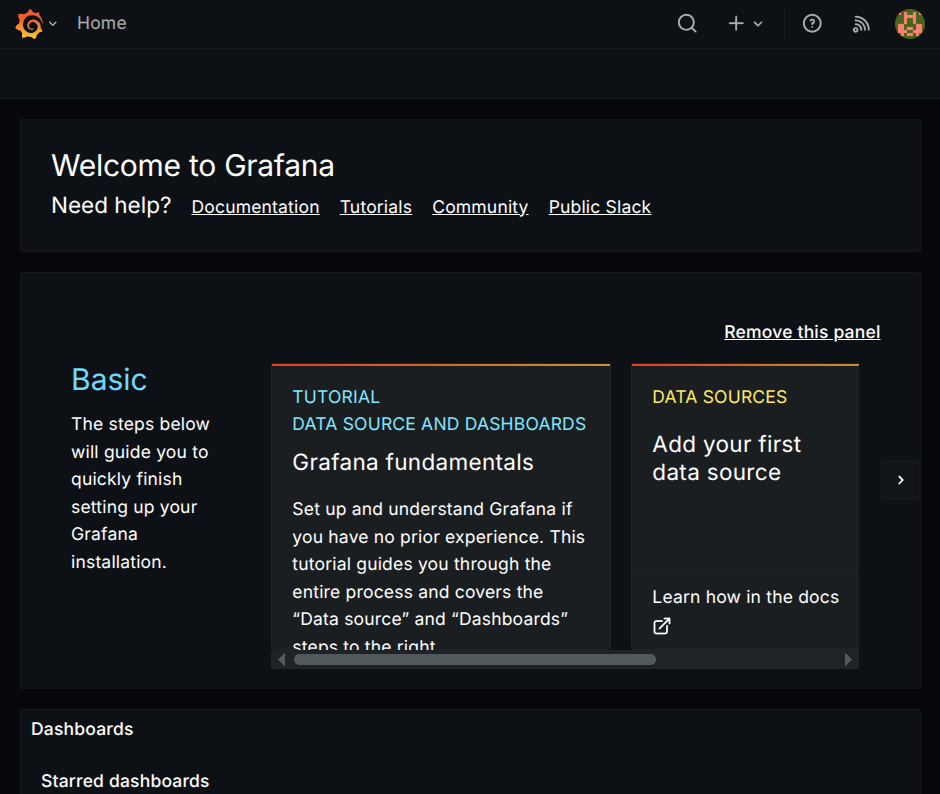
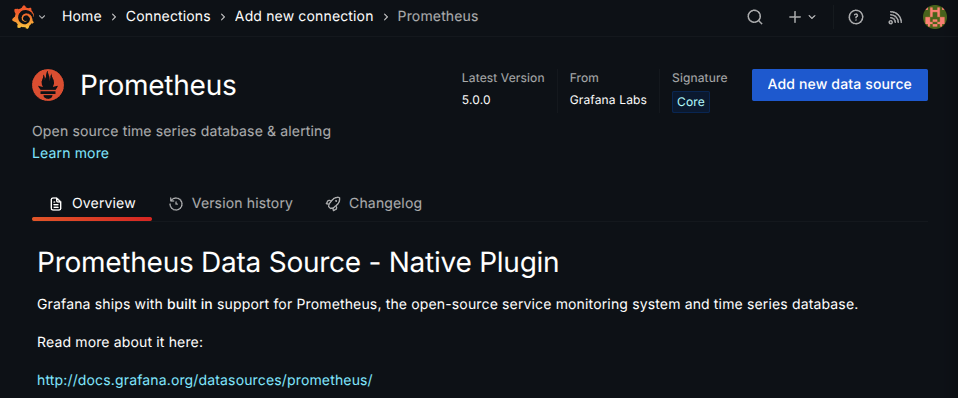
Add Prometheus as DataSource in Grafana
Go to Grafana Dashboard.
Click Data Sources under Connections.
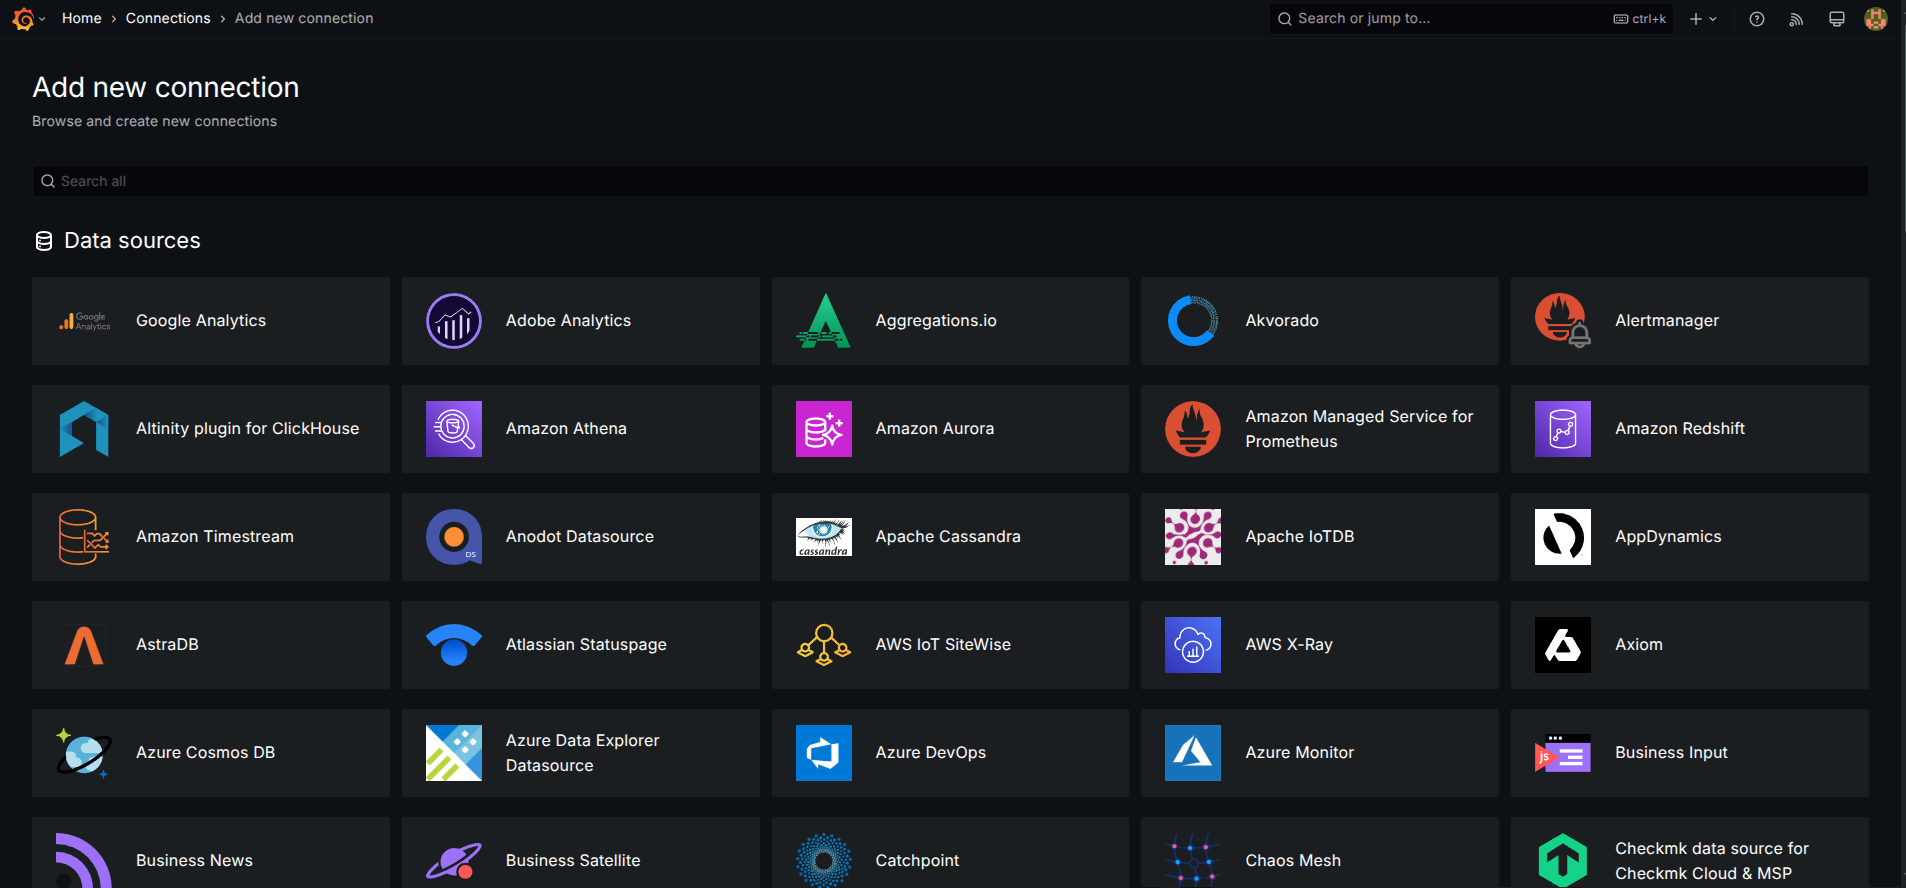
Search and select Prometheus.
Add a new data source and enter the Prometheus server URL.
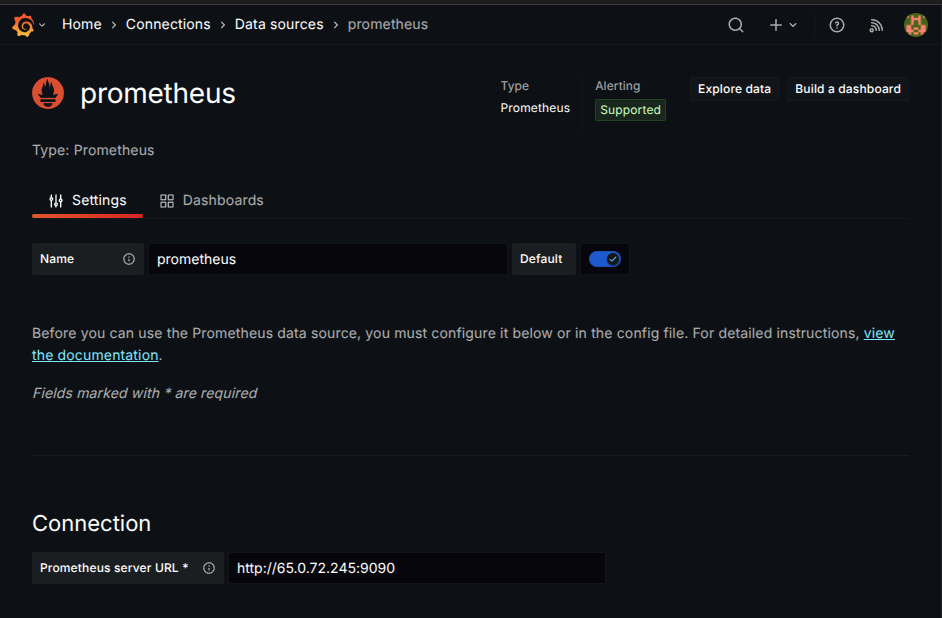
Click Save & Test.
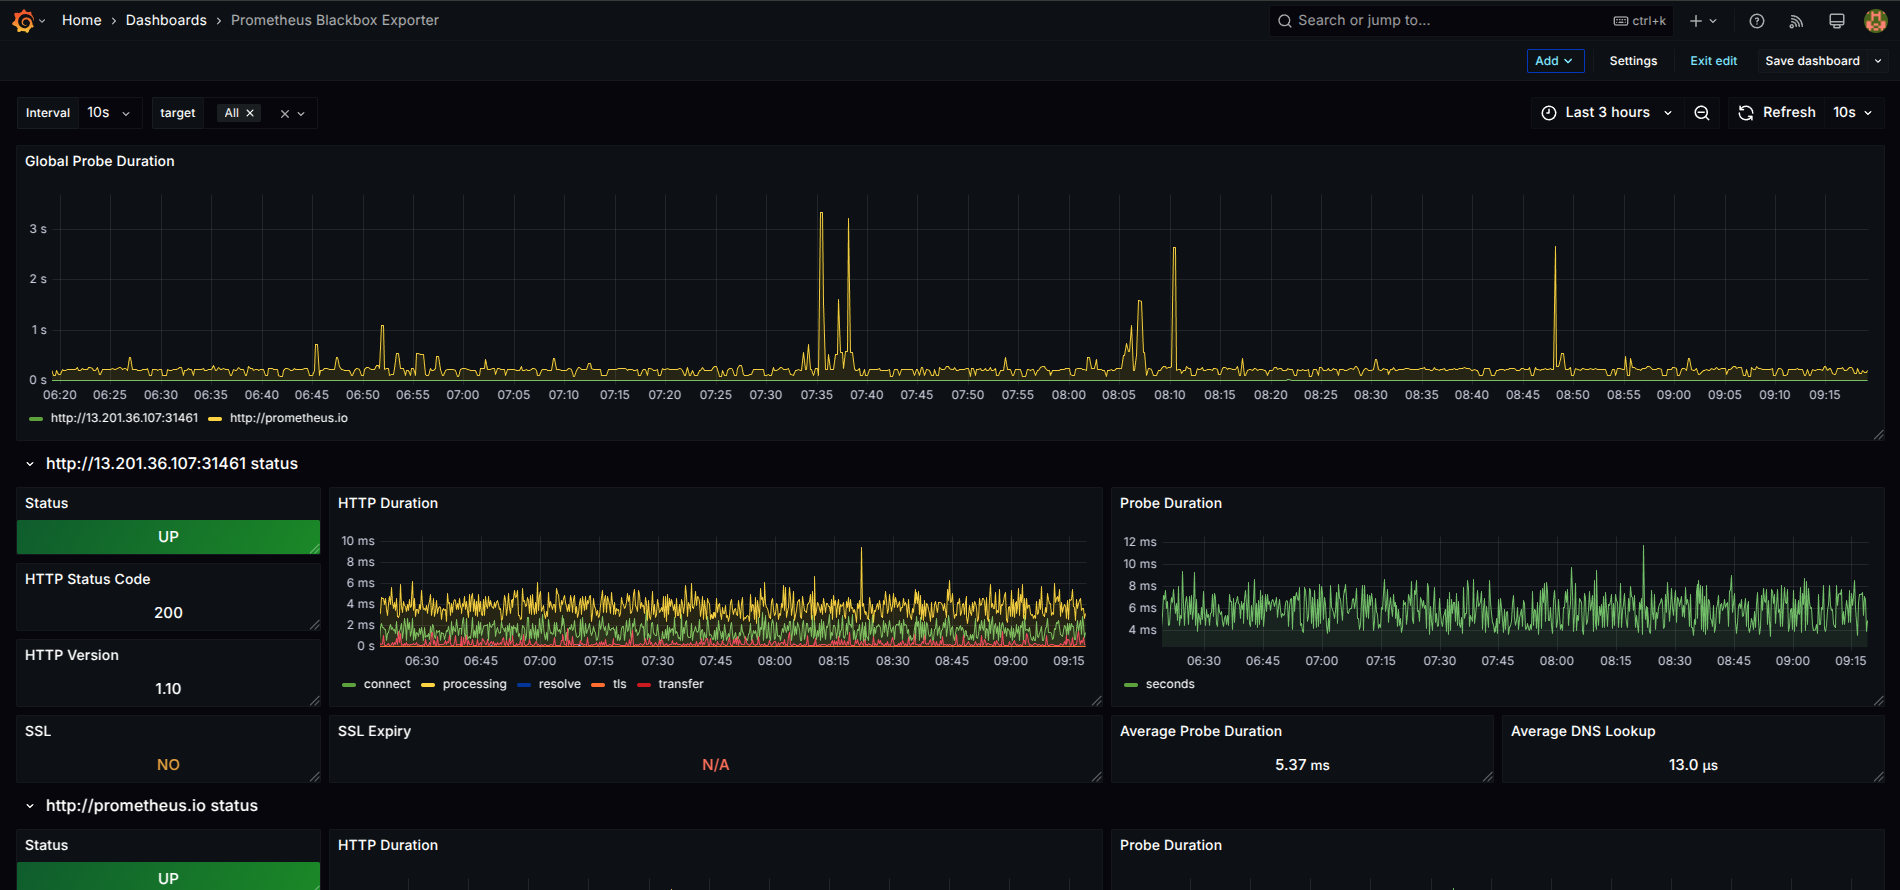
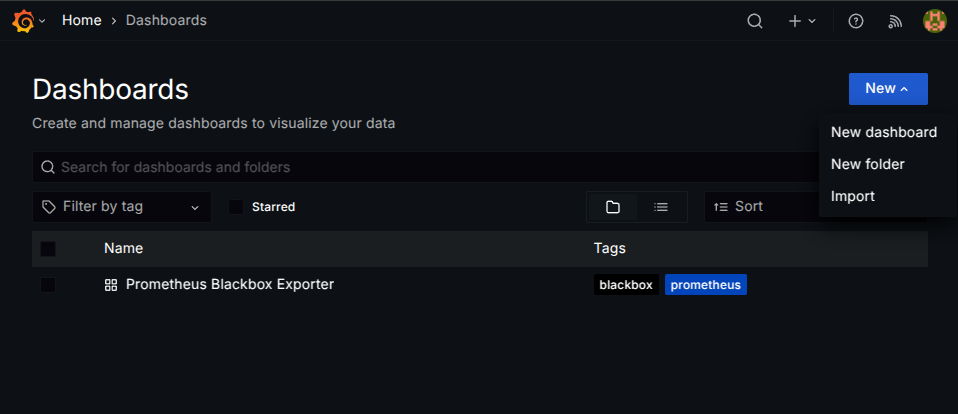
Import Grafana Dashboard
Go to Grafana Home Page.
Click + (Add) → Import Dashboard.
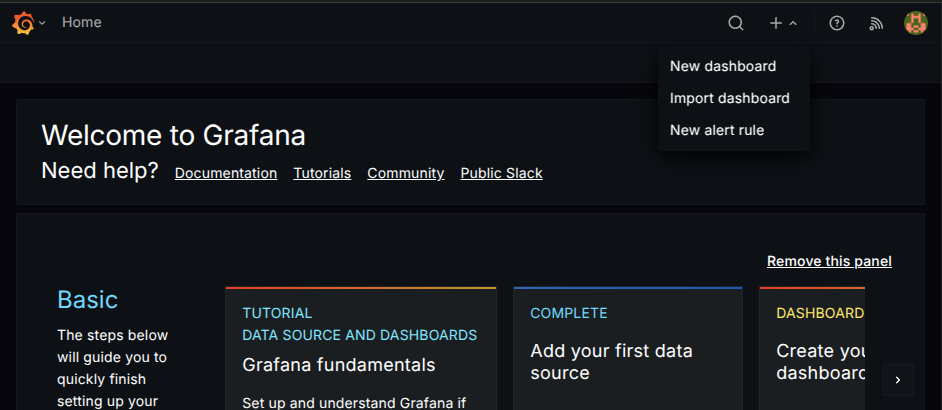
Enter 7587 as the dashboard ID and click Load.
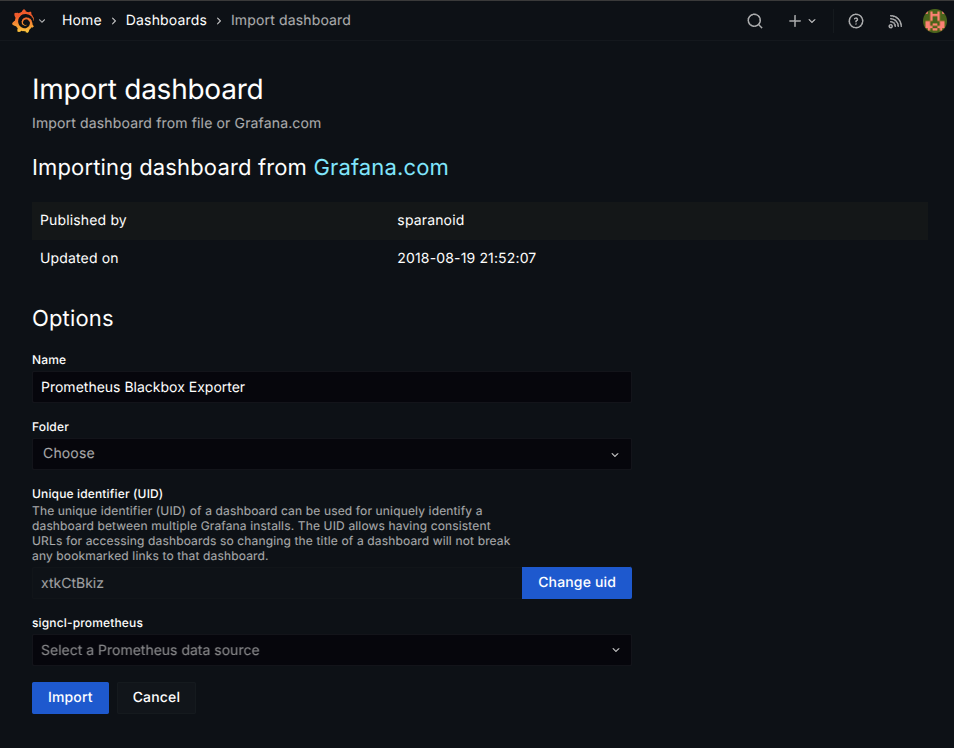
Select Prometheus as the data source and click Import.
Install Prometheus Plugin on Jenkins
Go to Jenkins Dashboard → Manage Jenkins → Plugins.
Search for Prometheus and install it.
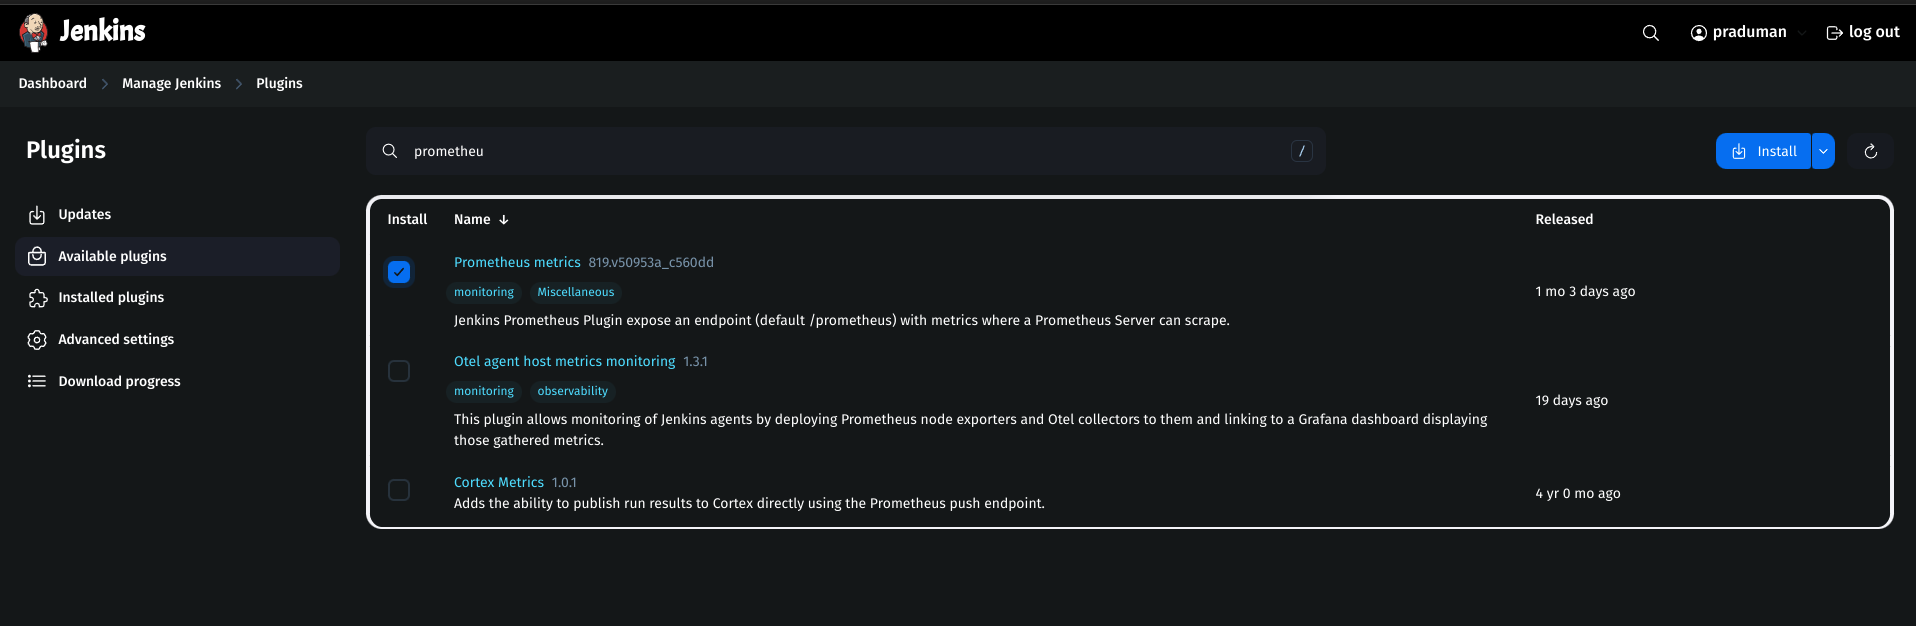
Restart Jenkins.
Install Node Exporter on Monitoring Server
Download Node Exporter:
wget https://github.com/prometheus/node_exporter/releases/download/v1.9.0/node_exporter-1.9.0.linux-amd64.tar.gz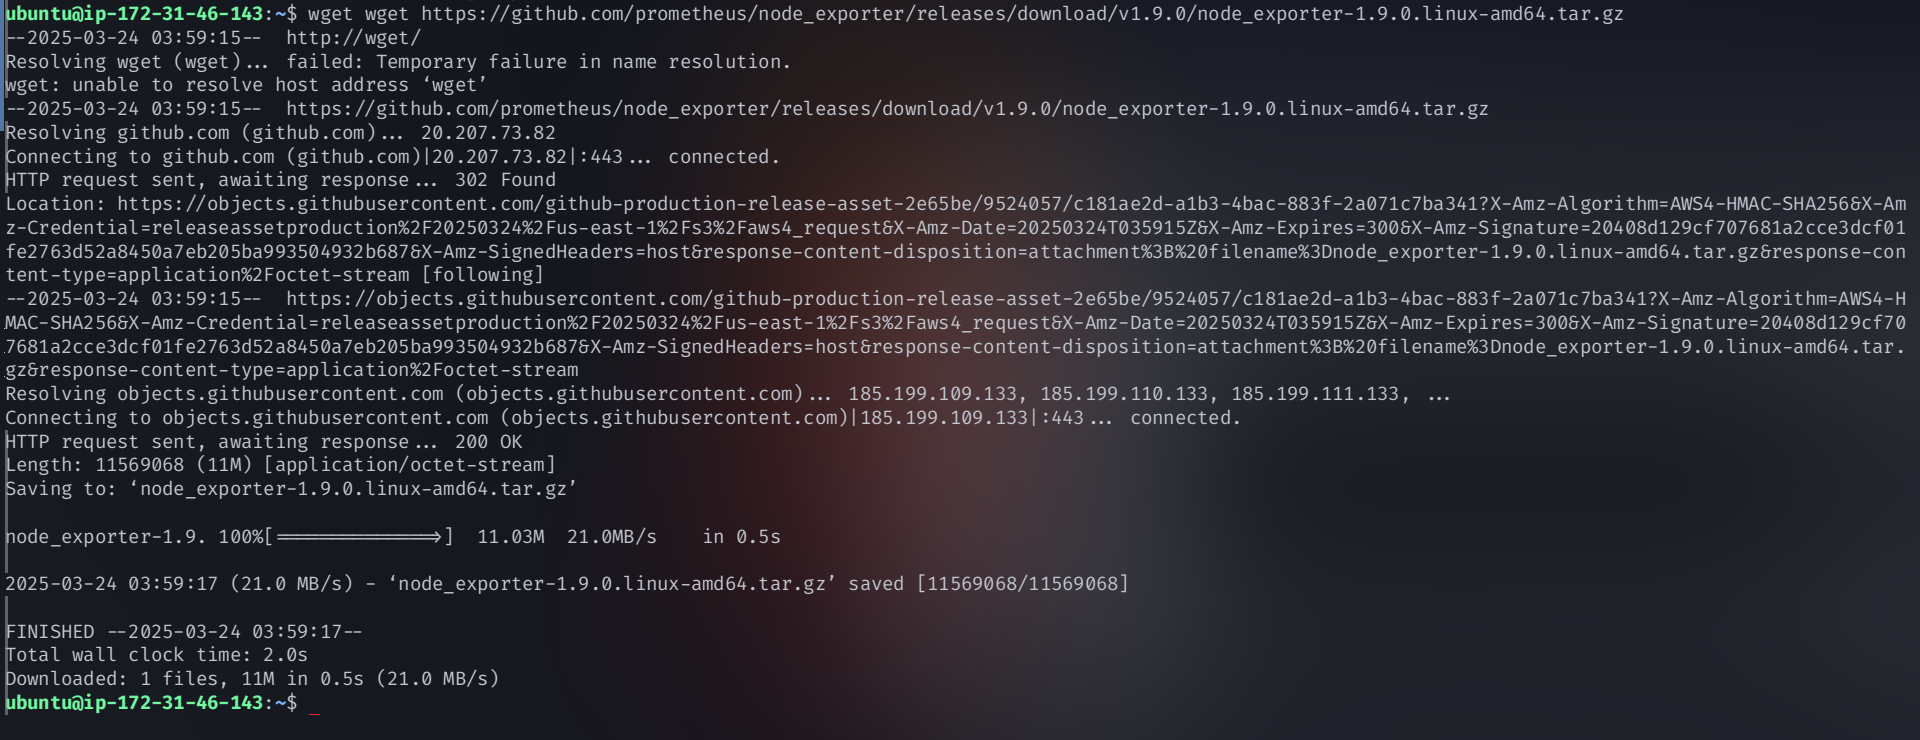
Extract the tar file:
tar -xvf node_exporter-1.9.0.linux-amd64.tar.gz
Navigate to the directory:
cd node_exporter-1.9.0.linux-amd64/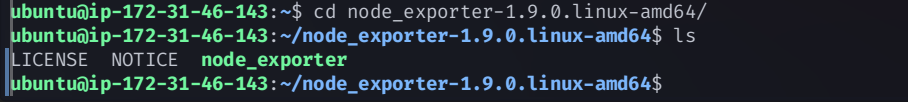
Run Node Exporter:
./node_exporter &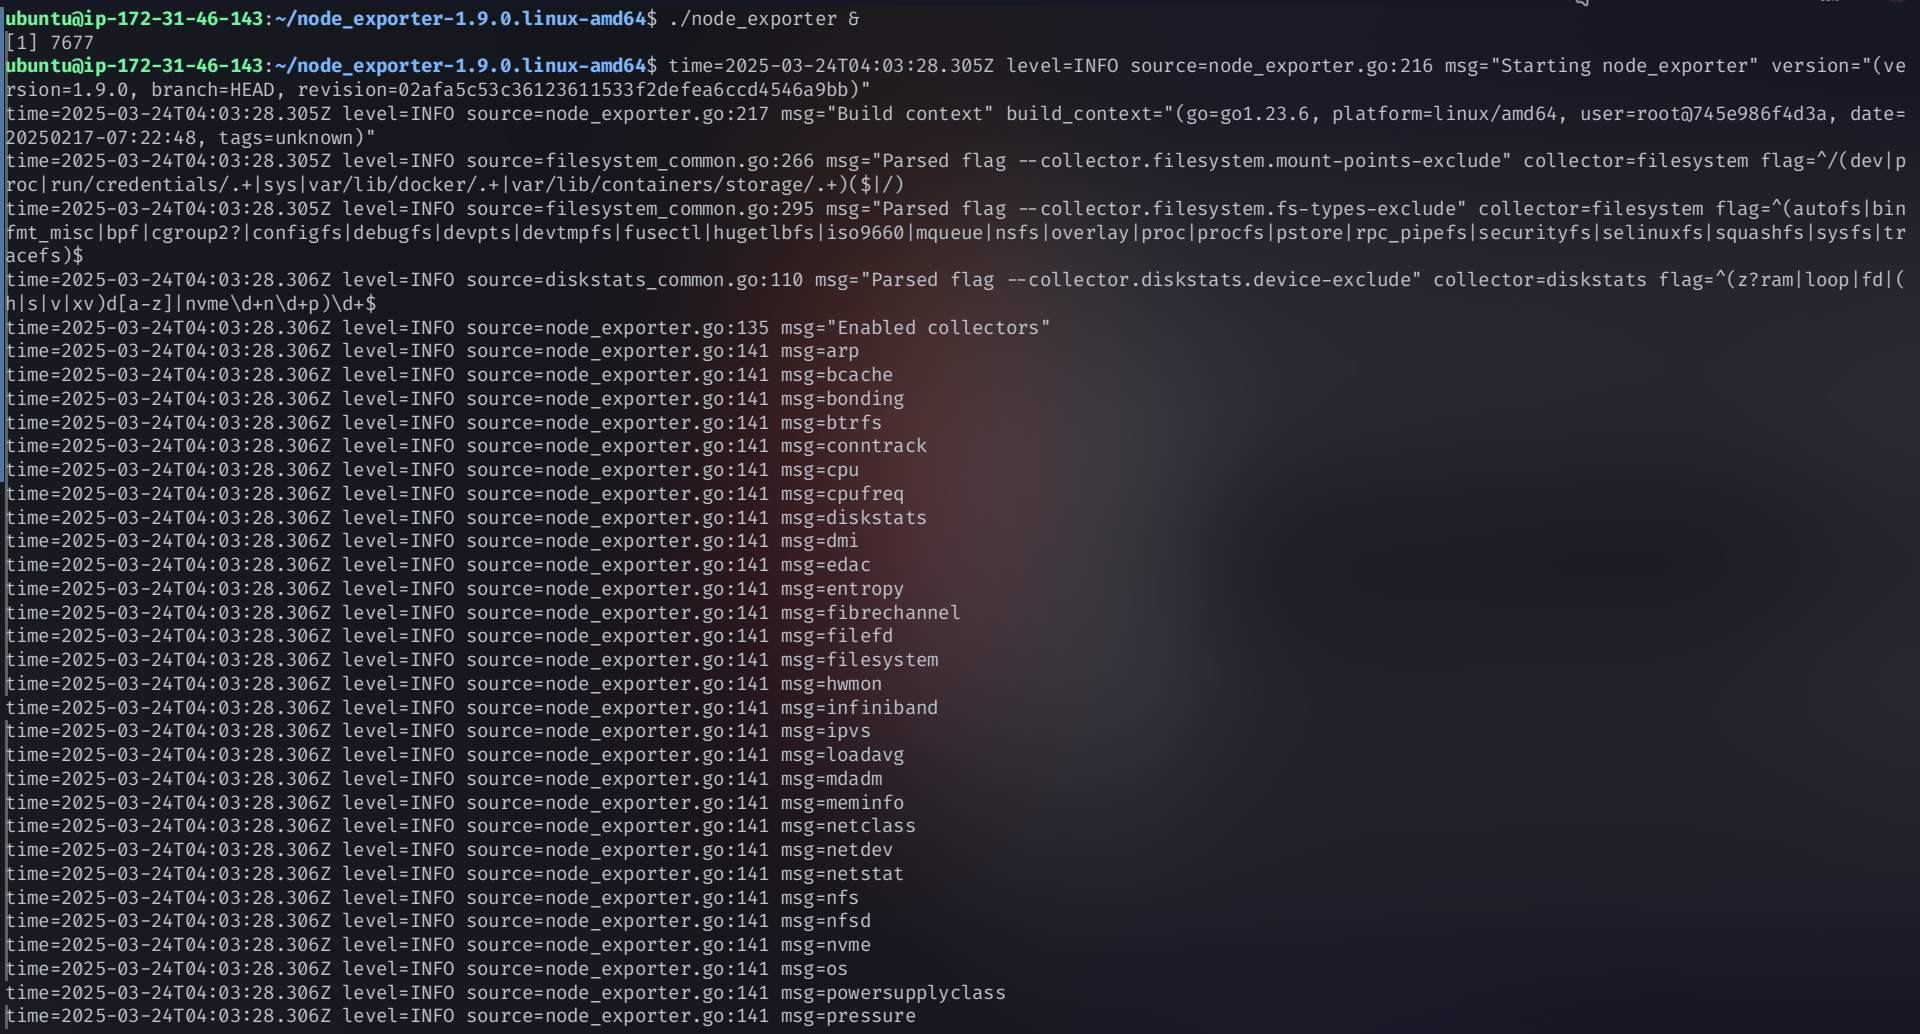
Access at:
http://<public-IP-of-monitoring-server>:9100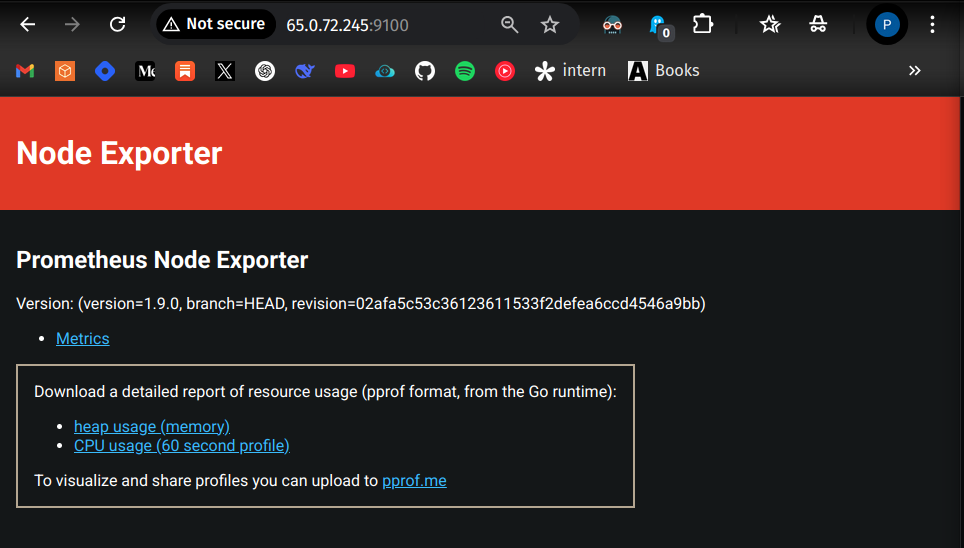
Configure Prometheus for Jenkins
Go to Jenkins Dashboard → Manage Jenkins → System
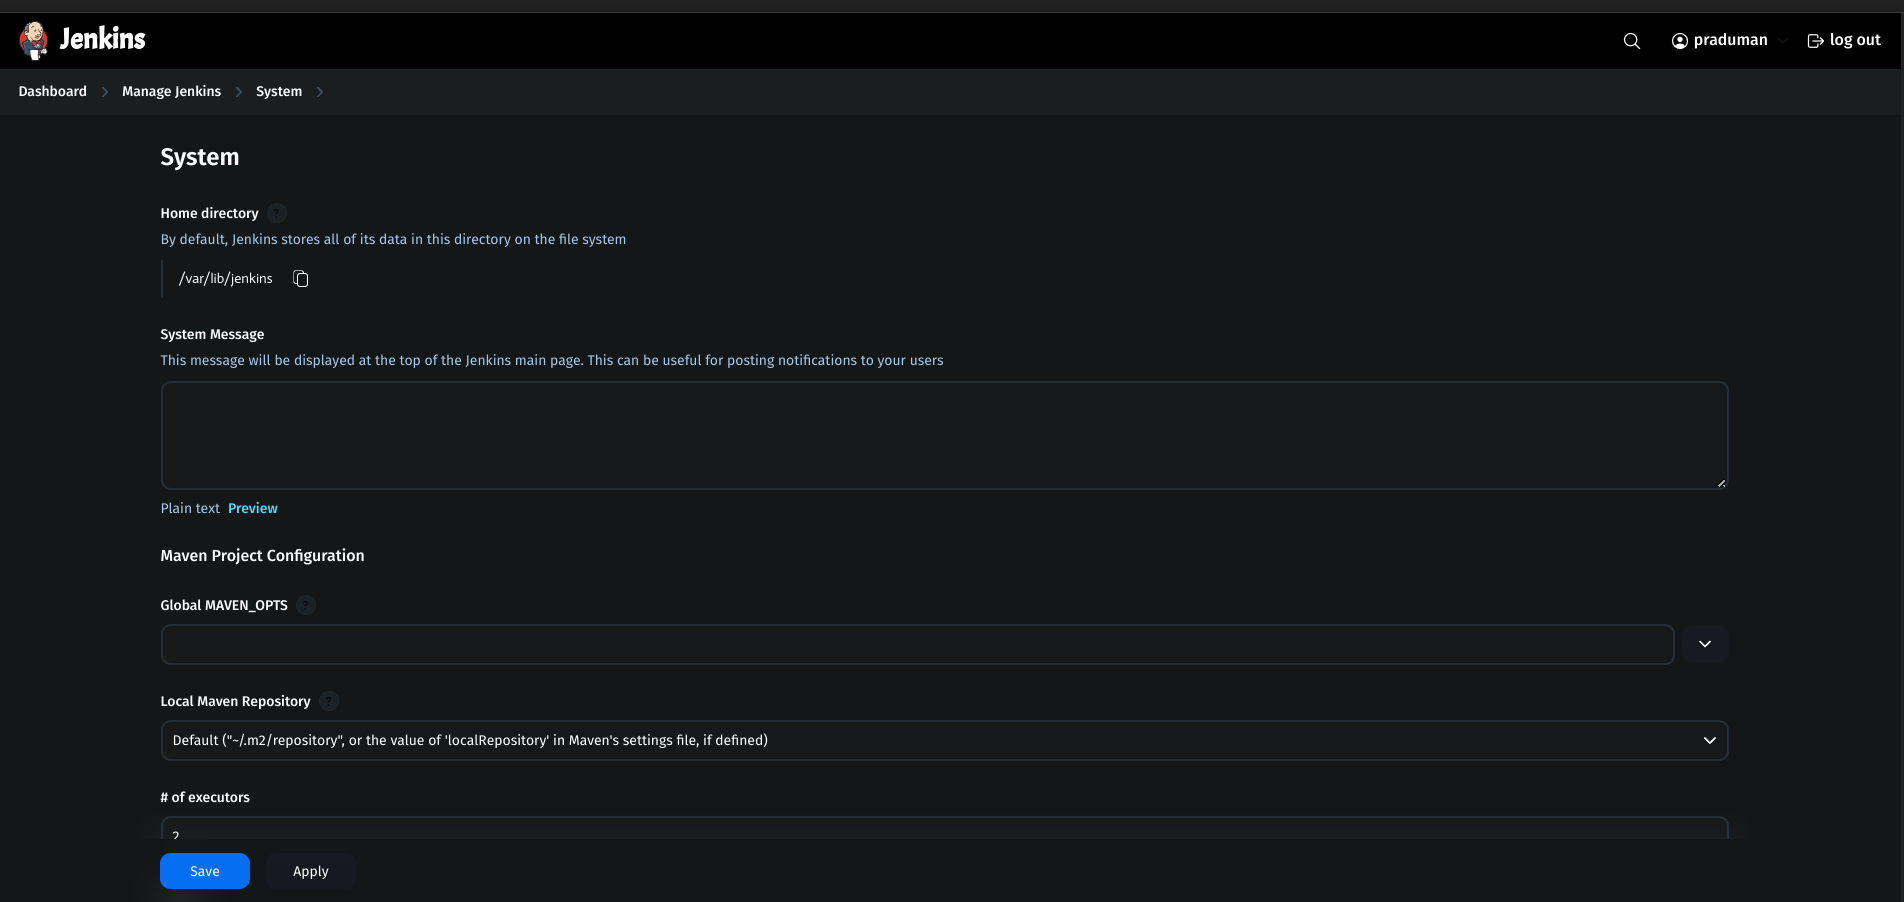
search for prometheus section
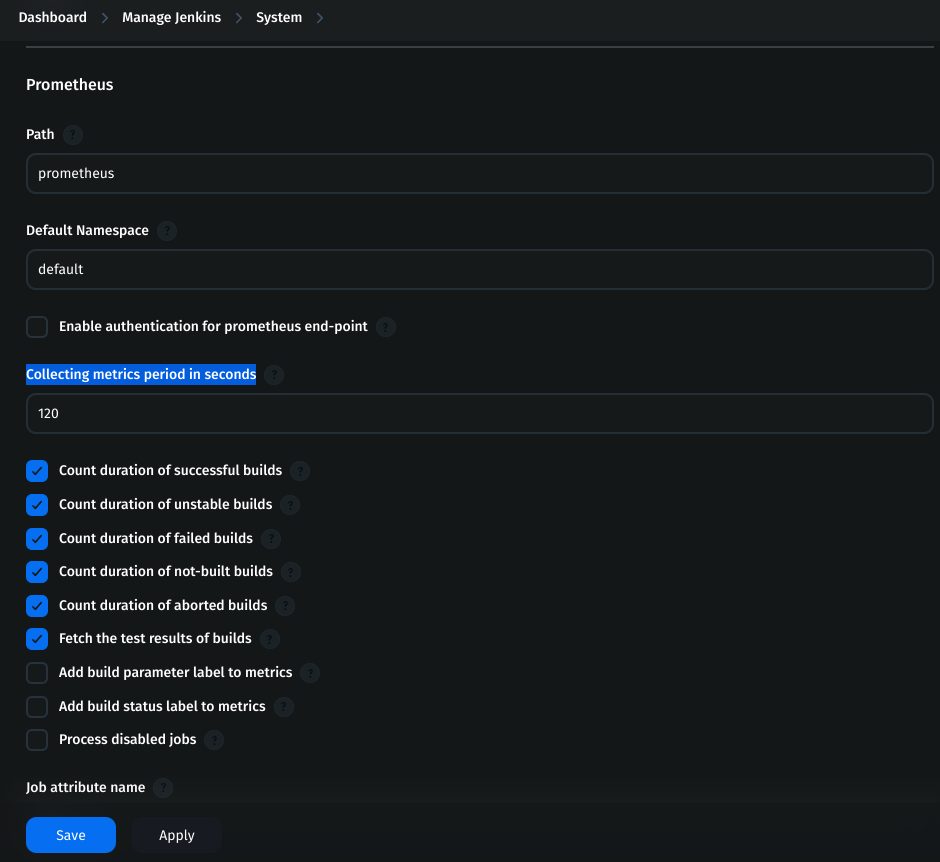
Check if other things required or leave it default and save it
Edit the prometheus.yml file in monitoring server
Edit
prometheus.yml:vim prometheus.ymlAdd the following jobs:
 - job_name: node
   static_configs:
     - targets: ['<jenkins-public-IP>:9100']
 - job_name: jenkins
   metrics_path: '/prometheus'
   static_configs:
     - targets: ['<jenkins-public-IP>:8080']
Restart Prometheus:
pgrep prometheuskill <PID>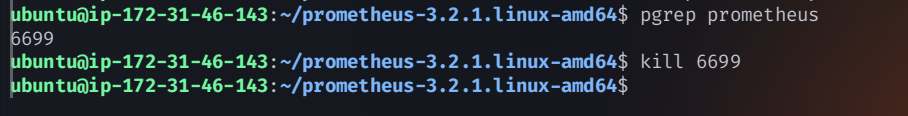
./prometheus &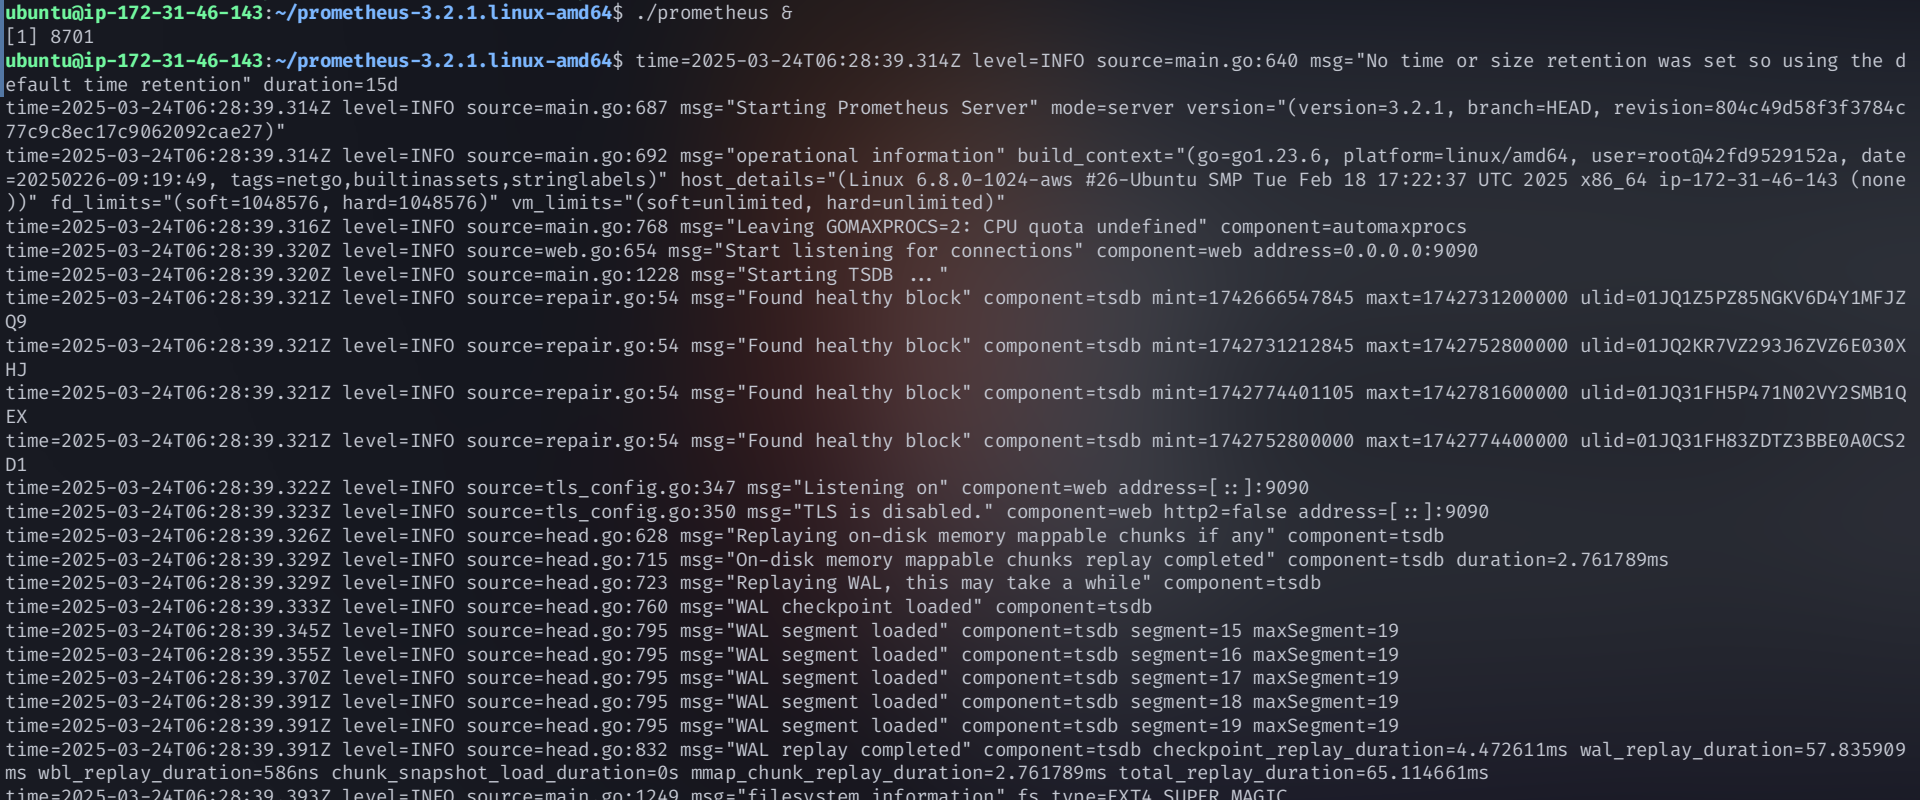
Verify in Prometheus → Status → Target Health.
Import Node Exporter Dashboard in Grafana
Go to Grafana Dashboard → Import.
Enter ID: 1860 and click Load.
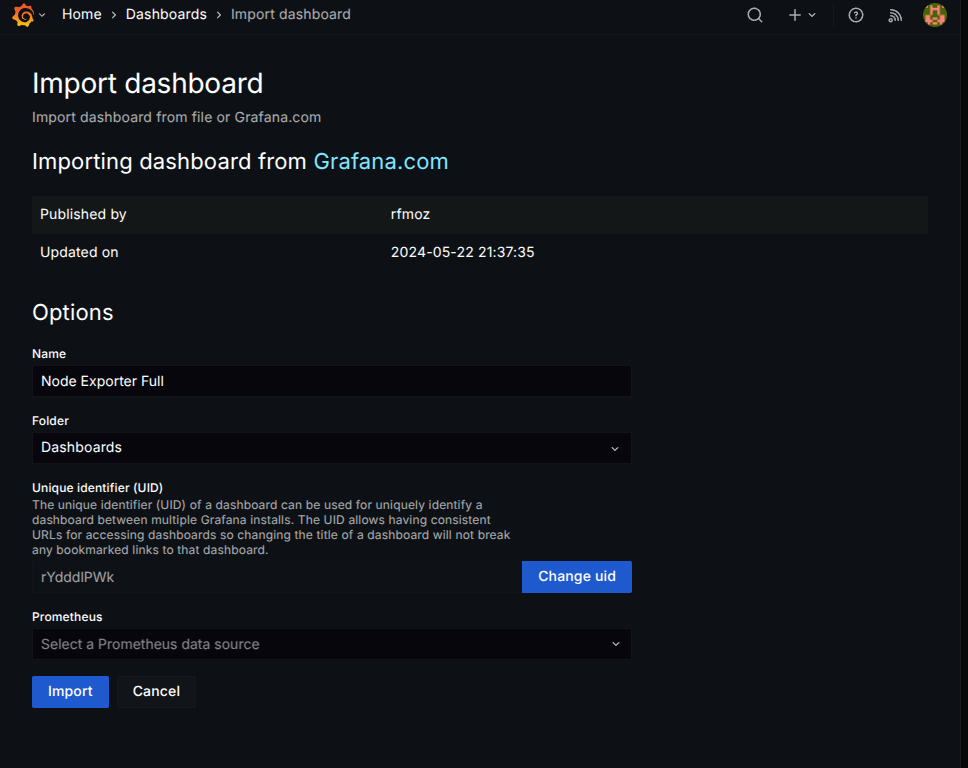
Select Prometheus as the data source and import.
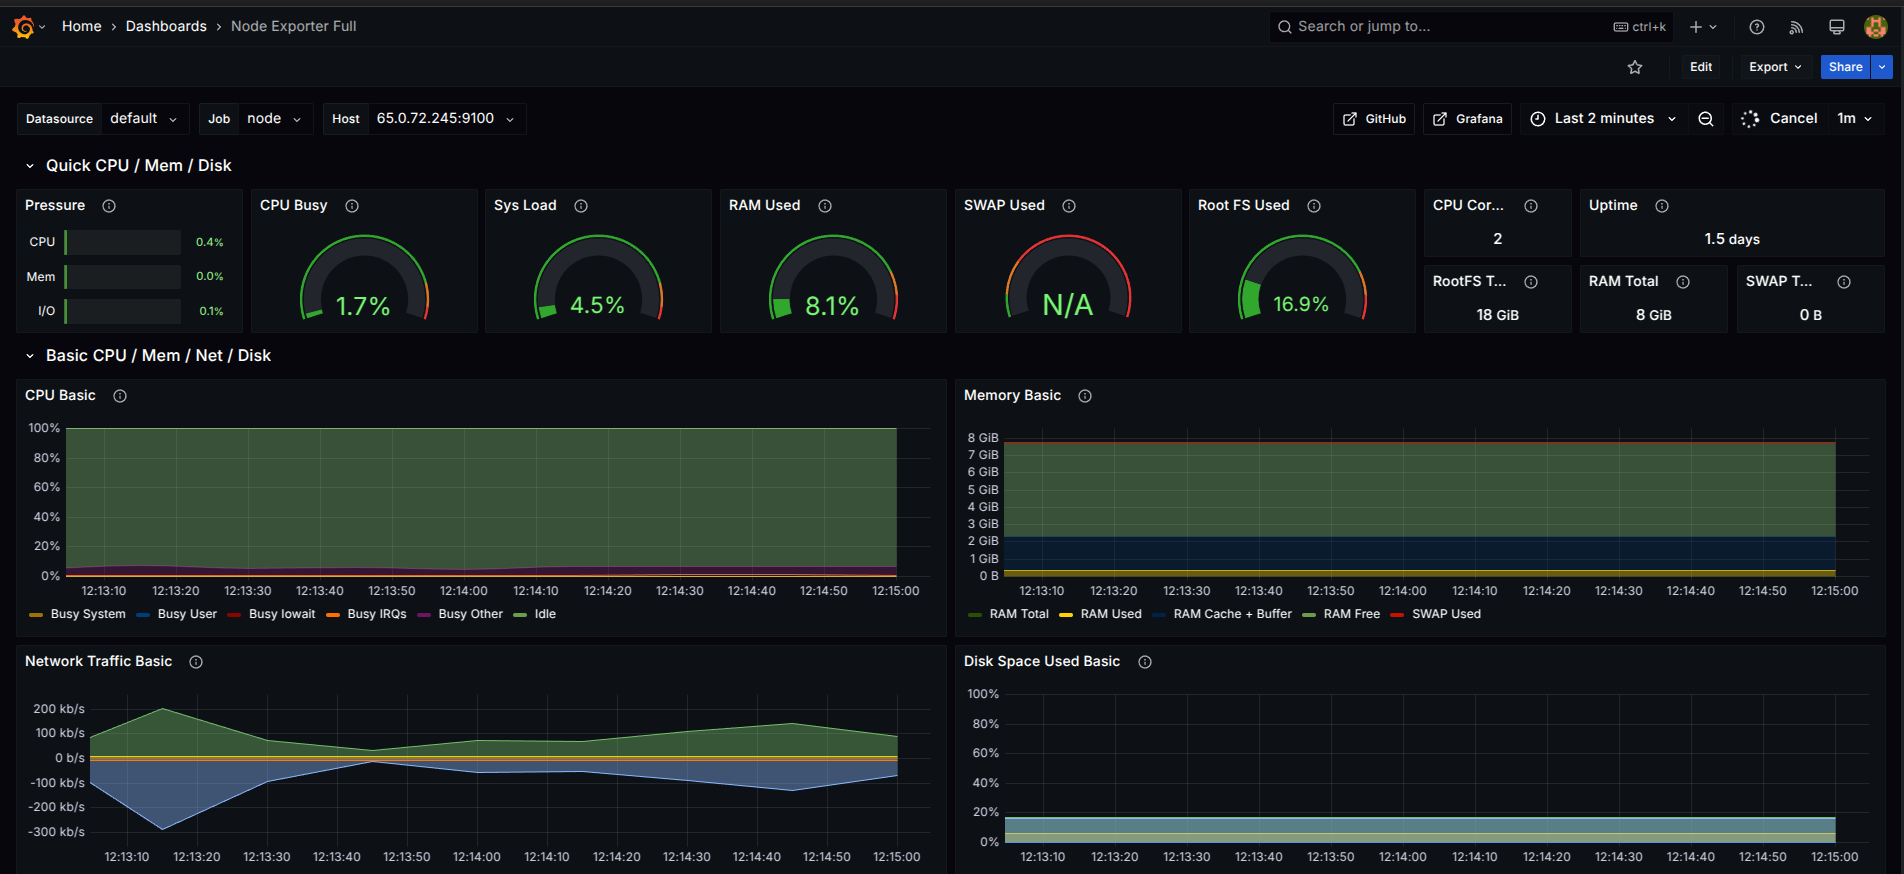
Monitoring setup with Prometheus, Grafana, and Jenkins is now complete! 🚀
Enjoyed the post? to support my writing!
Conclusion
This project covered the complete setup of a DevSecOps pipeline, from infrastructure provisioning to CI/CD automation, security, and monitoring. We deployed a Kubernetes cluster on AWS, automated deployments using Jenkins, Terraform, and ArgoCD, and integrated security tools like Trivy and SonarQube. For monitoring, we set up Prometheus and Grafana along with Node Exporter and Blackbox Exporter. By combining these tools, we built a secure, automated, and scalable environment that ensures smooth deployments, security compliance, and real-time monitoring.
💡 Let’s connect and discuss DevOps, cloud automation, and cutting-edge technology
Subscribe to my newsletter
Read articles from Praduman Prajapati directly inside your inbox. Subscribe to the newsletter, and don't miss out.
Written by
Praduman Prajapati
Praduman Prajapati
👋 Hi, I’m Praduman Prajapati — a DevOps Engineer with hands-on experience in building production-grade CI/CD pipelines, containerized applications, and scalable, secure, and automated cloud infrastructure. I’ve work on multiple real-world projects including: • Automated CI/CD pipelines using Jenkins, GitHub Actions, and ArgoCD • Kubernetes cluster provisioning and deployment on AWS (EKS and kubeadm) • Containerization and orchestration with Docker and Kubernetes • Infrastructure provisioning and automation using Terraform and Ansible • DevSecOps implementations with Trivy, SonarQube, OWASP, Prometheus, and Grafana • Production-grade deployments of applications on cloud infrastructure