Exploring Multi-Label Classification with the Airline Sentiment Dataset
 Mohamad Mahmood
This post continues from the previous one on Twitter text classification. Specifically, we will discuss multi-label classification using the Airline Sentiment dataset.
Multi-label classification is a type of machine learning task where each instance (or data point) can belong to multiple classes simultaneously, rather than being restricted to a single class. This approach is particularly useful in scenarios where categories are not mutually exclusive, such as in text categorization, image tagging, or sentiment analysis.
In the airline industry, multi-label classification can be applied to categorize customer feedback or reviews. For instance, a single customer comment could include various aspects of their experience, leading to multiple labels being assigned.
Example: A review might state, “The crew was friendly, but my flight was delayed and I had issues with my booking.”
From this comment, the following labels could be assigned:
Flight (referring to the overall experience with the flight)
Customer (indicating it’s a customer feedback)
Delay (highlighting the delay in the flight)
Crew (noting the positive mention of the crew)
Booking (pointing to issues with the booking process)
[1] Prep Multi Label Airline Sentiment Dataset
[a] Set the pandas column width
import pandas as pd

# Set the maximum column width to None
pd.set_option('display.max_colwidth', None)
[b] Get the dataset
import pandas as pd

dset_url='https://archive.org/download/misc-dataset/airline-tweets.csv'

df_airline=pd.read_csv(dset_url)

df_airline.info()
[c] Create a copy of the dataset
df_dset=df_airline[['text']].copy()
df_dset
[d] Clean the dataset
Get dependencies
!pip install neattext
# import text cleaning packages
import neattext.functions as nfx
Run the cleaning task
import neattext.functions as nfx
df_dset['clean'] = df_dset['text'] \
.apply(nfx.remove_urls) \
.apply(nfx.remove_userhandles) \
.apply(nfx.remove_numbers) \
.apply(nfx.fix_contractions) \
.apply(nfx.remove_punctuations) \
.apply(nfx.remove_hashtags) \
.apply(nfx.remove_stopwords) \
.apply(str.lower)
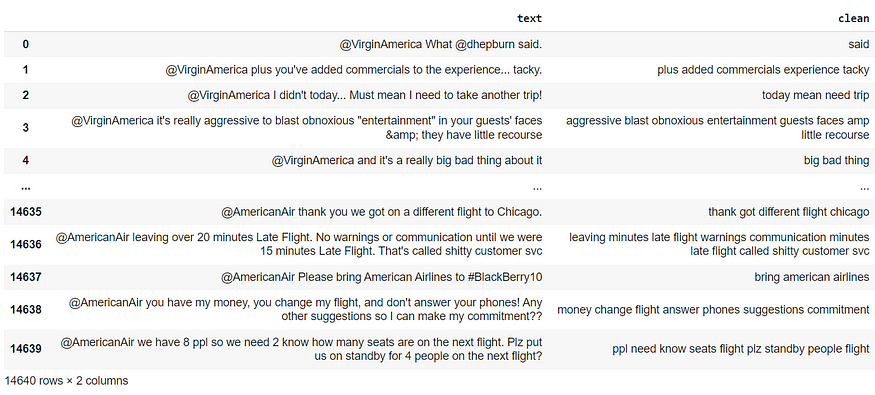
df_dset[['text','clean']]
Output:
[e] Assign labels to the clean text
Set the keyword:
set_keyword={'flight','customer','cancel','delay','crew','booking'}
Run the labeling task:
# Function to find keywords in the text
def find_keywords(text):
    return [word for word in set_keyword if word.lower() in text.lower()]

# Apply the function and create the label column
df_dset['label'] = df_dset['clean'].apply(find_keywords)

df_dset['label_count']=df_dset['label'].apply(len)

df_dset
[f] Filter for multilabel documents only
# filter for multilabel records only
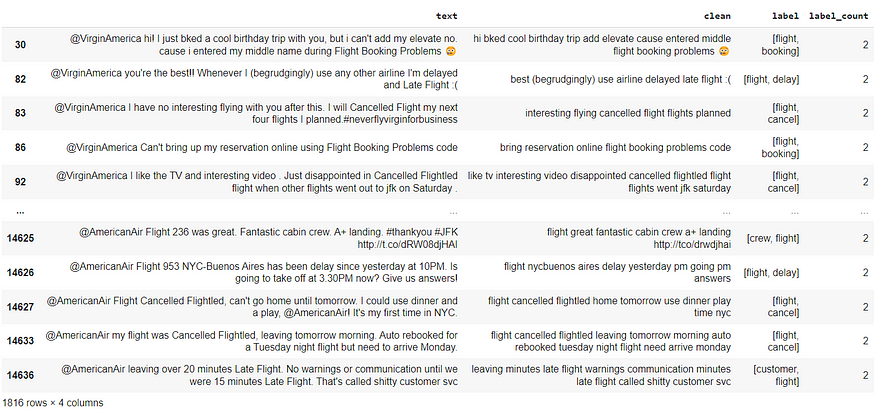
df_dset = df_dset[df_dset['label_count']>1].copy()
df_dset
Outcome:
[g] Analyze label distribution
import pandas as pd
import matplotlib.pyplot as plt
from collections import Counter


# Step 1: Flatten the list of labels
all_labels = [label for sublist in df_dset['label'] for label in sublist]

# Step 2: Count occurrences of each label
label_counts = Counter(all_labels)

# Step 3: Create a visualization
plt.figure(figsize=(10, 6))
plt.bar(label_counts.keys(), label_counts.values(), color='skyblue')
plt.title('Label Distribution')
plt.xlabel('Labels')
plt.ylabel('Frequency')
plt.xticks(rotation=45)
plt.tight_layout()
plt.show()
Outcome:
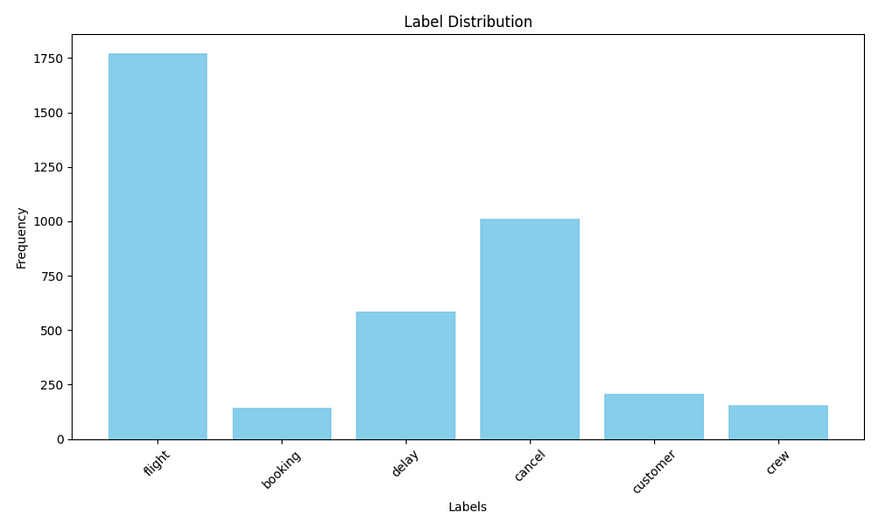
Observation:
Dominance of ‘Flight’ Label:
- The ‘flight’ label significantly outnumbers other labels, with the highest frequency observed (over 1,750 occurrences). This indicates that the majority of the data points are classified under this label, suggesting it may be a primary focus of the dataset.
Moderate Frequencies for Other Labels:
The ‘cancel’ label also has a notable presence, with a frequency exceeding 500. This suggests that cancellations are another common scenario in the dataset.
Labels like ‘delay’ and ‘booking’ have frequencies that are moderate but much lesser than ‘flight’ and ‘cancel’. This may indicate various operational scenarios being captured, though they are less frequent.
Low Occurrences of ‘Customer’ and ‘Crew’ Labels:
- Both ‘customer’ and ‘crew’ labels exhibit low frequencies, with counts below 500. This may reflect that the events related to these labels are less common, or they might not be as impactful in the context of the data being analyzed.
Skewed Distribution:
- The distribution is clearly skewed, with ‘flight’ being the outlier. This skewness may affect how well models trained on this data can generalize to unseen instances, particularly for the lesser-represented classes. It could be essential to consider techniques like oversampling or undersampling if you plan to build a predictive model.
[2] Multi-label Classification
[a] Import packages
import pandas as pd
import numpy as np
import re
import string
from sklearn.model_selection import train_test_split
from sklearn.feature_extraction.text import TfidfVectorizer
from sklearn.preprocessing import MultiLabelBinarizer
from sklearn.multiclass import OneVsRestClassifier
from sklearn.ensemble import RandomForestClassifier, GradientBoostingClassifier
from sklearn.linear_model import LogisticRegression
from sklearn.neighbors import KNeighborsClassifier
from sklearn.metrics import classification_report
[b] Encode the labels
# Encode labels
mlb = MultiLabelBinarizer()
y = mlb.fit_transform(df_dset['label'])
[c] Vectorize the clean text
# Convert text to TF-IDF
vectorizer = TfidfVectorizer(max_features=5000)
X = vectorizer.fit_transform(df_dset['clean'].fillna(""))
[d] Split the dataset
# Train-Test Split
X_train, X_test, y_train, y_test = train_test_split(X, y, test_size=0.2, random_state=42)
[e] Define training models
# Train Models
models = {
    "Random Forest": OneVsRestClassifier(RandomForestClassifier(n_estimators=200, random_state=42)),
    "Logistic Regression": OneVsRestClassifier(LogisticRegression(max_iter=1000)),
    "KNN": OneVsRestClassifier(KNeighborsClassifier(n_neighbors=5)),
    "Gradient Boosting": OneVsRestClassifier(GradientBoostingClassifier(n_estimators=100))
}
[f] Train and evaluate
# Train and evaluate
for model_name, model in models.items():
    model.fit(X_train, y_train)
    y_pred = model.predict(X_test)
    print(f"Classification Report for {model_name}:\n")
    print(classification_report(y_test, y_pred, target_names=mlb.classes_, zero_division=0))
Output:
Classification Report for Random Forest:

              precision    recall  f1-score   support

     booking       1.00      0.96      0.98        26
      cancel       1.00      1.00      1.00       220
        crew       1.00      0.88      0.93        32
    customer       1.00      1.00      1.00        37
       delay       1.00      0.96      0.98       106
      flight       0.98      1.00      0.99       356

   micro avg       0.99      0.99      0.99       777
   macro avg       1.00      0.97      0.98       777
weighted avg       0.99      0.99      0.99       777
 samples avg       0.99      0.99      0.99       777

Classification Report for Logistic Regression:

              precision    recall  f1-score   support

     booking       1.00      0.69      0.82        26
      cancel       1.00      0.99      0.99       220
        crew       1.00      0.25      0.40        32
    customer       1.00      0.65      0.79        37
       delay       1.00      0.89      0.94       106
      flight       0.98      1.00      0.99       356

   micro avg       0.99      0.92      0.95       777
   macro avg       1.00      0.74      0.82       777
weighted avg       0.99      0.92      0.94       777
 samples avg       0.99      0.93      0.95       777

Classification Report for KNN:

              precision    recall  f1-score   support

     booking       1.00      0.54      0.70        26
      cancel       0.82      0.89      0.85       220
        crew       1.00      0.38      0.55        32
    customer       0.94      0.46      0.62        37
       delay       0.73      0.60      0.66       106
      flight       0.98      1.00      0.99       356

   micro avg       0.90      0.85      0.87       777
   macro avg       0.91      0.64      0.73       777
weighted avg       0.90      0.85      0.86       777
 samples avg       0.90      0.86      0.87       777

Classification Report for Gradient Boosting:

              precision    recall  f1-score   support

     booking       1.00      1.00      1.00        26
      cancel       1.00      1.00      1.00       220
        crew       1.00      0.97      0.98        32
    customer       1.00      1.00      1.00        37
       delay       1.00      0.96      0.98       106
      flight       0.98      1.00      0.99       356

   micro avg       0.99      0.99      0.99       777
   macro avg       1.00      0.99      0.99       777
weighted avg       0.99      0.99      0.99       777
 samples avg       0.99      0.99      0.99       777
Note:
Precision: Refers to the accuracy of the retrieved information. It indicates how precise the model’s positive predictions are-essentially measuring the correctness of the results it returns. The term emphasizes the focus on correct results among the retrieved ones. How many were correct out of the total predicted positives?
Recall*: Refers to the ability to retrieve all relevant items. It measures how well the model captures all actual positive instances. The term emphasizes the model’s ability to “recall” or retrieve all relevant cases from the dataset.* How many did we miss out of the total actual positives?
F1 Score*: provides a single score that reflects both the accuracy of positive predictions (precision) and the completeness in identifying actual positives (recall).*
Evaluation of Classification Reports
The classification reports for the Random Forest, Logistic Regression, K-Nearest Neighbors (KNN), and Gradient Boosting models provide insights into their performance across multiple classes. Here’s a detailed analysis of each model’s performance:
1. Random Forest:
Overall Performance:
Micro average: 0.99 precision, 0.99 recall, 0.99 f1-score
Macro average: 1.00 precision, 0.97 recall, 0.98 f1-score
Weighted average: 0.99 for precision, recall, and f1-score
Strengths:
The model achieves perfect precision (1.00) for all classes except ‘flight’, which has 0.98.
Recall scores are very high, particularly for ‘cancel’ and ‘customer’ classes (both 1.00).
Weaknesses:
- While generally strong, the model’s recall for ‘crew’ is a bit lower (0.88).
2. Logistic Regression:
Overall Performance:
Micro average: 0.99 precision, 0.92 recall, 0.95 f1-score
Macro average: 1.00 precision, 0.74 recall, 0.82 f1-score
Weighted average: 0.99 precision, 0.92 recall, 0.94 f1-score
Strengths:
Achieves perfect precision for all classes, indicating no false positives.
High recall for ‘cancel’ (0.99) and ‘flight’ (1.00).
Weaknesses:
Low recall for ‘crew’ (0.25) and ‘customer’ (0.65) points to issues in identifying these classes correctly.
Lower overall performance reflected in lower f1-scores compared to Random Forest.
3. K-Nearest Neighbors (KNN):
Overall Performance:
Micro average: 0.90 precision, 0.85 recall, 0.87 f1-score
Macro average: 0.91 precision, 0.64 recall, 0.73 f1-score
Weighted average: 0.90 precision, 0.85 recall, 0.86 f1-score
Strengths:
- High precision for ‘booking’ (1.00) and ‘flight’ (0.98).
Weaknesses:
Overall poor performance with a micro average f1-score of 0.87.
Significant recall issues, particularly for ‘crew’ (0.38) and ‘customer’ (0.46), leading to low f1-scores.
4. Gradient Boosting:
Overall Performance:
Micro average: 0.99 precision, 0.99 recall, 0.99 f1-score
Macro average: 1.00 precision, 0.99 recall, 0.99 f1-score
Weighted average: 0.99 precision, recall, and f1-score
Strengths:
Perfect precision (1.00) across all classes.
Very high recall across the board, particularly for ‘cancel’ and ‘customer’ (1.00).
Weaknesses:
- Similar to Random Forest, ‘crew’ has a slightly lower recall (0.97). However, it still performs well overall.
Summary:
Best Performing Model: Both Random Forest and Gradient Boosting exhibit excellent overall performance with high precision and recall, making them suitable for multilabel classification tasks in this context.
Mid-Range Model: Logistic Regression performs decently but struggles with certain classes, especially ‘crew’ and ‘customer’.
Lowest Performing Model: KNN significantly underperforms across all metrics compared to the other models, suggesting it may not be a good fit for this classification problem.
Colab Notebook:
https://colab.research.google.com/drive/1V3MRAsB2pwfgnVsd2c4cIn50URsBeeRW?usp=sharing
Subscribe to my newsletter
Read articles from Mohamad Mahmood directly inside your inbox. Subscribe to the newsletter, and don't miss out.
Written by
Mohamad Mahmood
Mohamad Mahmood
Mohamad's interest is in Programming (Mobile, Web, Database and Machine Learning). He studies at the Center For Artificial Intelligence Technology (CAIT), Universiti Kebangsaan Malaysia (UKM).