LightningChart .NET v.12.2.1 is out now!
 Omar Urbano | LightningChart
LightningChart .NET is introducing its new version 12.2.1, which focuses on service improvements and chart updates. Here are the improvements in a nutshell:
.NET Target Framework
Now LightningChart .NET is compiled to 8.0. This change ensures native support for the LightningChart control within .NET projects and aligns with Microsoft’s support policy for the .NET framework.
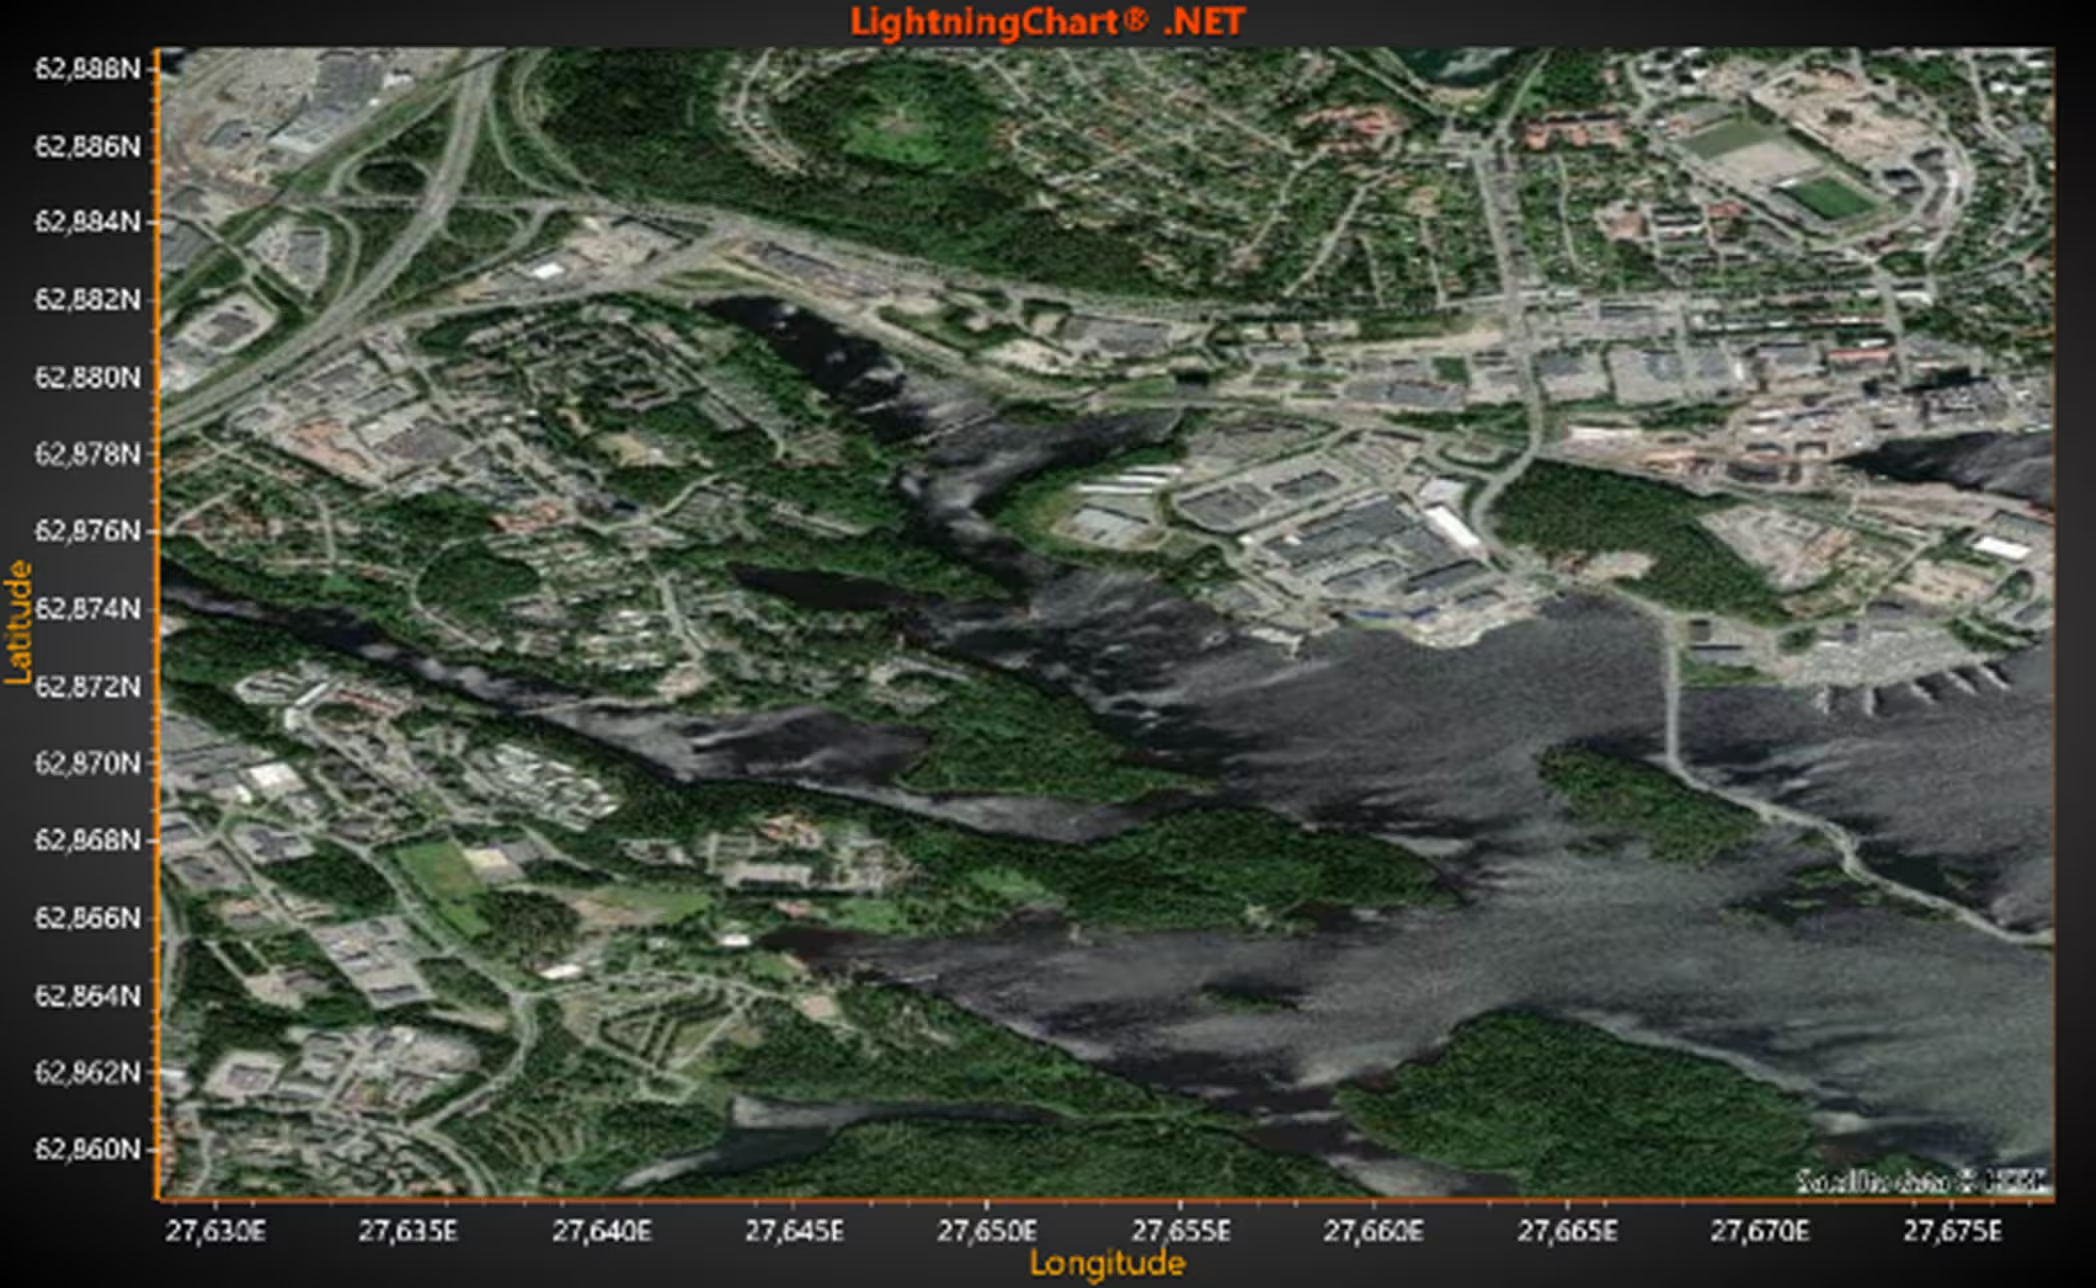
HERE Maps
HERE maps have been updated to use the HERE Raster Tile API v3. We have also included the LayerType option to manipulate options for Street and Satellite, specifically StreetNight, TerrainDay, and TerrainNight maps.
Interactive Examples UI Improvements
We have made several improvements to the UI of the LightningChart .NET Interactive Examples application. This application showcases hundreds of chart examples, code projects, and demos of LightningChart .NET components. Anyone can access the Interactive Examples application by downloading the .NET free trial.
New & Improved Chart Examples
Here are some of the new chart examples we have added or improved:
3D Slicer
Race car telemetry
Volume rendering
Pipe interior
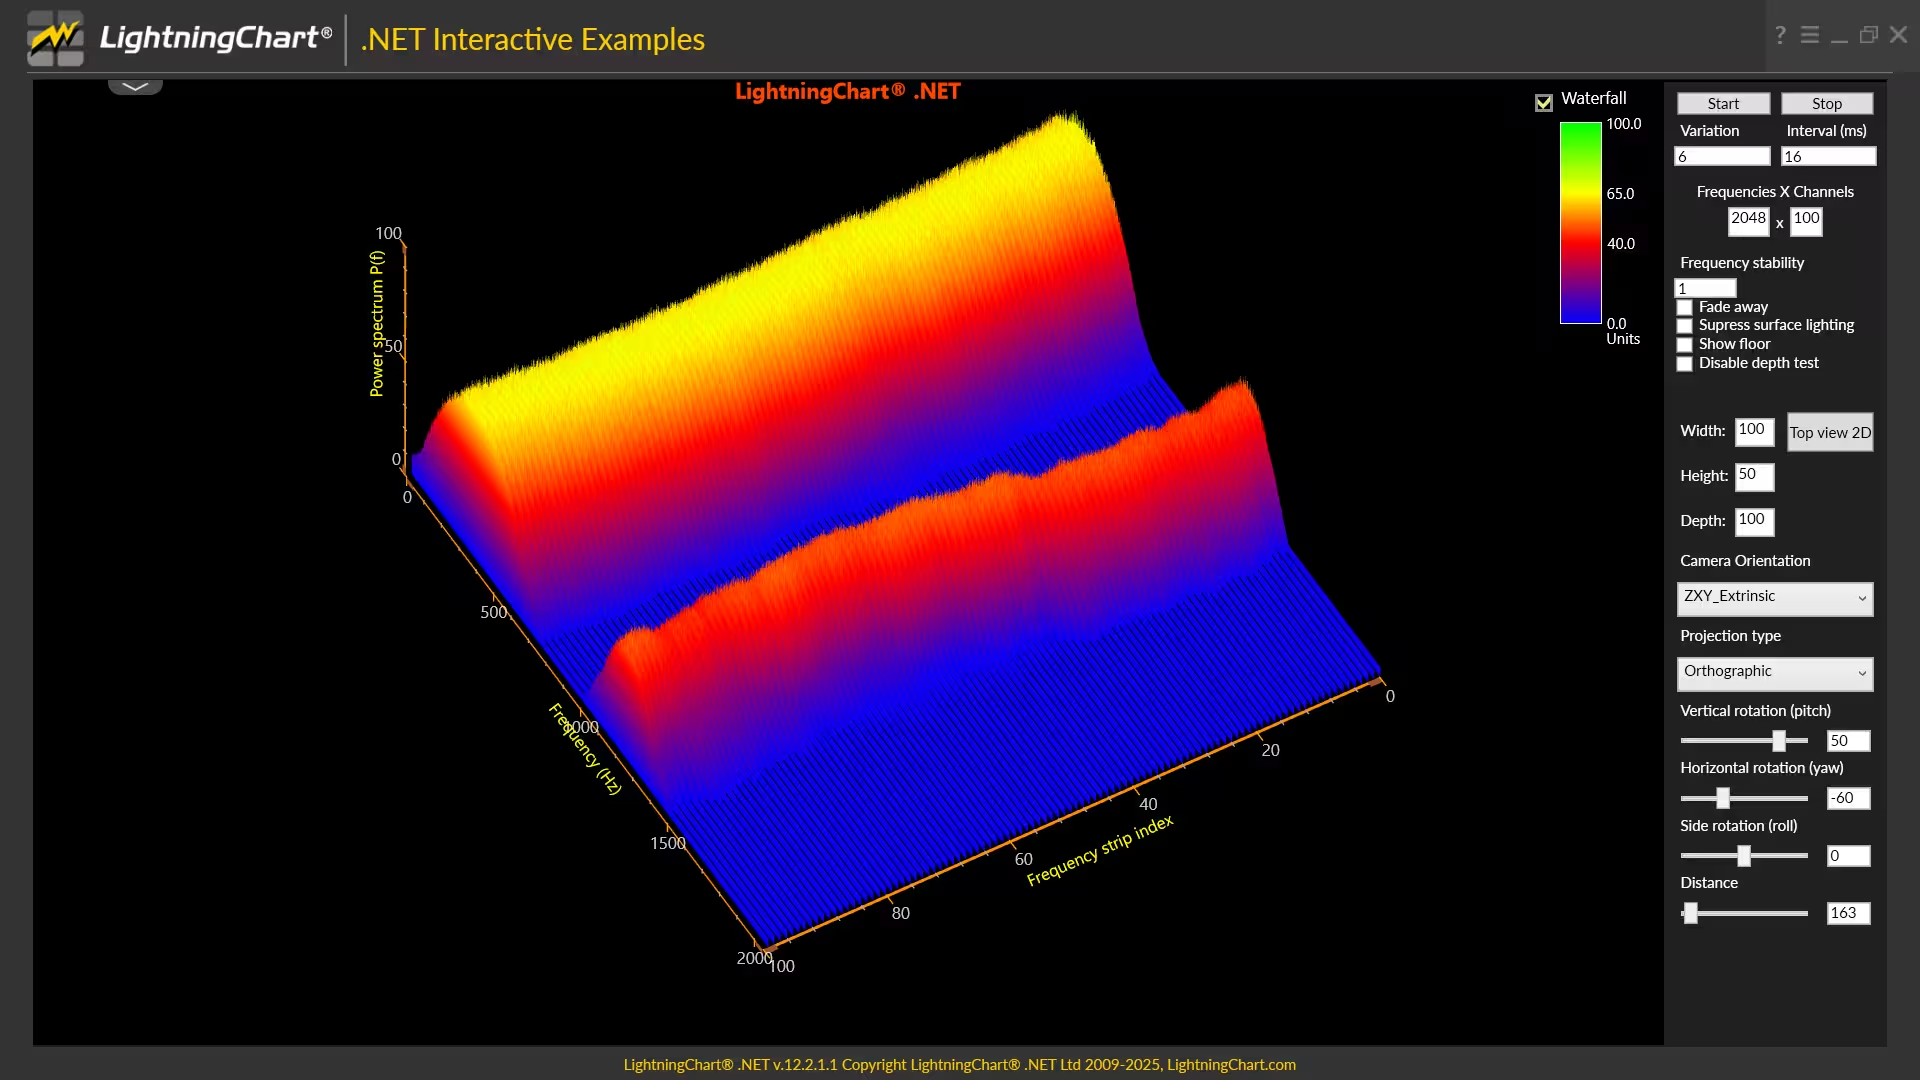
Spectrum 3D waterfall
.NET Trader
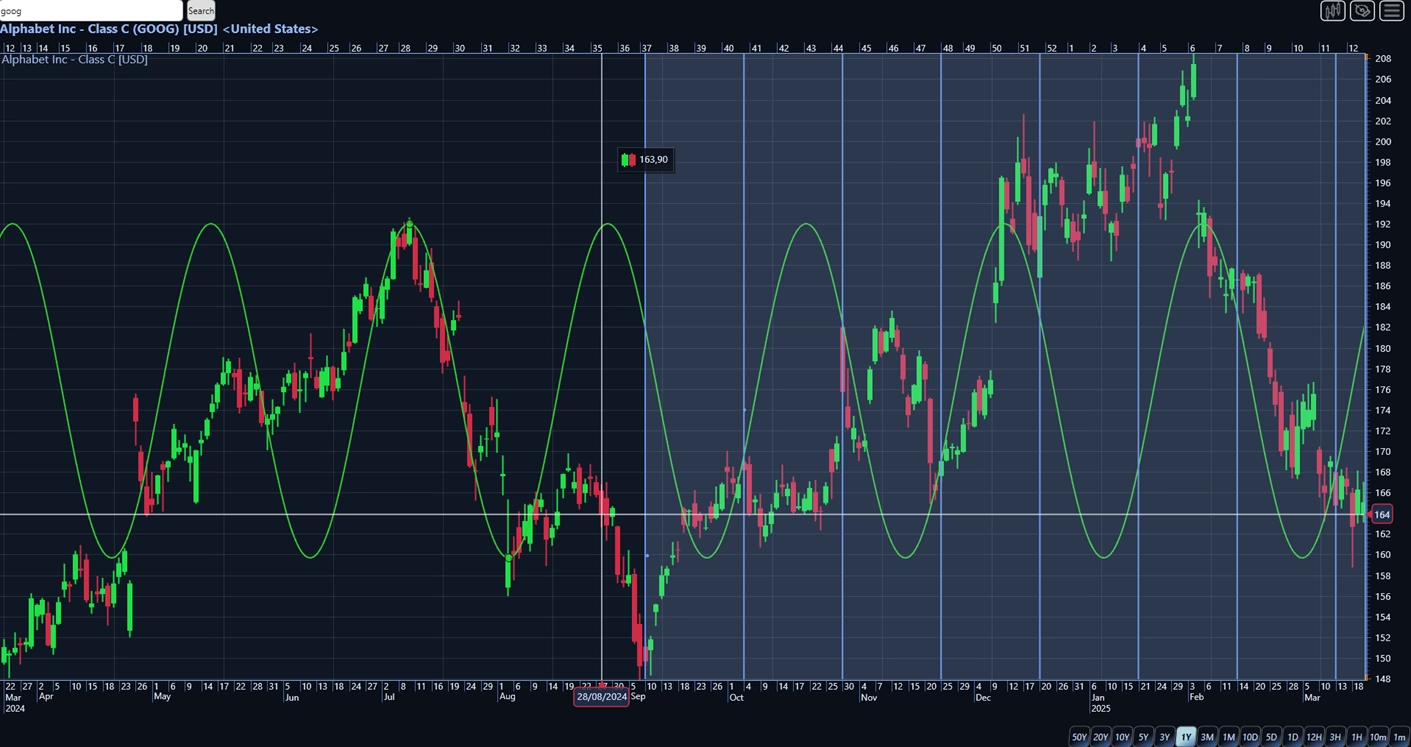
LightningChart .NET features trading charts (requires a separate license) for developing financial and trading applications. In this version, we have improved multiple UI elements including:
adding percentage and logarithmic axes
multiple ticker symbols support
adding/improving drawing tools
Get Started with LightningChart .NET
Access the latest version with a 30-day free trial. Or read the full official release note.
Subscribe to my newsletter
Read articles from Omar Urbano | LightningChart directly inside your inbox. Subscribe to the newsletter, and don't miss out.
Written by

Omar Urbano | LightningChart
Omar Urbano | LightningChart
Hi! I'm a Software Engineer from Mexico and a data visualization enthusiast. I'm currently writing technical articles about data visualization and high-performance charts.


