📌Part 4 Optimize Kubernetes Monitoring: A Complete Guide to Prometheus and Grafana Integration
 Vikas Surve
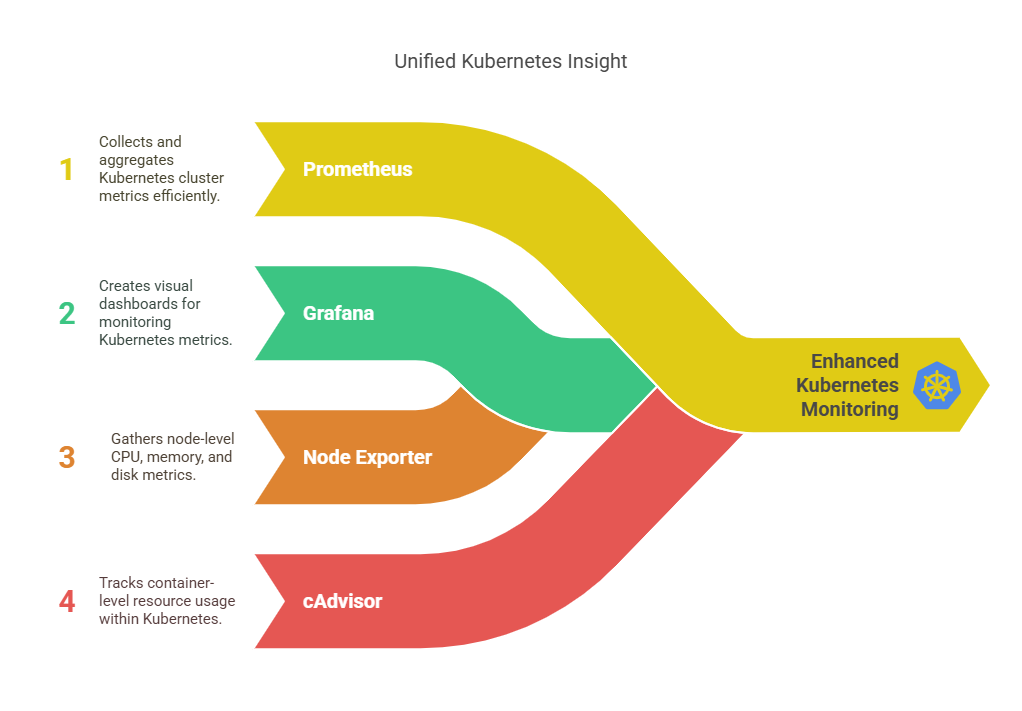
📌 Advanced Kubernetes Monitoring with Prometheus, Grafana, Node Exporter & cAdvisor
1️⃣ Overview
Monitoring Kubernetes effectively requires collecting metrics from both the cluster and individual nodes. This guide extends our monitoring setup by adding:
✅ Prometheus – Collects Kubernetes cluster metrics
✅ Grafana – Visualizes metrics in dashboards
✅ Node Exporter – Captures node-level CPU, memory, and disk metrics
✅ cAdvisor – Monitors container-level resource usage
By the end of this guide, you'll have deep visibility into your Kubernetes environment. 🚀
2️⃣ Deploying Prometheus
📌 Ensure you have created a monitoring namespace:
kubectl create namespace monitoring
✅ Sample Output:
namespace/monitoring created
🔹 Apply Prometheus Configurations
curl -o prometheus-config.yaml https://raw.githubusercontent.com/Vikas-DevOpsPractice/EasyShop/feature/kindcluster/K8s/14-prometheus-config.yaml
curl -o prometheus-deployment.yaml https://raw.githubusercontent.com/Vikas-DevOpsPractice/EasyShop/feature/kindcluster/K8s/15-prometheus-deployment.yaml

kubectl apply -f prometheus-config.yaml -n monitoring
kubectl apply -f prometheus-deployment.yaml -n monitoring
✅ Check Prometheus Deployment:
kubectl get pods -n monitoring
✅ Sample Output:
NAME                         READY   STATUS    RESTARTS   AGE
prometheus-5f9d77c86f-xyz12  1/1     Running   0          1m
3️⃣ Deploying Node Exporter
🔹 Why Node Exporter?
🔹 Collects CPU, Memory, Disk, and Network usage of each Kubernetes node
🔹 Provides hardware and OS metrics
🔹 Step 1: Create a DaemonSet for Node Exporter
# node-exporter-daemonset.yaml
apiVersion: apps/v1
kind: DaemonSet
metadata:
  name: node-exporter
  namespace: monitoring
spec:
  selector:
    matchLabels:
      app: node-exporter
  template:
    metadata:
      labels:
        app: node-exporter
    spec:
      hostNetwork: true
      containers:
      - name: node-exporter
        image: prom/node-exporter:v1.5.0
        ports:
        - containerPort: 9100
          hostPort: 9100
✅ Apply the DaemonSet:
kubectl apply -f node-exporter-daemonset.yaml -n monitoring
✅ Verify Deployment:
kubectl get pods -n monitoring
✅ Sample Output:
NAME                         READY   STATUS    RESTARTS   AGE
node-exporter-xyz12          1/1     Running   0          1m
4️⃣ Deploying cAdvisor
🔹 Why cAdvisor?
🔹 Provides per-container resource usage (CPU, memory, disk, network)
🔹 Helps in troubleshooting slow or resource-hungry containers
🔹 Step 1: Create a DaemonSet for cAdvisor
# cadvisor-daemonset.yaml
apiVersion: apps/v1
kind: DaemonSet
metadata:
  name: cadvisor
  namespace: monitoring
spec:
  selector:
    matchLabels:
      app: cadvisor
  template:
    metadata:
      labels:
        app: cadvisor
    spec:
      hostNetwork: true
      containers:
      - name: cadvisor
        image: gcr.io/cadvisor/cadvisor:v0.47.0
        ports:
        - containerPort: 8080
          hostPort: 8080
✅ Apply the DaemonSet:
kubectl apply -f cadvisor-daemonset.yaml -n monitoring
✅ Verify Deployment:
kubectl get pods -n monitoring
✅ Sample Output:
NAME                         READY   STATUS    RESTARTS   AGE
cadvisor-xyz12               1/1     Running   0          1m
5️⃣ Integrating Node Exporter & cAdvisor with Prometheus
🔹 Update Prometheus Configuration
Add the following scrape jobs to prometheus-config.yaml:
scrape_configs:
  - job_name: 'node-exporter'
    static_configs:
      - targets: ['node-exporter.monitoring.svc.cluster.local:9100']

  - job_name: 'cadvisor'
    static_configs:
      - targets: ['cadvisor.monitoring.svc.cluster.local:8080']
✅ Reapply Prometheus Configuration:
kubectl apply -f prometheus-config.yaml -n monitoring
kubectl rollout restart deployment prometheus -n monitoring
6️⃣ Deploying Grafana
curl -o grafana-deployment.yaml https://raw.githubusercontent.com/Vikas-DevOpsPractice/EasyShop/feature/kindcluster/K8s/16-grafana-deployment.yaml
kubectl apply -f grafana-deployment.yaml -n monitoring
✅ Verify Grafana:
kubectl get pods -n monitoring
✅ Sample Output:
NAME                         READY   STATUS    RESTARTS   AGE
grafana-78b6c9c76f-xyz12     1/1     Running   0          1m
7️⃣ Setting Up Dashboards in Grafana
🔹 Add Prometheus as a Data Source
📌 Go to Grafana → Configuration → Add Data Source
🔹 Select Prometheus
🔹 Set URL to:
http://prometheus.monitoring.svc.cluster.local:9090
🔹 Click Save & Test
✅ Integration Successful!
🔹 Import Prebuilt Kubernetes Dashboards
📌 Go to Grafana Dashboard → Click Dashboards → Import
🔹 Use Dashboard ID: 11074 (Node Exporter)
🔹 Use Dashboard ID: 13689 (cAdvisor)
🔹 Select Prometheus as the data source → Click Import
✅ Sample Node Metrics Dashboard:

✅ Sample Container Metrics Dashboard:

8️⃣ Setting Up Alerts in Grafana
📌 Open Grafana → Click Alerts → Create Alert Rule
🔹 Condition: Alert when CPU Usage > 80% for 5 minutes
🔹 Notification: Email, Slack, PagerDuty
🔹 Click Save & Enable Alerting
✅ Now, alerts will trigger on resource spikes!
9️⃣ Troubleshooting & Best Practices
🔹 Prometheus Not Collecting Metrics?
kubectl logs -l app=prometheus -n monitoring
📌 Ensure the scrape configs in prometheus-config.yaml are correct
🔹 Node Exporter Not Running?
kubectl describe pod node-exporter-xyz12 -n monitoring
📌 Ensure hostPort 9100 is available
🔹 cAdvisor Metrics Not Appearing?
kubectl logs -l app=cadvisor -n monitoring
📌 Ensure cadvisor.monitoring.svc.cluster.local:8080 is correct in Prometheus config
🎯 Conclusion
🚀 Advanced Kubernetes Monitoring is now fully set up!
✅ Prometheus collects Kubernetes & node metrics
✅ Node Exporter tracks hardware performance
✅ cAdvisor monitors per-container usage
✅ Grafana visualizes & alerts on key metrics
Subscribe to my newsletter
Read articles from Vikas Surve directly inside your inbox. Subscribe to the newsletter, and don't miss out.
Written by
Vikas Surve
Vikas Surve
I am an 𝗠𝗦 𝗖𝗲𝗿𝘁𝗶𝗳𝗶𝗲𝗱 𝗗𝗲𝘃𝗢𝗽𝘀 𝗘𝗻𝗴𝗶𝗻𝗲𝗲𝗿 𝗘𝘅𝗽𝗲𝗿𝘁 and 𝗔𝘇𝘂𝗿𝗲 𝗔𝗱𝗺𝗶𝗻𝗶𝘀𝘁𝗿𝗮𝘁𝗼𝗿 𝗔𝘀𝘀𝗼𝗰𝗶𝗮𝘁𝗲 with over 𝟭𝟬 𝘆𝗲𝗮𝗿𝘀 𝗼𝗳 𝗲𝘅𝗽𝗲𝗿𝗶𝗲𝗻𝗰𝗲 in designing, implementing, and optimizing DevOps solutions. My expertise includes 𝗖𝗜/𝗖𝗗 𝗮𝘂𝘁𝗼𝗺𝗮𝘁𝗶𝗼𝗻 𝘂𝘀𝗶𝗻𝗴 𝗚𝗶𝘁𝗟𝗮𝗯, 𝗝𝗲𝗻𝗸𝗶𝗻𝘀, 𝗮𝗻𝗱 𝗔𝘇𝘂𝗿𝗲 𝗗𝗲𝘃𝗢𝗽𝘀, as well as 𝗖𝗼𝗻𝘁𝗮𝗶𝗻𝗲𝗿 𝗼𝗿𝗰𝗵𝗲𝘀𝘁𝗿𝗮𝘁𝗶𝗼𝗻 𝘄𝗶𝘁𝗵 𝗗𝗼𝗰𝗸𝗲𝗿 𝗮𝗻𝗱 𝗞𝘂𝗯𝗲𝗿𝗻𝗲𝘁𝗲𝘀. 🔹 𝗘𝘅𝗽𝗲𝗿𝘁 𝗶𝗻 𝗱𝗲𝘀𝗶𝗴𝗻𝗶𝗻𝗴 𝗮𝗻𝗱 𝗺𝗮𝗻𝗮𝗴𝗶𝗻𝗴 𝗲𝗻𝗱-𝘁𝗼-𝗲𝗻𝗱 𝗖𝗜/𝗖𝗗 𝗽𝗶𝗽𝗲𝗹𝗶𝗻𝗲𝘀 🔹 𝗛𝗮𝗻𝗱𝘀-𝗼𝗻 𝗲𝘅𝗽𝗲𝗿𝗶𝗲𝗻𝗰𝗲 𝘄𝗶𝘁𝗵 𝗔𝘇𝘂𝗿𝗲, 𝗞𝘂𝗯𝗲𝗿𝗻𝗲𝘁𝗲𝘀 (𝗔𝗞𝗦), 𝗮𝗻𝗱 𝗧𝗲𝗿𝗿𝗮𝗳𝗼𝗿𝗺 𝗳𝗼𝗿 𝘀𝗰𝗮𝗹𝗮𝗯𝗹𝗲 𝗱𝗲𝗽𝗹𝗼𝘆𝗺𝗲𝗻𝘁𝘀 🔹 𝗣𝗮𝘀𝘀𝗶𝗼𝗻𝗮𝘁𝗲 𝗮𝗯𝗼𝘂𝘁 𝗮𝘂𝘁𝗼𝗺𝗮𝘁𝗶𝗼𝗻, 𝘀𝗲𝗰𝘂𝗿𝗶𝘁𝘆, 𝗮𝗻𝗱 𝗰𝗹𝗼𝘂𝗱-𝗻𝗮𝘁𝗶𝘃𝗲 𝘁𝗲𝗰𝗵𝗻𝗼𝗹𝗼𝗴𝗶𝗲𝘀 🛠 𝗦𝗸𝗶𝗹𝗹𝘀 & 𝗧𝗼𝗼𝗹𝘀 ✅ 𝗗𝗲𝘃𝗢𝗽𝘀 & 𝗖𝗜/𝗖𝗗: Azure DevOps, GitLab, Jenkins ✅ 𝗖𝗹𝗼𝘂𝗱 & 𝗜𝗻𝗳𝗿𝗮𝘀𝘁𝗿𝘂𝗰𝘁𝘂𝗿𝗲: Azure, AWS ✅ 𝗜𝗻𝗳𝗿𝗮𝘀𝘁𝗿𝘂𝗰𝘁𝘂𝗿𝗲 𝗮𝘀 𝗖𝗼𝗱𝗲 (𝗜𝗮𝗖): Terraform, Bicep ✅ 𝗖𝗼𝗻𝘁𝗮𝗶𝗻𝗲𝗿𝘀 & 𝗢𝗿𝗰𝗵𝗲𝘀𝘁𝗿𝗮𝘁𝗶𝗼𝗻: Docker, Kubernetes (AKS) ✅ 𝗖𝗼𝗻𝗳𝗶𝗴 𝗠𝗮𝗻𝗮𝗴𝗲𝗺𝗲𝗻𝘁: PowerShell, Shell Scripting ✅ 𝗠𝗼𝗻𝗶𝘁𝗼𝗿𝗶𝗻𝗴 & 𝗢𝗯𝘀𝗲𝗿𝘃𝗮𝗯𝗶𝗹𝗶𝘁𝘆: Grafana, Prometheus, Azure Monitor ✅ 𝗦𝗲𝗰𝘂𝗿𝗶𝘁𝘆 & 𝗡𝗲𝘁𝘄𝗼𝗿𝗸𝗶𝗻𝗴: Load Balancers, Firewalls, ClusterIP ✅ 𝗢𝗽𝗲𝗿𝗮𝘁𝗶𝗻𝗴 𝗦𝘆𝘀𝘁𝗲𝗺𝘀: Linux, Mac 💡 𝗞𝗲𝘆 𝗦𝘁𝗿𝗲𝗻𝗴𝘁𝗵𝘀 ✔ 𝗖𝗹𝗼𝘂𝗱 𝗔𝗿𝗰𝗵𝗶𝘁𝗲𝗰𝘁𝘂𝗿𝗲 & 𝗔𝘂𝘁𝗼𝗺𝗮𝘁𝗶𝗼𝗻 – Designing and managing scalable cloud solutions ✔ 𝗖𝗜/𝗖𝗗 & 𝗗𝗲𝘃𝗢𝗽𝘀 𝗟𝗲𝗮𝗱𝗲𝗿𝘀𝗵𝗶𝗽 – Implementing robust and automated software delivery pipelines ✔ 𝗧𝗲𝗮𝗺 𝗟𝗲𝗮𝗱𝗲𝗿𝘀𝗵𝗶𝗽 & 𝗠𝗲𝗻𝘁𝗼𝗿𝘀𝗵𝗶𝗽 – Leading a 5-member team, fostering collaboration and growth ✔ 𝗦𝗲𝗰𝘂𝗿𝗶𝘁𝘆 & 𝗖𝗼𝗺𝗽𝗹𝗶𝗮𝗻𝗰𝗲 – Ensuring cloud security, compliance, and best practices ✔ 𝗣𝗿𝗼𝗯𝗹𝗲𝗺 𝗦𝗼𝗹𝘃𝗶𝗻𝗴 & 𝗢𝗽𝘁𝗶𝗺𝗶𝘇𝗮𝘁𝗶𝗼𝗻 – Driving efficiency through automation and DevOps practices ✔ 𝗖𝗼𝗻𝘁𝗶𝗻𝘂𝗼𝘂𝘀 𝗟𝗲𝗮𝗿𝗻𝗶𝗻𝗴 & 𝗜𝗻𝗻𝗼𝘃𝗮𝘁𝗶𝗼𝗻 – Exploring emerging technologies and best practices