Data Visualization in the Oil & Gas Industry Using SciChart
 SciChart
At SciChart, we serve customers in many industries and sectors. One sector that keeps coming back to use our chart software again and again is the oil and gas industry. In this blog post, we deep dive into how SciChart can help solve data visualization problems in the oil and gas industry, and what chart types and features make us a great fit for explorers or producers who need to visualize complex or big data.
What is SciChart?
First up, what is SciChart, and more importantly, what isn’t it?
SciChart is a software library for adding charts and graphs to applications. Our chart library supports JavaScript, TypeScript in browser or electron apps, C# WPF on Windows, Swift on macOS and iOS and Kotlin on Android.
Our customers are software development teams that are building apps that need to visualize data in 2D or 3D WPF charts and graphs. We don’t sell an off-the-shelf SaaS app for oil and gas prospecting. Instead, we sell chart libraries that help you build the best prospecting or exploration tools for internal or external teams. If that’s you, and you’d like to find out how, read on.
Data Visualization in the Oil & Gas Industry: Most Popular Chart Types
We asked our customers to name the most important chart types or features for oil and gas data visualization. This is what they told us:
Big Data: The ability to display millions of data points without slowdown is a must.
Vertical charts: The ability to rotate a chart to view vertical drill depth.
Synchronizing several charts: The ability to zoom, pan and show tooltips on several charts with the same horizontal or vertical scale.
Dashboarding charts: The ability to create oil and gas dashboards with several charts. Some call this a Trellis chart. We simply call it a dashboard.
Popular chart types are supported: This includes line, mountain, and scatter charts.
Oil and gas-specific chart types: This includes formation charts.
Sonogram charts: We call this a heatmap, but it can also be used to visualize a sonogram, ultrasound or other data from well and drill sensors.
3D charts: Visualizing surface meshes, topology data or point clouds in 3D is possible with SciChart, both in browser and on desktop and mobile devices.
High Performance: We already mentioned Big Data, but high performance and realtime charts are central to what we do and crucial for scientific industries.
SciChart can handle all these scenarios and more.
Let’s dig into the features and showcase some demos below:
How to Build Oil & Gas Dashboard Demos with SciChart
We’ve created some oil and gas dashboard demos showing you how to configure SciChart for oil and gas applications below. These have been created in both JavaScript for browser apps and WPF / C# for Windows desktop apps.
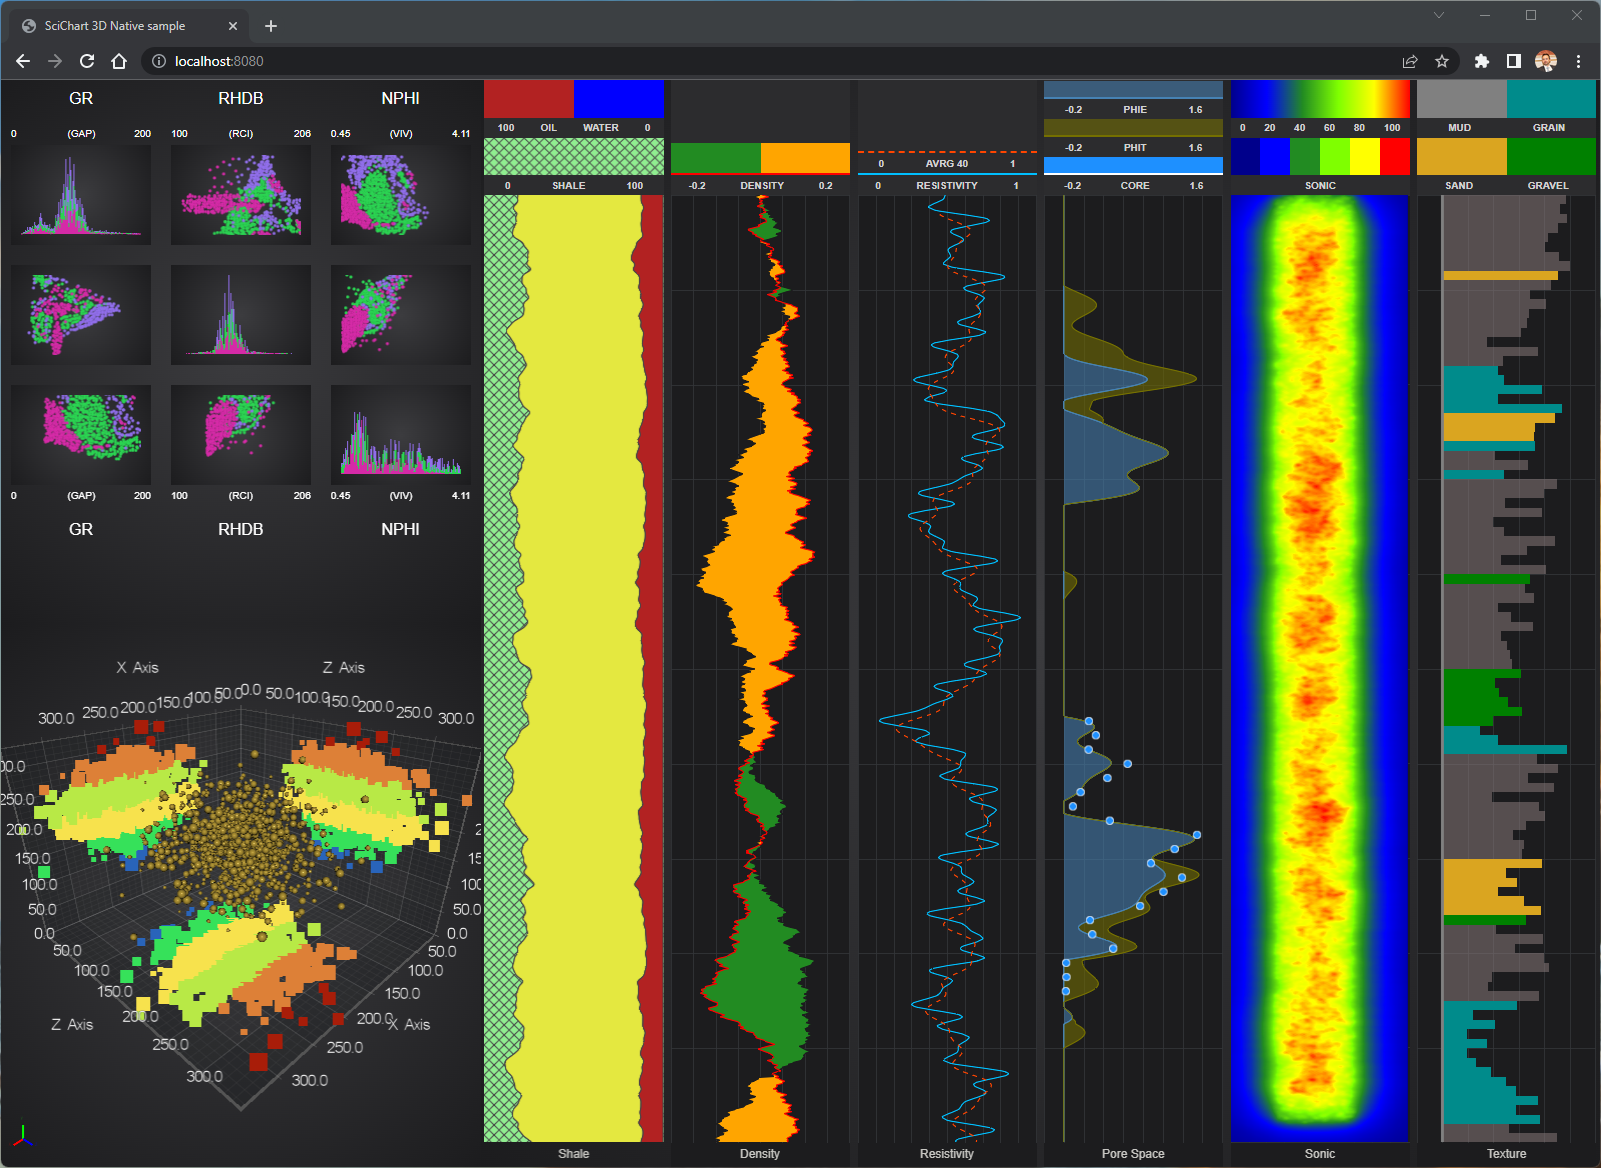
We’ve created a JavaScript demo showcasing SciChart’s capabilities for the oil and gas industry. Download the source code here.
Above is our oil and gas dashboard demo, which we’ve created in JavaScript as well as WPF (Windows).
Find the Source Code for the Oil & Gas Dashboard Demos Here:
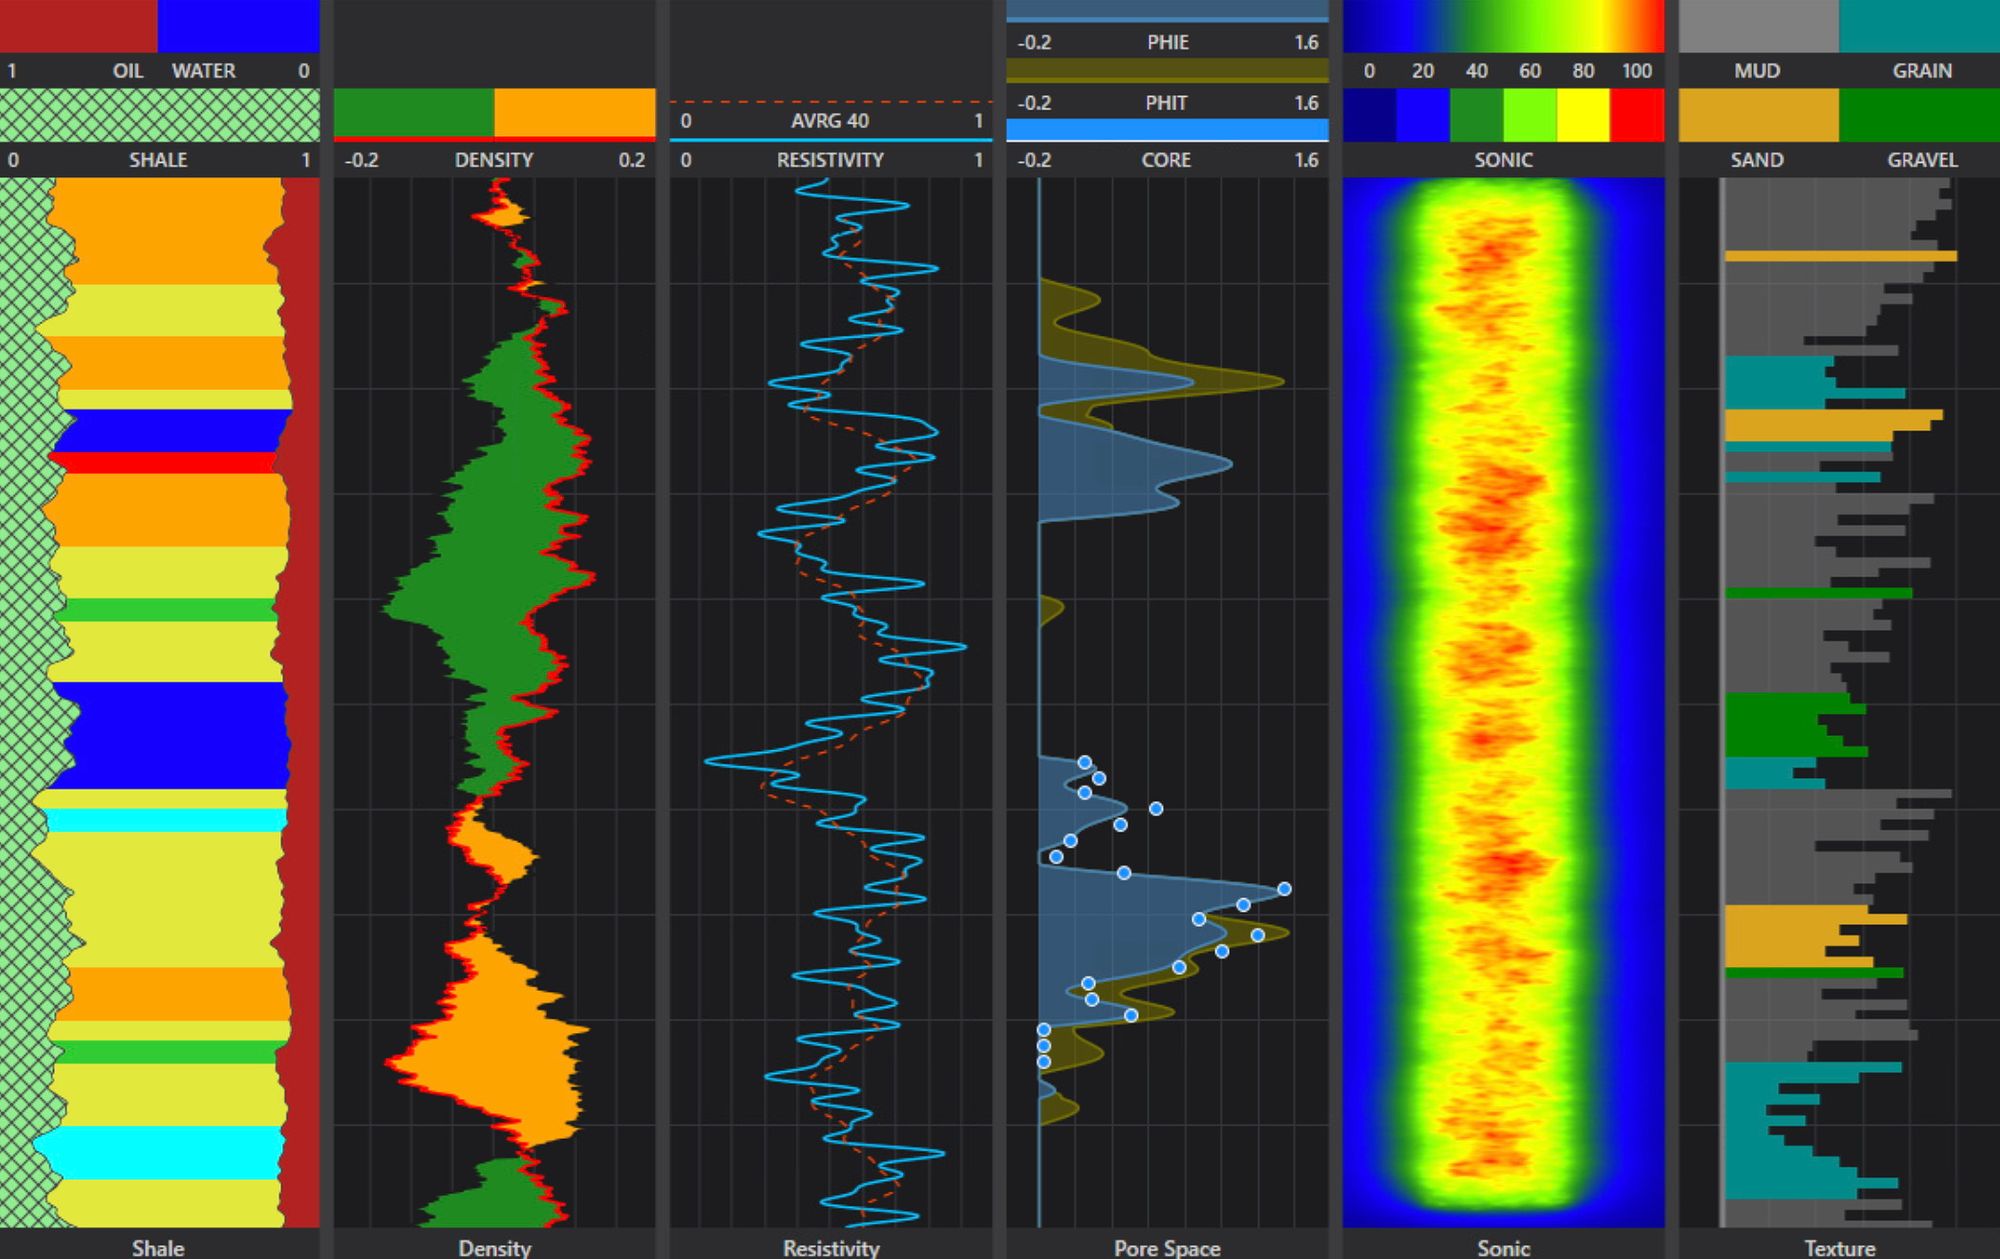
SciChart’s Vertical Chart Feature
We’re using the vertical chart features in SciChart to arrange numerous drill depth charts. These have synchronized zooming, panning, and tooltips using a feature we call the RolloverModifier. Each vertical chart has a different visualization to showcase the flexibility and power of SciChart.
We’ve created a WPF (Windows) demo showcasing SciChart’s capabilities for the oil and gas industry. Download the WPF Source code and JavaScript Source code.
3D Charts, Sonograms & Heatmaps
3D charts and heatmaps (sonogram/spectrogram) are supported. Our JavaScript heatmaps are high-performing and update in realtime to show ultrasound or spectrogram data from oilwell sensors.
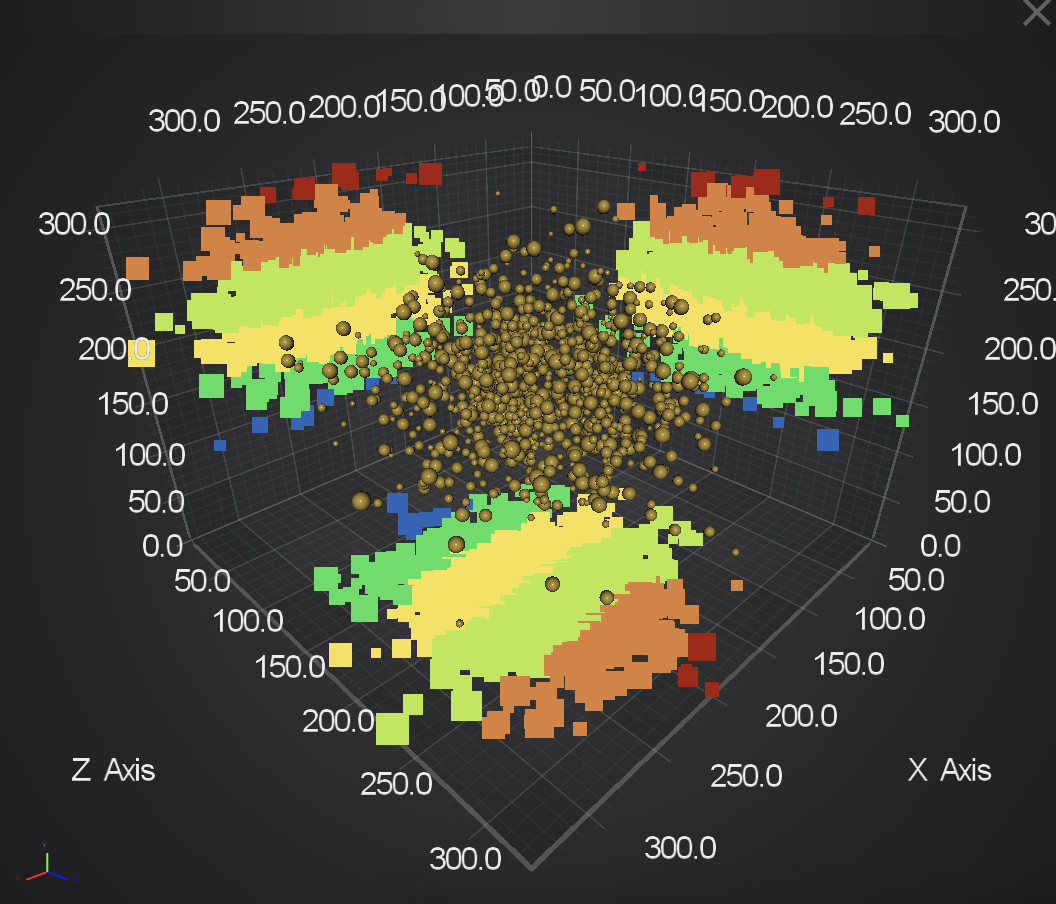
3D charts are supported in SciChart.js as well as SciChart WPF.
Contact Us to Find Out More
To find out more about SciChart or enquire about how we can help with your data visualization for the oil and gas industry, including prospecting, exploration or management applications, get in touch using the contact form.
Subscribe to my newsletter
Read articles from SciChart directly inside your inbox. Subscribe to the newsletter, and don't miss out.
Written by