Mastering the top Command: A Friendly Guide to Monitoring Your Linux Server
 Ahmed Shaaban
If you’ve ever found yourself wondering what’s eating up your server’s resources or why your computer is running slow, the top command is here to help! It’s a powerful yet simple tool that provides real-time insights into CPU usage, memory consumption, and active processes. Let’s dive into how to use top effectively and make sense of its output.
top is a Linux utility that comes pre-installed on most of the Linus distros. To launch top, simply open a terminal and type:
top
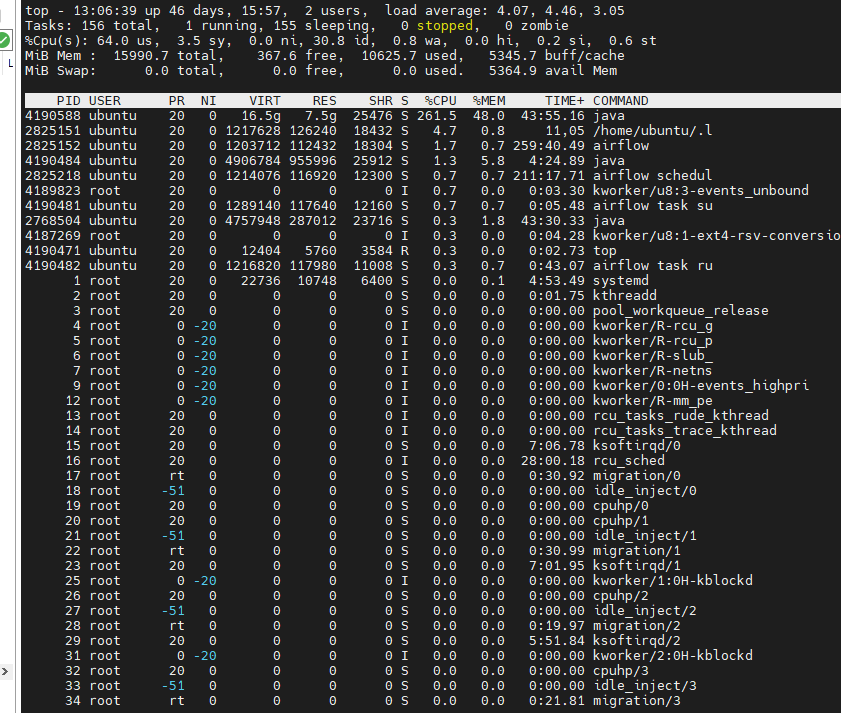
You’ll be greeted by a screen filled with numbers, stats, and a list of running processes. It might seem overwhelming at first, but let’s break it down line by line.

1st Line
This line mirrors the output of the uptime command, displaying the current time, system uptime (how long the server has been running), number of logged-in users, and the load average over the past 1, 5, and 15 minutes.
The load average indicates the system's workload; values equal to the number of CPUs suggest full utilization, values below indicate under-utilization and values above suggest over-utilization. So For example, if your server has 16 CPUs. A workload of 7.2 means that they are under-utilized, a workload of 16.8 means that they are over-utilized, and a workload of 15.6 means that all the CPUs are almost 100% utilized.
2nd Line
Here, you'll find the total number of processes and their numbers in each state: running, sleeping, stopped, or zombie. A zombie process refers to a child process that has completed execution but remains in the process table because its parent has not yet acknowledged its termination, which normally happens when the parent process is terminated before the child process.
3rd Line
This line breaks down CPU utilization into various categories:
us (user): Time spent on user processes.
sy (system): Time spent on system (kernel) processes.
ni (nice): Time spent on processes with adjusted priority.
id (idle): Time when the CPU is idle.
wa (I/O wait): Time waiting for I/O operations to complete.
hi (hardware interrupts) and si (software interrupts): Time handling hardware and software interrupts, respectively.
st (steal time): Time stolen by the hypervisor in virtualized environments.
Understanding these metrics helps in identifying CPU bottlenecks and optimizing process performance. For example, when the wa percentage is high it means that most of the CPU time is spent waiting for I/O.
4th & 5th Lines
These lines provide insights into memory (RAM) and swap space utilization:
Mem: Displays total, free, used, and cached memory.
Swap: Shows total, free, and used swap space, along with available memory.
It is worth mentioning here that the free number can be a little misleading. Free represents the amount of memory that is free, not the amount of memory that is available for the system to launch new processes. The system can evict some pages used by the buffers/cache to use it. So the real available amount of memory is the free + the buff/cache amounts.
Exploring the Process List
The lower section of the top interface lists active processes, providing detailed information across various columns:
PID (Process ID): A unique identifier assigned to each process.
USER: The owner of the process.
PR (Priority): The scheduling priority of the process. Lower values indicate higher priority.
NI (Nice Value): Indicates the priority adjustment applied to the process. Negative values represent higher priority, while positive values denote lower priority.
VIRT (Virtual Memory): Total virtual memory used by the process.
RES (Resident Memory): Actual physical memory (RAM) used by the process.
SHR (Shared Memory): Amount of shared memory used by the process.
S (State): Current state of the process, such as Running (R), Sleeping (S), or Zombie (Z).
%CPU: Percentage of CPU time the process is consuming.
%MEM: Percentage of physical memory used by the process.
TIME+: Total CPU time the process has consumed since it started.
COMMAND: The command that initiated the process.
There are additional columns that can be added to this section. You can press f to see a complete list of columns and select from them.
This list of processes can be sorted according to:
Memory: Press
Shift + mCPU: Press
Shift + pTime: Press
Shift + t
You can change the refresh rate of the list by pressing d and then writing the number of seconds between refreshes - the default is 3 seconds -.
A final trick is that you can kill any process within top by pressing k on your keyboard and then typing the PID of the process.
Conclusion
top is a super helpful command in that it can give you a general overview of your server’s performance. It is easy to use and comes pre-installed in most Linux distros, making it the first option for me at least when I need to know what is going on behind the scenes. For more information, please check the man page.
Subscribe to my newsletter
Read articles from Ahmed Shaaban directly inside your inbox. Subscribe to the newsletter, and don't miss out.
Written by

Ahmed Shaaban
Ahmed Shaaban
Hi there, My name is Ahmed. I am a data engineer currently based in Egypt. I enjoy learning new things and writing about them. Feel free to reach out to me even if you just want to say hello.