Hypothesis Testing: A Simple Guide with Real-Life Examples
 Manav Rastogi
What is Hypothesis Testing?
Hypothesis testing is a statistical method used to make decisions about a population based on sample data. It helps determine whether an assumption (hypothesis) about a population parameter is likely true.
Key Terms in Hypothesis Testing
Null Hypothesis (H₀): Assumes no effect or no difference.
Example: "Drinking coffee does not improve memory."
Alternative Hypothesis (H₁): Assumes an effect or difference exists.
Example: "Drinking coffee improves memory."
Mechanism of Hypothesis Testing
1️⃣ Frame the Hypothesis
Example: A company claims its new battery lasts 10 hours. We test this claim using a sample.
H₀: Battery life = 10 hours
H₁: Battery life ≠ 10 hours
2️⃣ Statistical Analysis
Choose the appropriate test (Z-test, T-test, Chi-square, ANOVA)
Calculate the test statistic
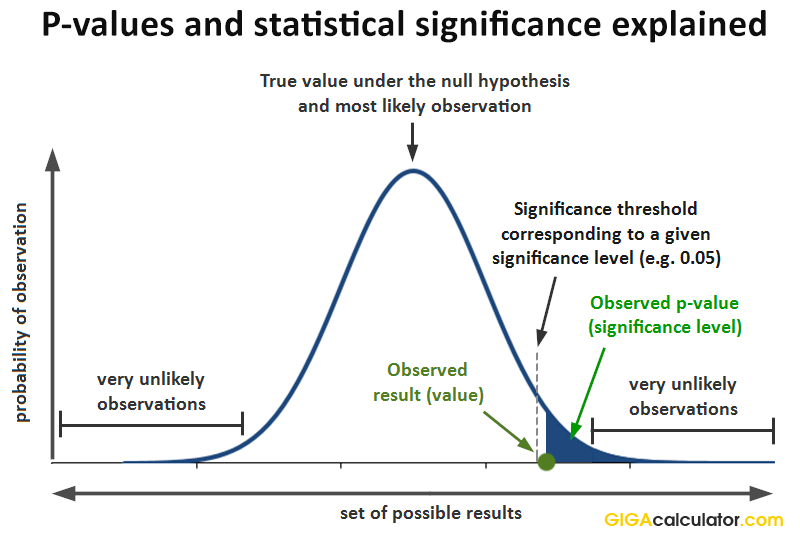
Compute the p-value
3️⃣ Conclusion
If p-value < significance level (α), reject H₀
Otherwise, fail to reject H₀
P-value, Confidence Interval & Significance Level
P-value: Probability of observing the test results under H₀.
Significance Level (α): Threshold to reject H₀ (commonly 0.05 or 5%).
Rejection Region: If p-value < α, we reject H₀.
Confidence Interval (CI): The range in which the true population parameter is expected to lie.
Formula: CI=Point Estimate±Margin of Error
Example: If people spend ₹1000 on average in a restaurant, but we are 95% confident the true mean lies between ₹950-₹1050.
Comparison of Hypothesis Testing Methods
| Test | Use Case | Example |
| Z-Test | Large samples (n ≥ 30), known population σ | Testing if a new drug improves recovery time |
| T-Test | Small samples (n < 30), unknown σ | Comparing exam scores of two classes |
| Chi-Square | Categorical data analysis | Checking if product preference is gender-dependent |
| ANOVA | Comparing 3+ groups | Evaluating effectiveness of three diets |
Hypothesis Testing Methods
1️⃣ Z-Test
Used when sample size ≥ 30
Population standard deviation (σ) is known
Example: A manufacturer claims a bulb lasts 1000 hours. A sample of 40 bulbs gives a mean of 980 hours with σ = 50. Should we reject the claim at α = 0.05?
Solution:
Frame the Hypothesis
H₀: μ = 1000 hours
H₁: μ ≠ 1000 hours
α = 0.05
Z-Test Formula: Z=(X−μ)(σ/n) Z = \frac{(X - \mu)}{(\sigma/\sqrt{n})} Z=(980−1000)(50/40)=−2.53Z = \frac{(980 - 1000)}{(50/\{40})} = -2.53
Find p-value using Z-table: 0.0114
Since p-value < 0.05, reject H₀.
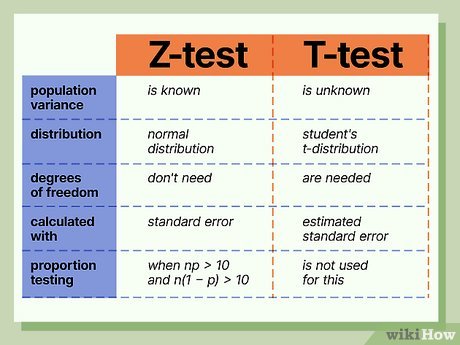
2️⃣ T-Test (Student's t-Distribution)
Used when sample size < 30 and σ is unknown
Example: Comparing the effectiveness of two teaching methods
3️⃣ Chi-Square Test
Used for categorical data to test independence or goodness of fit
Example: Testing if customer preference for brands is independent of gender
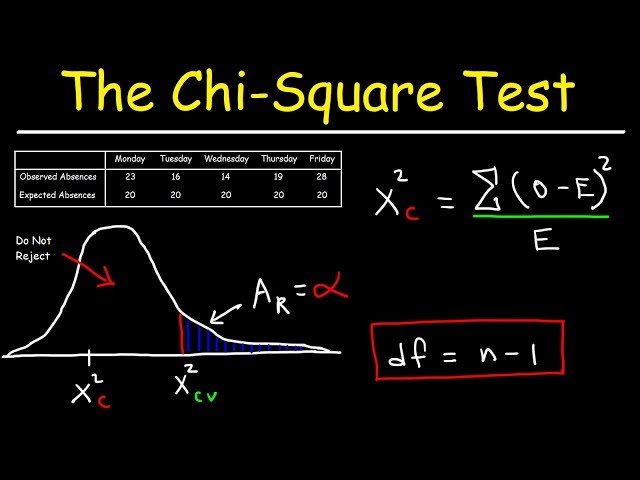
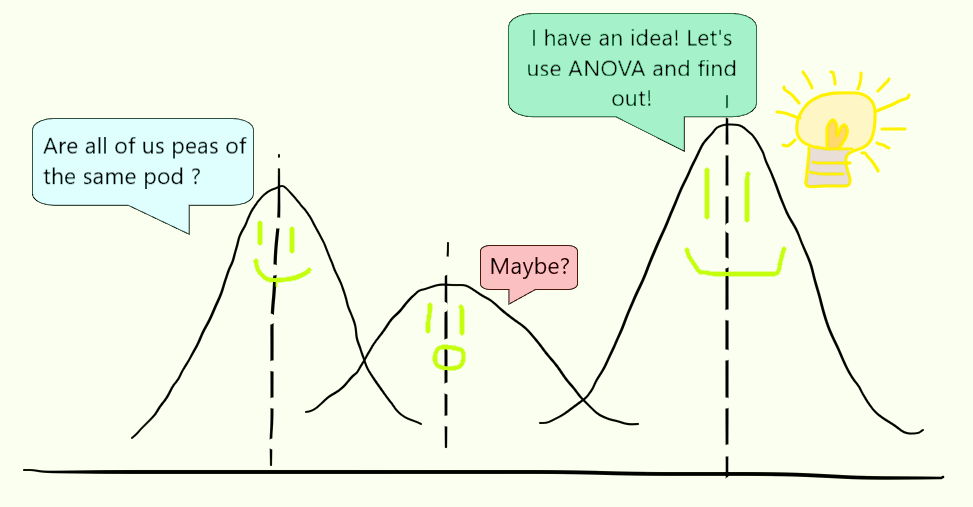
4️⃣ ANOVA (Analysis of Variance)
Used to compare 3 or more groups
Example: Comparing customer satisfaction across 3 different stores
Types: One-Way ANOVA, Repeated Measures ANOVA, Factorial ANOVA
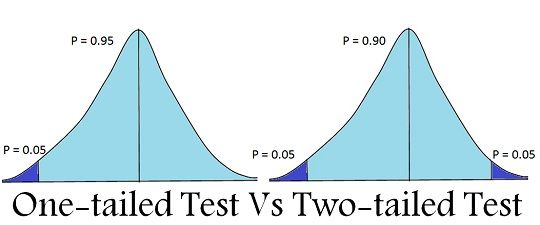
One-Tailed vs. Two-Tailed Tests
One-Tailed Test: Tests for effect in one direction (greater/less than)
Two-Tailed Test: Tests for effect in both directions (difference exists but unsure in which direction)
Example: If a drug is expected to increase lifespan:
One-tailed: "Lifespan increases"
Two-tailed: "Lifespan changes (increases or decreases)"
Type I and Type II Errors
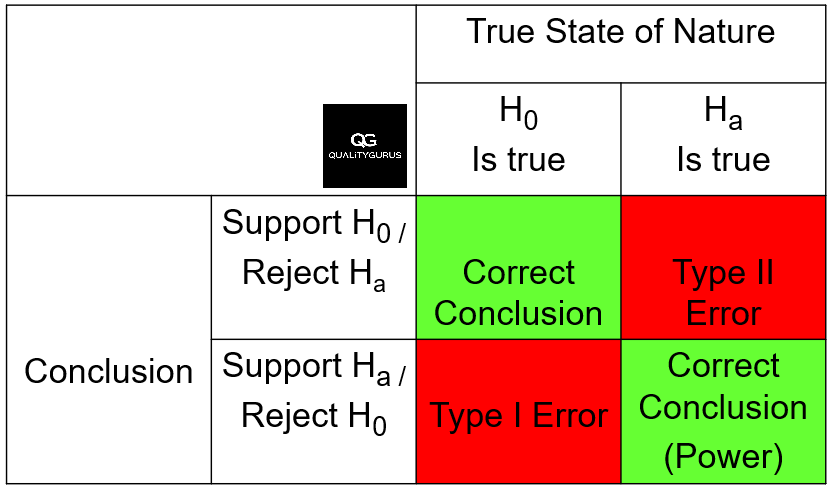
Type I Error (False Positive): Rejecting H₀ when it's true.
Type II Error (False Negative): Failing to reject H₀ when it's false.
| Actual Scenario | Decision | Outcome |
| H₀ is True | Reject H₀ | Type I Error ⚠️ |
| H₀ is True | Fail to Reject H₀ | ✅ Correct |
| H₀ is False | Reject H₀ | ✅ Correct |
| H₀ is False | Fail to Reject H₀ | Type II Error ⚠️ |
Bayes’ Theorem in Hypothesis Testing
Used to update probabilities based on new evidence
Example: Probability of having a disease given a positive test result
Chi-Square & F-Distribution
Chi-Square Test: Compares observed vs. expected frequencies
F-Test: Used in ANOVA to compare variances
ANOVA Test & Its Assumptions
One-Way ANOVA: Compares means of 3+ groups
Assumptions: Normality, Homogeneity of variance, Independence
Example: Comparing effectiveness of 3 weight loss programs
Types of ANOVA (Analysis of Variance) 📊
ANOVA is used to compare means across multiple groups. There are different types of ANOVA depending on the number of factors and measurements:
1️⃣ One-Way ANOVA
Compares means of three or more groups based on one independent variable (factor).
Example: Comparing test scores of students from three different schools.
Assumptions: Normality, independence, and equal variance.
2️⃣ Two-Way ANOVA
Compares means across two independent variables simultaneously.
Example: Studying the impact of teaching method and study hours on student performance.
Helps analyze interaction effects between variables.
3️⃣ Repeated Measures ANOVA
Used when the same subjects are tested multiple times under different conditions.
Example: Measuring blood pressure before, during, and after taking medication.
Helps reduce variability since the same participants are used.
4️⃣ Factorial ANOVA
Extension of Two-Way ANOVA that considers multiple independent variables with multiple levels.
Example: Studying the effect of diet (low-fat, high-protein) and exercise (cardio, weight training) on weight loss.
Can analyze complex interactions between multiple factors.
Practical Applications in Data Science & AI
A/B Testing: Hypothesis testing for marketing campaigns.
Machine Learning Models: ANOVA for feature selection.
Spam Detection: Bayes' Theorem for email classification.
Medical Studies: T-tests and Chi-square tests for clinical trials.
This blog simplifies Hypothesis Testing & Statistical Analysis using practical examples and real-world applications. Keep exploring & applying these concepts in real-world scenarios! 🚀📊
Subscribe to my newsletter
Read articles from Manav Rastogi directly inside your inbox. Subscribe to the newsletter, and don't miss out.
Written by

Manav Rastogi
Manav Rastogi
"Aspiring Data Scientist and AI enthusiast with a strong foundation in full-stack web development. Passionate about leveraging data-driven solutions to solve real-world problems. Skilled in Python, databases, statistics, and exploratory data analysis, with hands-on experience in the MERN stack. Open to opportunities in Data Science, Generative AI, and full-stack development."