4. Logistic Regression Algorithm for Neural Network
 Muhammad Fahad Bashir
This is the fourth lecture of this series - Deep Learning Essentials. In this lecture, we will explore the concept of the logistic regression algorithm for neural networks. Sometimes, the ideas behind them can seem hard to grasp. To make things easier, we can use a simple algorithm called Logistic Regression.
What is Logistic Regression?
Logistic Regression is a way to solve problems where you have to pick between two choices. It helps us understand some core ideas in neural networks without getting lost in complicated details.
Logistic Regression is a binary classification algorithm. Don't let the name confuse you! It's used when you only have two possible outcomes.

For example:
Is a person a smoker or not?
Do you have a certain disease, or not?
Is an image a cat, or not?
These are all problems where Logistic Regression can help. It takes data and figures out which of the two outcomes is more likely.
Many of the ideas used in Logistic Regression are also used in neural networks. This makes it a great way to learn about neural networks in a simpler way.
Understanding the Basics
To understand Logistic Regression, we need to know some basic terms:
Input (x): This is the data we give to the algorithm.
Output (y): This is the actual answer we are trying to predict. It can only be one of two things (0 or 1).
Training Examples (m): These are the examples we use to teach the algorithm how to make predictions.
Cat vs. Non-Cat
Let's use an example to make this clearer. Imagine we want to build a system that can tell if an image is a cat or not.
Input (x): The image.
Output (y): 1 if the image is a cat, 0 if it is not.
If the system guesses "1," it thinks the picture is a cat. If it guesses "0," it thinks it's something else.
In binary classification, we often use the terms positive class and negative class. The positive class is what we are most interested in finding. In our example, the positive class is "cat." The negative class is "not cat."
How Images Become Data
Images are made of pixels, and each pixel has a color. Computers see colors as numbers. Each image has three color channels: red, green, and blue.
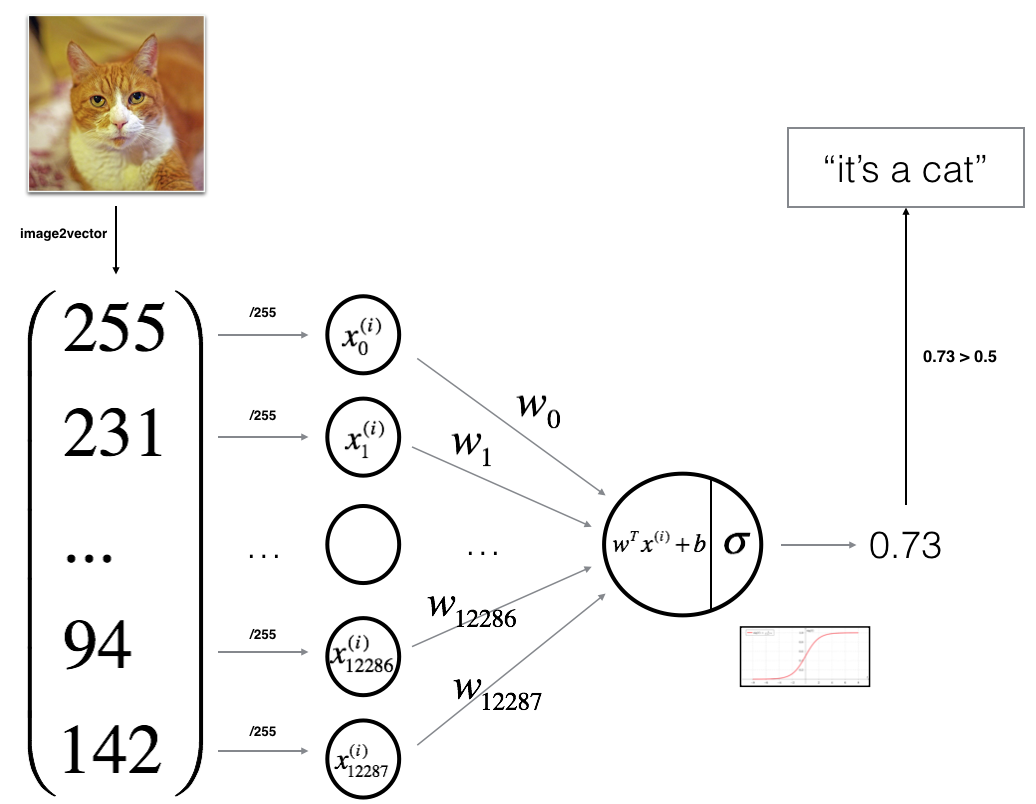
To use an image in Logistic Regression, we turn it into a long list of numbers (a vector). This vector contains all the pixel values for each color channel.
For example, if we have a 64x64 pixel image, the vector will have 12,288 numbers (64 64 3 = 12,288).

Notation
- m: Number of training examples (images).
- n: Number of dimensions in an example (12,288 for a 64x64 image).
- x: Input vector (image data).
- y: Corresponding output label (0 or 1).
Making Predictions
Logistic Regression takes the input (x) and tries to predict the output. We want to find a value called y-hat, which is our best guess for what the output should be.
Y-hat always has a value between 0 and 1. It tells us the chance that the input belongs to the positive class. In our example, it tells us the chance that the image is a cat.
Parameters: Weights and Bias
To make these predictions, Logistic Regression uses parameters. These are values that the algorithm learns during training. The two main parameters are:
Weight (w): A bunch of values that are adjusted to make accurate predictions.
Bias (b): A single number that shifts the prediction up or down.
Think of the weight as how important that input data is. A higher weight means that the input data is more important in making an accurate prediction.
Math Operations: Multiplication and Addition
Logistic Regression uses only two math operations: multiplication and addition.
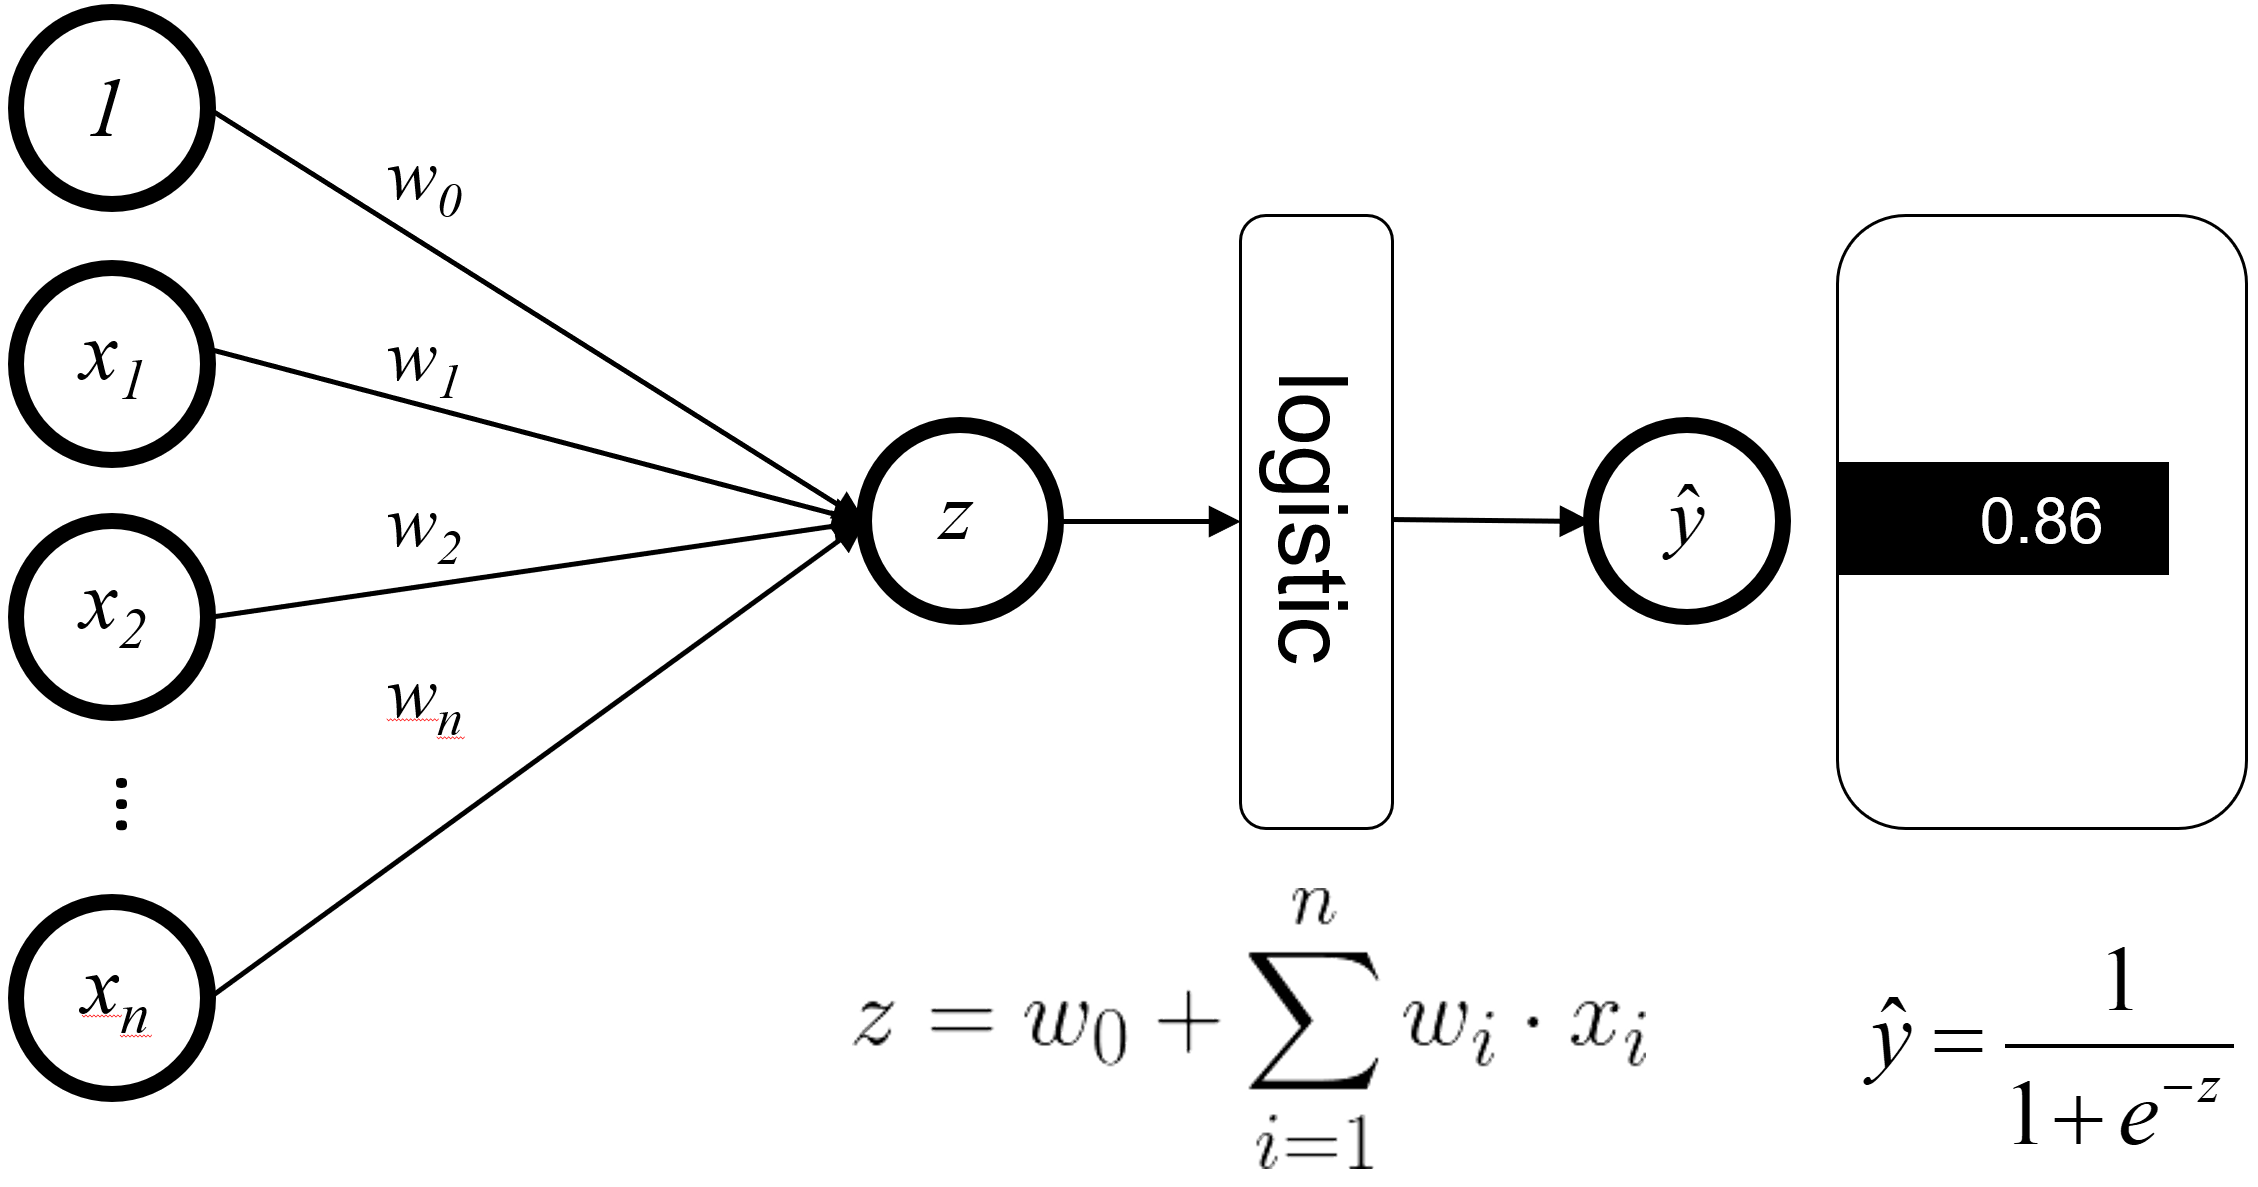
It multiplies the input vector (x) by the weight vector (w) and then adds the bias (b). This gives us a single number.
From Linear Regression to Logistic Regression
The calculation (w multiplied by x, plus b) is called Linear Regression. This calculation can result in a number that can be anywhere from very large to very small. But we need a number between 0 and 1. So, we add another step.
We use a function called Sigmoid to squash the linear regression results into the range of 0 to 1.
The Sigmoid Function
The Sigmoid function looks like this:
sigmoid(z) = 1 / (1 + e^(-z))
Where e is a mathematical constant (about 2.718), and z is the result of the linear regression calculation.
The Sigmoid function takes any number as input and outputs a value between 0 and 1. This value is our y-hat, which represents the probability of the input belonging to the positive class.

How Sigmoid Works
Let's look at some examples:
If z is 0, the Sigmoid function outputs 0.5.
If z is a very large positive number, the Sigmoid function outputs a value close to 1.
If z is a very large negative number, the Sigmoid function outputs a value close to 0.
Conclusion
Logistic Regression is a simple but effective algorithm for binary classification. It uses math operations and the Sigmoid function to make predictions. By understanding Logistic Regression, we can learn the basic concepts of neural networks in an easy way.

Ready to take your AI knowledge to the next level? Look for more tutorials to follow us on this journey of Deep Learning .
Subscribe to my newsletter
Read articles from Muhammad Fahad Bashir directly inside your inbox. Subscribe to the newsletter, and don't miss out.
Written by


