Exploring Performance- Strategies to Supercharge Your Web Applications
 NonStop io Technologies
Performance is the silent backbone of every great web application often underestimated but critical to success. Building a web app without prioritizing performance is like setting off on a journey without a map; planning with performance in mind paves the way for a smoother, faster, and more impactful experience.
What does Web Application Performance mean?
Performance in web applications refers to how efficiently and effectively the application caters to the user experience. This includes factors such as response time to requests, page load speed, responsiveness, and resource utilization. A high-performance web app guarantees quick load times, seamless interactions, and minimal downtime.
Some useful keywords:
Performance Profiling: Process involving the analysis of performance of web application which involves identifying the bottlenecks, areas that need improvement, and all the key metrics that can help pinpoint where the application may be lagging and provide a basis for targeted improvements.
Performance Optimization: This part refers to the techniques and actions taken to enhance the performance of the application based on the key points gathered from Profiling.
Performance Improvement: Performance improvement is a broader concept that encompasses Optimization as part of its process. It involves ongoing efforts to enhance and maintain consistent performance as the application grows and evolves.
How to track if your web application has performance issues!
We can track whether our web application is having performance issues or not by tracking for things like- Load time, Responsiveness, Scalability, Efficiency and many more. In order to have more detailed and clear picture of the performance you can also check for some popular Performance Tools:
Google Lighthouse
PageSpeed Insights
Identify key metrics:
Page load time: Identifying the actual time the complete page takes to load whenever we refresh it or navigate to the page. This includes the time required to load HTML, CSS, JavaScript, images, videos, and other resources, as well as the time it takes for all interactive elements to become functional.
First Contentful Paint (FCP): FCP measures the time between when the user navigates to a page and when any visible content is rendered on the screen, which includes text, images which can be background images as well along with <svg> or <canvas> elements.
Ideally, FCP should be under 1.8 seconds. Values exceeding this threshold indicate performance issues that need improvement
For detailed documentation on FCP, you can visit What is your FCP Score?Largest Contentful Paint (LCP): LCP is the time taken by the largest visible content element text block, image, and video to render when the user navigates to the page.
With LCP the good score should always be below 2.5 seconds to have a good user experience, which can affect performance.
For detailed documentation on LCP, you can refer What is LCP?Total Blocking Time: refers to the duration after the First Contentful Paint (FCP) when the main thread is blocked by tasks that are too long for the browser to handle other activities.
A task is considered blocking if it runs for more than 50 milliseconds on the main thread. During this time, the browser cannot respond to user interactions, as it must wait for the current task to complete before executing others.
Factors contributing to these long tasks (such as inefficient JavaScript execution, large script parsing, heavy animations, or complex computations) can significantly impact TBT. This delay forces users to wait, resulting in a poor experience. Optimizing TBT involves reducing long-running tasks to ensure smoother, faster interactions.Cumulative Layout Shift (CLS): CLS measures the unexpected movement of page elements as a webpage load. It reflects how stable the content layout is while the page is being rendered. High CLS values indicate a poor user experience, as layout shifts can lead to confusion and unintended interactions.
Example:
Imagine visiting a webpage and attempting to click on a button immediately. However, as the page continues to load, a new image or ad appears, pushing the button to a different position. This causes you to accidentally click something else instead of your intended action. Such unexpected shifts can frustrate users and disrupt their experience.
With CLS the good score should always be below 0.1. Poor values \>0.1 can always result in poor user experience.
For detailed documentation on CLS, you can refer What is CLS?
How can Lighthouse help us in tracking the hotspots?
To better understand the structure and key insights provided by a Google Lighthouse Report, let’s explore an example. The following images highlight various sections of the report, showcasing essential performance metrics and optimization suggestions.

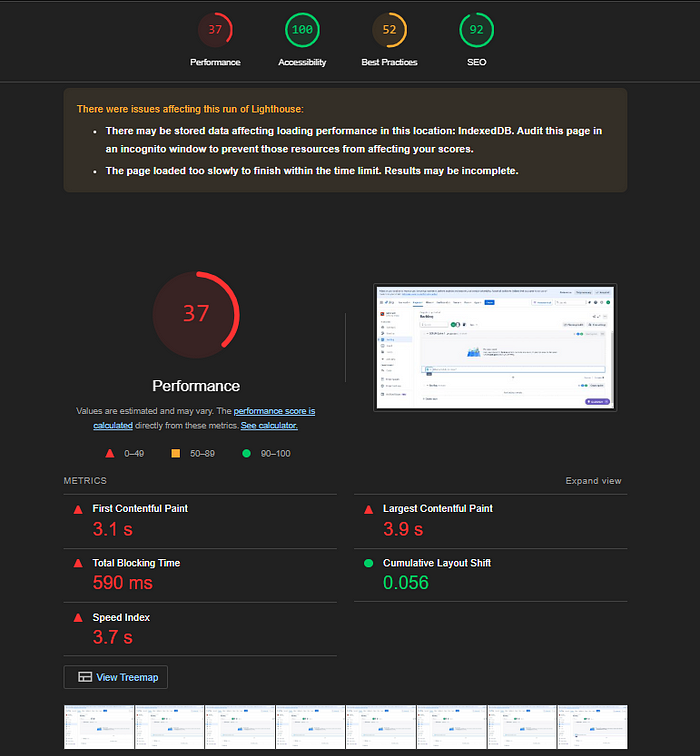
Fig 1: Google Lighthouse Performance Report for Jira
The image above represents the Lighthouse report for the Jira Dashboard. While the Accessibility and Best Practices parameters maintain decent scores, the other performance metrics show significant areas for improvement
Notably, the First Contentful Paint takes 3.1s which is considerably higher than the recommended benchmark for a smooth user experience. Similarly, the Largest Contentful Paint (LCP) also exceeds optimal thresholds, indicating delays in rendering key visual elements on the screen.

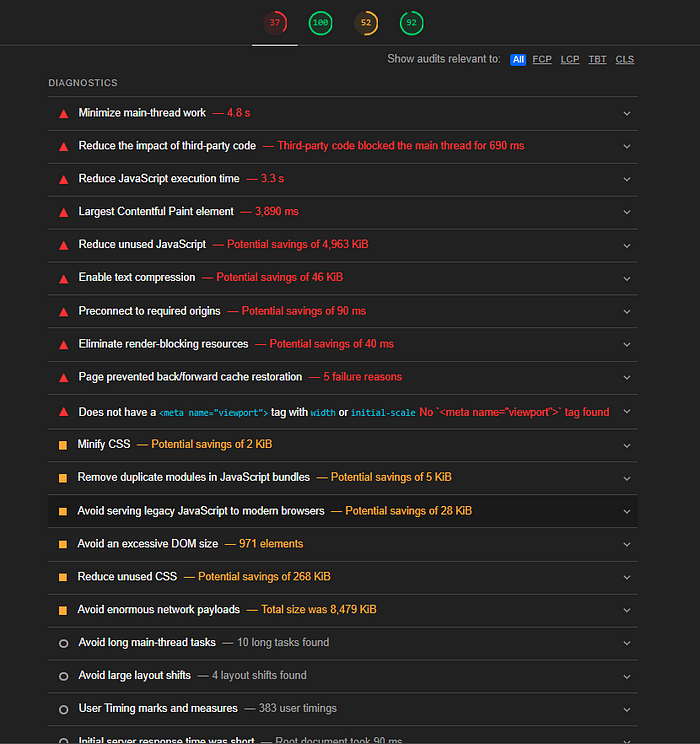
Fig 2: Report summary of Lighthouse
Lighthouse not only provides performance ratings but also generates a comprehensive report with actionable recommendations. This report highlights the areas that need attention when the performance of our web application is not up to the mark.
With the help of these insights, we can identify the bottlenecks and hotspots where we can plan to optimize things and implement the best practices to significantly improve our application performance.
Conclusion
Ensuring optimal web application performance is essential for delivering a seamless and engaging user experience. By tracking key metrics, leveraging tools like Google Lighthouse, and addressing performance bottlenecks through targeted optimizations, we can create faster, more efficient applications.
Continuous monitoring and improvement will help maintain high performance as the application evolves, ultimately leading to greater user satisfaction and success.
Subscribe to my newsletter
Read articles from NonStop io Technologies directly inside your inbox. Subscribe to the newsletter, and don't miss out.
Written by

NonStop io Technologies
NonStop io Technologies
Product Development as an Expertise Since 2015 Founded in August 2015, we are a USA-based Bespoke Engineering Studio providing Product Development as an Expertise. With 80+ satisfied clients worldwide, we serve startups and enterprises across San Francisco, Seattle, New York, London, Pune, Bangalore, Tokyo and other prominent technology hubs.