Top 5 React Stock Chart Libraries for 2025
 syncfusion
TL;DR: Let’s see how modern React Stock Chart Libraries enhance financial data visualization with real-time updates and interactivity. This blog explores key advancements like improved performance, mobile-first design, and expanded chart types. We also review the top five libraries: Syncfusion®, Highcharts, amCharts, AnyChart, and CanvasJS. Choose the best tool to build powerful stock market visualizations in 2025!
Welcome to our Weekly Data Visualization blog series!
Today’s post will examine the latest advancements in React Stock Chart Libraries.
These tools empower developers to visualize financial data and how market trends are experienced. They provide interactive, real-time updates that transform raw financial data into insightful visualizations. These libraries have evolved significantly, introducing features that enhance usability, performance, and customization.
Key advancements in modern React Stock Chart Libraries
Improved performance: Modern stock chart libraries now support efficient real-time data streaming, ensuring smooth updates without performance lag, even when tracking high-frequency stock movements.
Mobile-first design: With the rise of mobile trading apps, these libraries prioritize touch-friendly interactions, responsive layouts, and adaptive designs for a seamless experience across all devices.
Advanced customization: Developers can fine-tune every chart aspect, from colors, fonts, and themes to grid lines and annotations, resulting in better branding and enhanced user experience.
Expanded chart types and indicators: Modern libraries offer a wide range of stock chart types, such as candlestick, OHLC, Heikin-Ashi, and Renko, along with built-in technical indicators like Bollinger Bands, MACD, RSI, and SMA.
With these advancements, choosing the right React Stock Chart Library is crucial for building powerful and intuitive financial apps.
This blog explores the top five React Stock Chart Libraries, their features, and how they help developers create professional stock market visualizations.
Top 5 React Stock Chart Libraries
Every great financial app needs a robust tool to visualize stock market data. Whether you’re developing a real-time trading platform, a financial analytics dashboard, or a market trend visualization tool, the right charting library can make all the difference.
Let’s explore the top five React Stock Chart Libraries that stand out in 2025:
Let’s explore each library in detail.
1. Syncfusion®React Stock Chart
The Syncfusion® React Stock Chart is the most popular, lightweight, and high-performance stock charting library. It offers a robust toolset for financial data visualization, multiple chart types, and built-in technical indicators for comprehensive analysis.
Key features
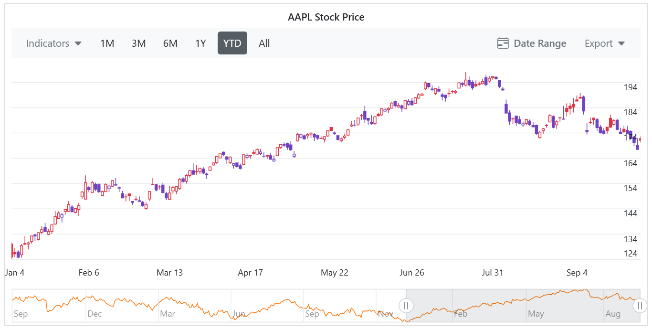
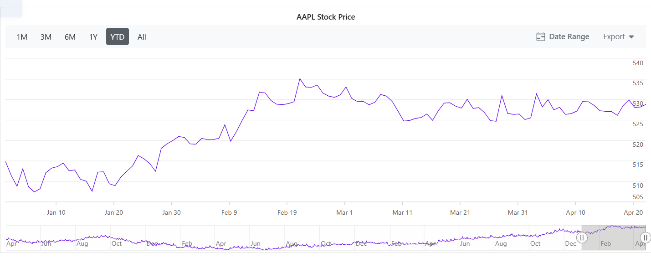
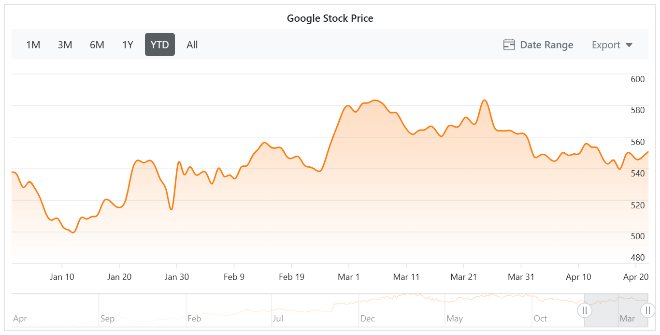
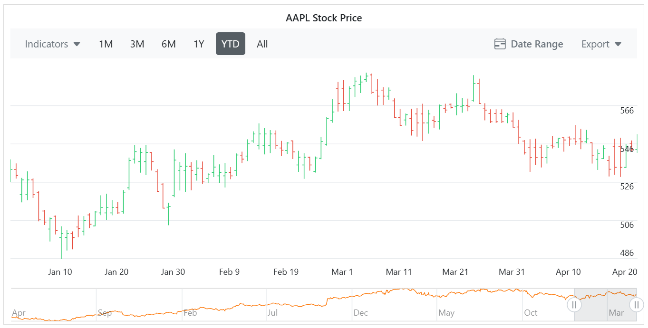
- Multiple chart types: Supports candlestick, OHLC, spline, spline area, area, Hilo, and line charts for various financial analysis needs. It also supports customizable multi-series stock charts for comparing different stocks.
Refer to the following images.

React Candle Chart

React Line Chart

React Spline Area Chart

React HiloOpenClose Chart
Built-in technical indicators: These includes Accumulation distribution, ATR, Momentum, SMA, EMA, MACD, RSI, Bollinger Bands, Stochastic, and TMA for advanced stock analysis.
Multiple axis options: Supports multiple axis types, including DateTime, DateTimeCategory, and Logarithmic axes for flexible data visualization.
Rich interactivity and responsiveness: Provides features like zooming, panning, crosshairs, and live updates to create dynamic and user-friendly visualizations.
Multi-series support: Enables plotting multiple stock indices or assets in the same chart for comparative
Multi-range selection: Allows users to switch between timeframes (e.g., 1D, 5D, 1M, 6M, YTD, 1Y, Max) for in-depth stock trend analysis.
Range selector & navigator: An interactive range selector to zoom into specific periods and a navigator to scroll through historical stock data easily.
Customization and theming: Allows adding custom labels, trendlines, and stock events to highlight earnings reports, stock splits, or other key financial events.
Optimized for large-scale data: Delivers fast rendering and smooth performance, even with large-scale data points.
Real-time streaming support: Seamlessly integrates with WebSocket APIs to fetch and update livestock prices dynamically.
Mobile-friendly design: Responsive and touch-enabled for seamless performance on all devices.
Seamless data integration: Easily connects with REST APIs, databases, and real-time data sources.
Comprehensive export & print options: Supports exporting charts in PNG, JPG, PDF, XLSX, CSV, and SVG formats, along with direct printing capabilities.
Enhanced accessibility: Designed to meet ADA, Section 508, WCAG 2.2 standards, and ARIA roles, ensuring compliance with accessibility guidelines for screen readers and keyboard navigation.
Installation
Run the following command to install Syncfusion® React Charts:
npm install @syncfusion/ej2-react-charts
Now, you’re ready to unleash the full potential of Syncfusion® React Stock Chart in your project! Ready to learn more? Explore our comprehensive documentation for step-by-step guidance.
With its robust performance, extensive chart collection, and flexible licensing (including a free community license), Syncfusion® is a standout choice for React apps.
2. Highcharts® React Stock Chart
Highcharts® React Stock Charts offers a sleek interface and robust functionality for analyzing stock trends and live data updates.
Key features
Rich stock chart collection: Supports OHLC, candlestick, and range series for detailed stock analysis.
Interactive range selector: Users can filter data by different timeframes (e.g., 1 month, 6 months, 1 year).
Real-time data streaming: Supports WebSocket integration for live market feeds.
Advanced technical indicators: Includes Bollinger Bands, SMA, MACD, and RSI.
Cross-platform support: Works well on desktop and mobile devices.
Installation
To integrate Highcharts React Stock Charts, run the following commands:
npm install highcharts –save
npm install highcharts-react-official
3. amCharts 5 Stock Chart
The amCharts® 5 provides interactive stock charts. It is ideal for apps requiring smooth animations and highly customizable visualizations.
Key features
Modern, animated stock charts: Supports candlestick, OHLC, step line, and Renko charts.
Pre-built technical indicators: Includes SMA, EMA, MACD, and more.
Advanced customization: Allows gradient fills, shadows, and stylish themes.
Mobile-first design: Ensures a smooth experience on touch devices.
Installation
To integrate amCharts 5 into your project, run the following command:
npm install @amcharts/amcharts4
4. AnyChart® React Stock Chart
AnyChart® is a stock charting solution that supports large datasets with high performance.
Key features
Over 20 technical indicators: Includes Fibonacci retracement, SMA, Bollinger Bands, and more.
Data grouping and range selection: Users can easily navigate through different timeframes.
Export capabilities: Save charts as PNG, PDF, Excel, or SVG.
Customization-friendly: Modify colors, labels, and tooltips with ease.
Installation
To integrate the AnyChart React Stock Chart into your project, run the following command:
npm install anychart-react
5. CanvasJS® React Stock Chart
The CanvasJS® is a lightweight and high-performance stock charting library known for fast rendering and smooth animations.
Key features
Real-time stock data visualization: Supports dynamic updates for live trading apps.
Multiple stock chart types: Includes candlestick, OHLC, and line charts.
Zooming and panning: Allows users to explore stock price movements.
Lightweight and fast: Ideal for apps that need smooth performance.
Free version available: Suitable for personal projects and educational use.
Installation
To install the CanvasJS React Stock Chart, use the following npm command:
npm install @canvasjs/react-charts
Conclusion
Thank you for exploring this blog, where we’ve examined five popular React stock chart libraries, each with its own strengths and weaknesses. Selecting the best library for your project depends on your specific requirements.
For instance, Syncfusion® React Stock Chart offers extensive features, including built-in technical indicators, making it a robust choice for financial apps. Highcharts® is known for its user-friendly API and export options. amCharts® 5 provides visually appealing and customizable stock charts. AnyChart® is optimized for handling large datasets, while CanvasJS® stands out for its rendering capabilities.
To unlock the full potential of stock market data visualization, carefully evaluate your project needs and choose the library that best meets your objectives.
Feel free to contact us through our support forums, support portal, or feedback portal. We are always happy to assist you!
Related Blogs
Subscribe to my newsletter
Read articles from syncfusion directly inside your inbox. Subscribe to the newsletter, and don't miss out.
Written by

syncfusion
syncfusion
Syncfusion provides third-party UI components for React, Vue, Angular, JavaScript, Blazor, .NET MAUI, ASP.NET MVC, Core, WinForms, WPF, UWP and Xamarin.